Risk Warning: This analysis is a case study for informational purposes only and not a recommendation to buy or sell any security.
Stock Market Outlook: February 8th =
Downtrend
Author: J.Wenger ---- Published: February 08, 2026 ---- Last Updated: 2026-02-08
The stock market outlook shifted to a downtrend on Thursday, but many bullish biases remain intact. A continuation from Friday's reversal will make the change short lived.Gold, Consumer Staples, and Mid-Cap Value outperformed; Oil/bitcoin, Communications, and Large-Cap growth lagged. Macro data was mixed, and non-farm payroll data was delayed until this week, joining retail sales, and CPI.
TREND ANALYSIS
The S&P500 ( $SPX ) fell 0.1% last week, as price traded to and through key levels:- ~1% above the 50-day moving average
- ~7% above the 200-day moving average
ADX Directional Index: Bearish
- ADX direction indicators remained bearish all week
- Price broke the 50 dma on elevated trading volume Thursday, moving the signal to bearish and shifting the outlook
- Price recovered bullishly Friday morning, flipping the indicator back to bullish.
- On-balance volume moved to neutral on Tuesday, testing it's trendline for the first time since August
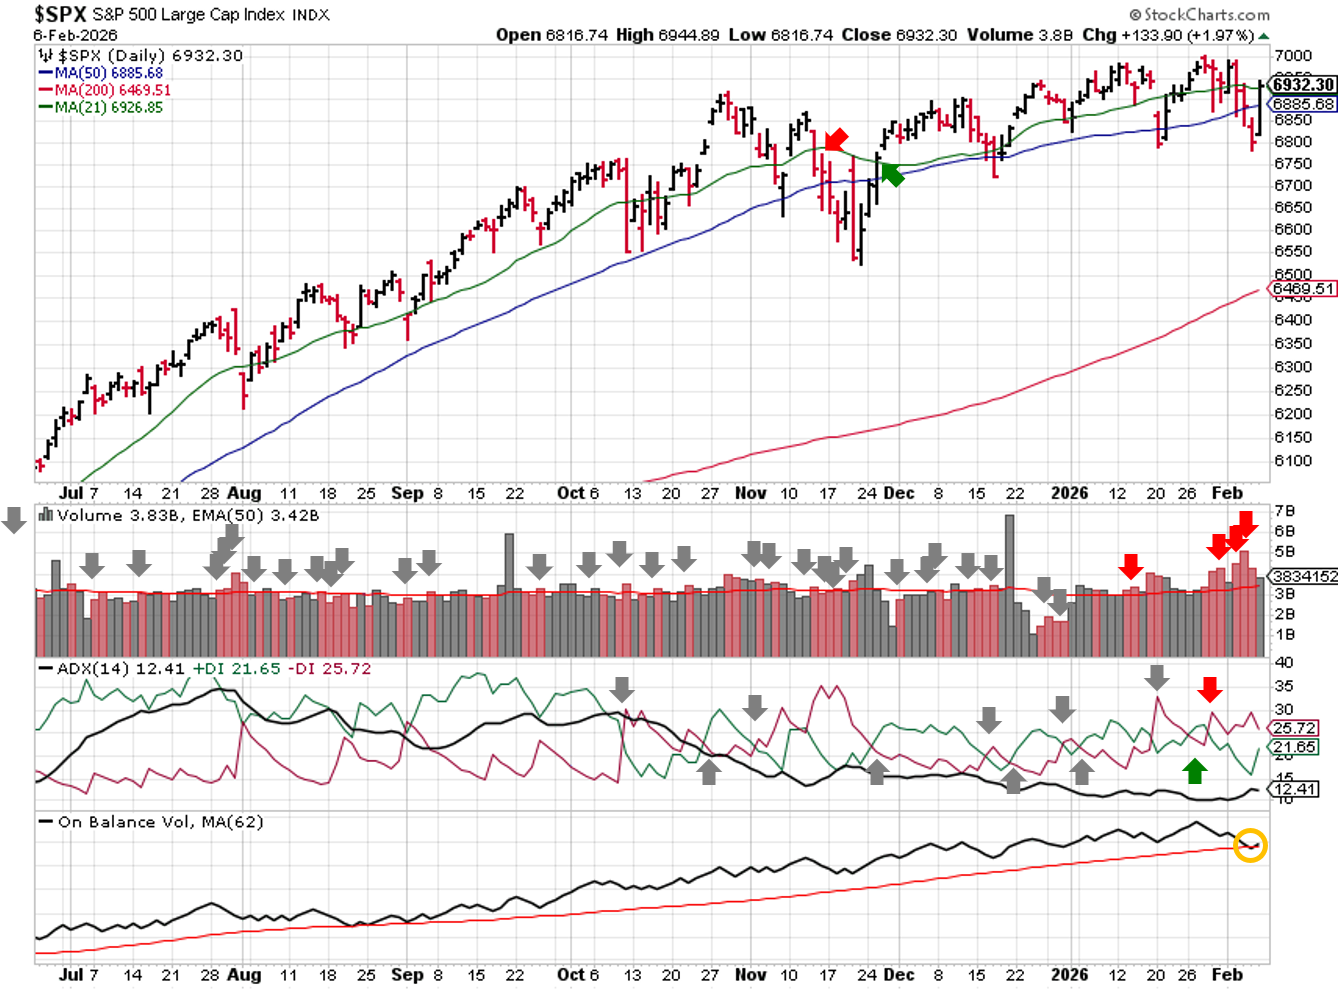
Technical Analysis – $SPX – 2026-02-08
PERFORMANCE HIGHLIGHTS & COMPARISONS
S&P500 Sectors
Consumer Staples ( $XLP ) outperformed, though several sectors kept pace. Communications ( $XLC ) underperformed. Consumer Discretionary and Technology ( $XLY, $XLK ) fell to bearish bias. Communications and Utilities ( $XLC, $XLU ) moved to neutral, and Financials ( $XLF ) moved back up to bullish.
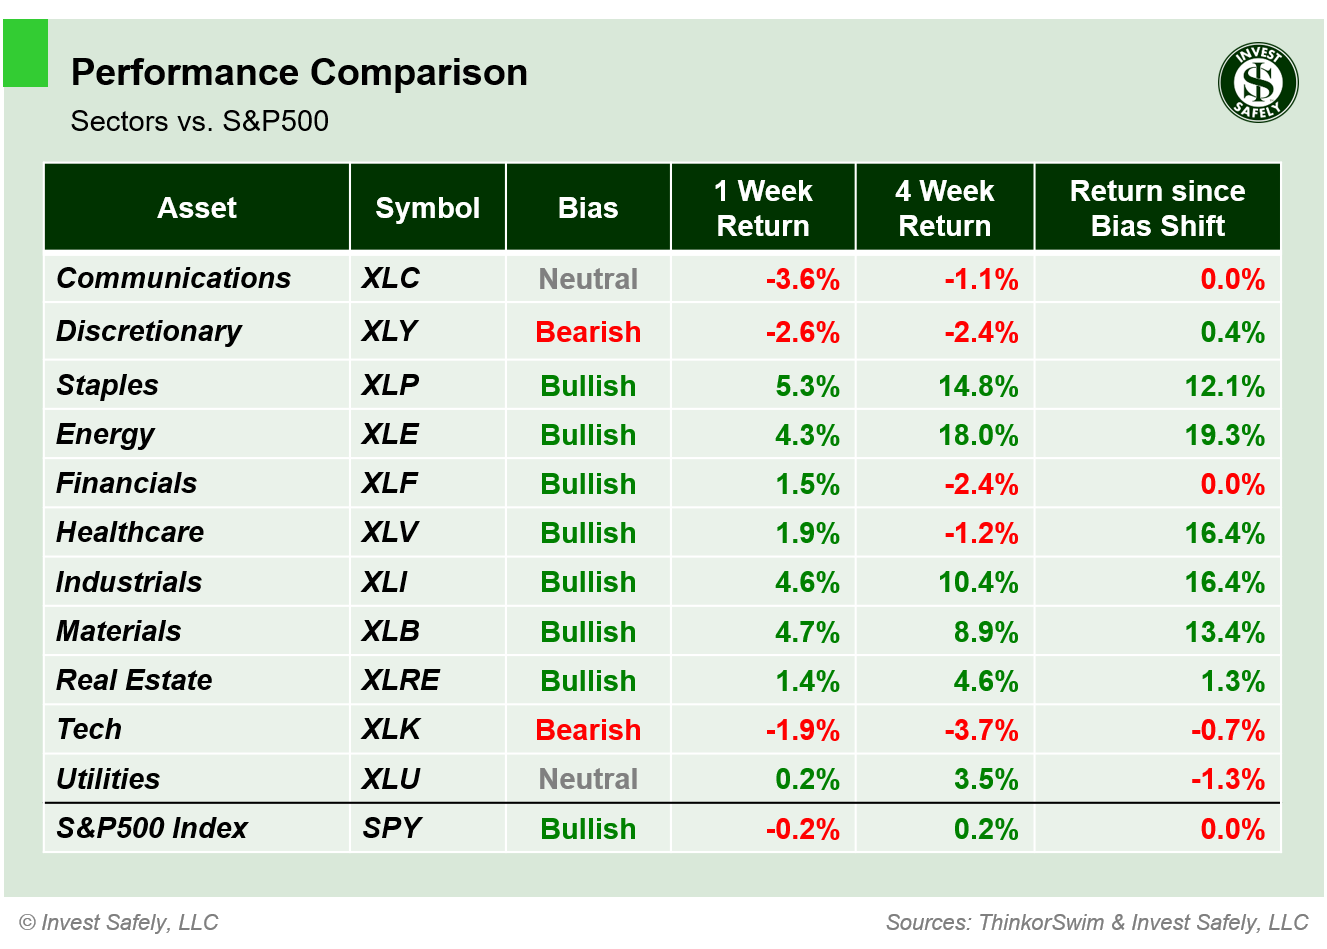
S&P500 Sector Performance – 2026-02-08
S&P500 Investing Styles
Mid-cap growth ( $IJH ) led upside performance, and Large Cap Growth ( $IWF ) was the worst style. Last week's bias changes reversed: Mega Cap Growth ( $OEF ) returned to neutral bias, and Defensives ( $POWA ) to bullish.
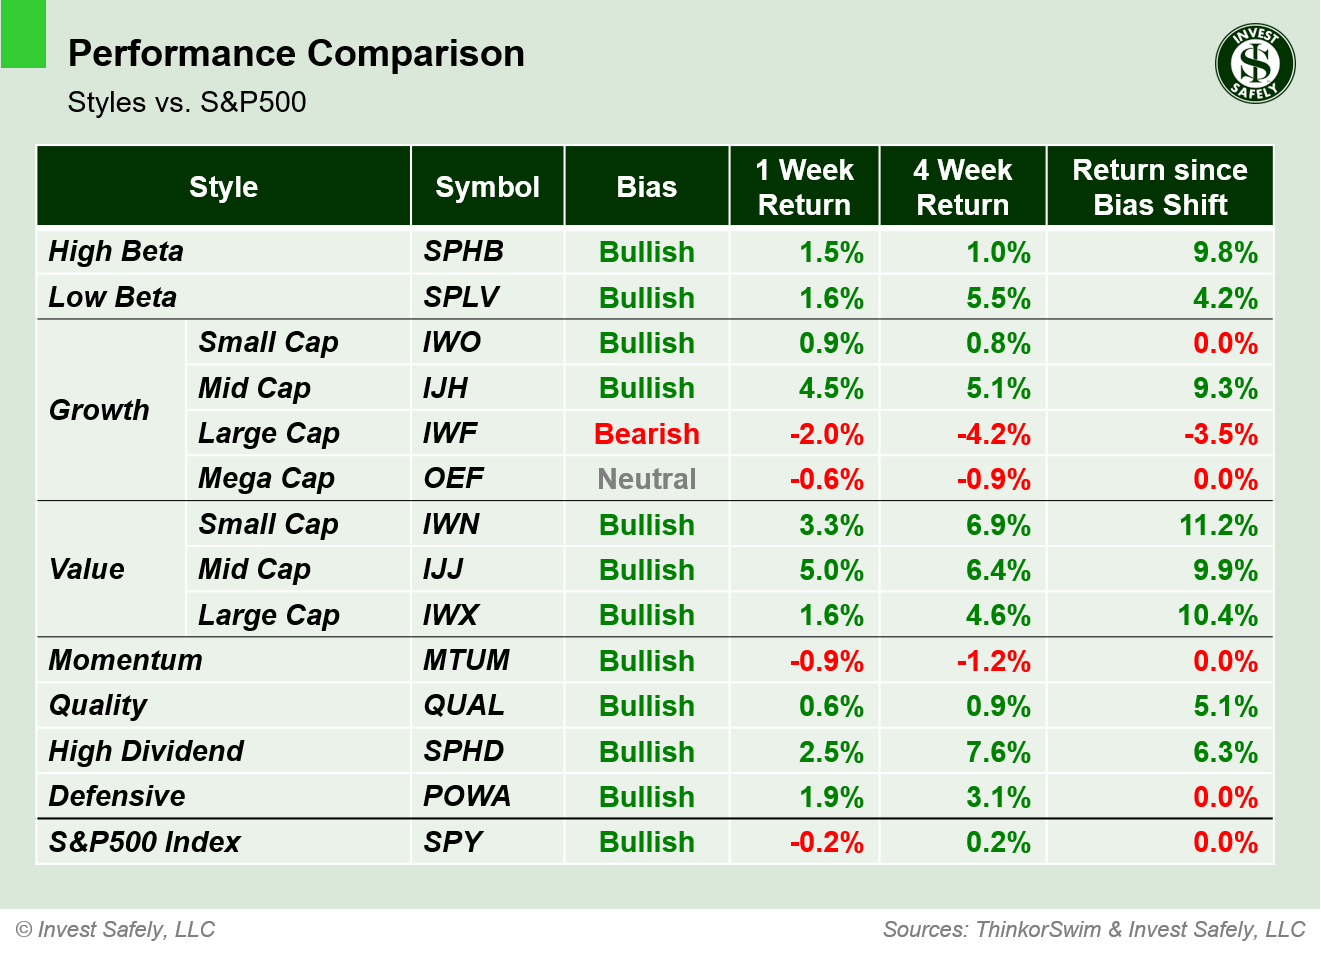
Style Performance vs. S&P500 – 2026-02-08
Asset Classes
Gold ( $GLD ) led asset class returns. Oil reversed course from last week's gains, but Bitcoin ( $IBIT ) was the biggest loser again. DM bonds ( $BNDX ) moved up to neutral bias, and EM bonds ( $PCY ) retreated to neutral.
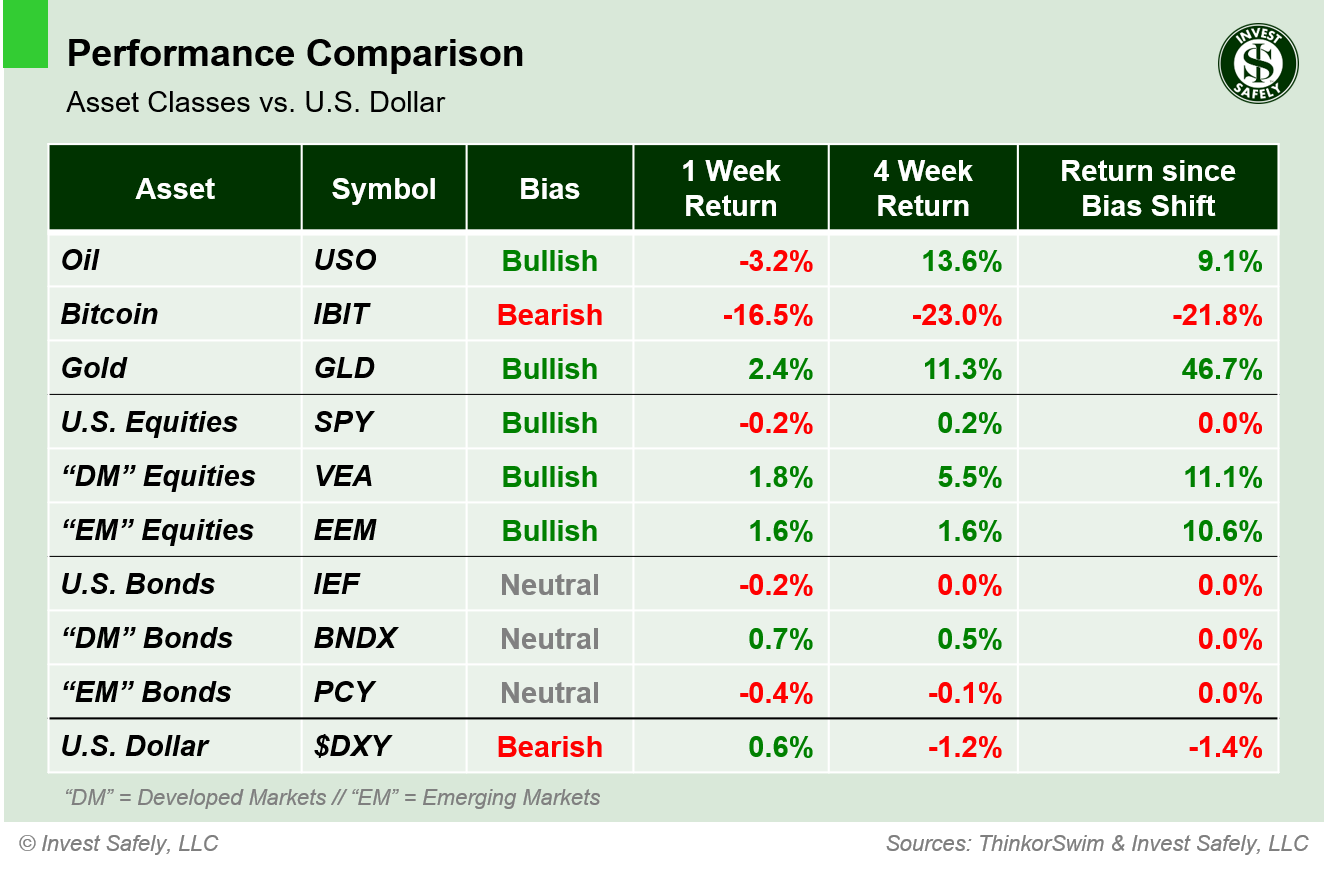
Asset Class Performance vs. U.S. Dollar – 2026-02-08
COMMENTARY
Markets
Institutions were selling, but selectively. Index prices fell below key levels, then recovered. The S&P500 trend indicators flipped to bearish, but the $SPY bias is back to bullish. Some names broke out, some broke down. Talk about mixed messages.
- Traders sold large cap growth ( $IWF ) and technology stocks ( $XLC, $XLY, $XLK ).
- Traders bought Staples, Energy, Industrials, Materials ( $XLP, $XLE, $XLI, $XLB ) and value stocks ( $IWN, $IJJ, $IWX ).
Tech companies are the largest weights in general indexes, like the S&P500 and the Nasdaq 100, so their capital flows have an oversized impact on index price movement. Check out the equal weight version of the S&P500 ( $RSP ): price broke out to new highs on Friday!
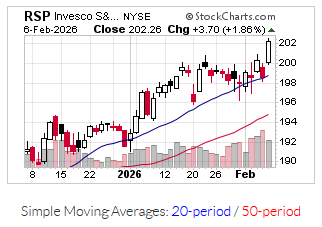
$RSP Price & Volume Chart - 2026-02-08
I'd say the market is mixed, the goal of these weekly exercises is preserving capital and reducing losses, so erring on the side of caution is the correct course of action. There is always another trade, but you have to have capital to participate.
Macroeconomic Data and Policy
January ISM Manufacturing PMI improved to 52.6%, representing the first expansion in 12 months. ISM Services PMI remained steady at 53.8%.Job openings (JOLTs) fell year over year, signaling softer labor demand. And consumer sentiment was better than expected, but well below last year's levels.
Non-farm payrolls were delayed a week due to the government shutdown.
Geopolitics
According to a U.S. trade representative, the U.S. is developing plans with Mexico, the European Union and Japan to implement minimum prices for critical, rare-earth minerals, triggering a sell-off in the sector.The partial U.S. government shutdown ended last week.
EYES ON THE HORIZON
This week brings several important data releases:- Monday: --
- Tuesday: Retail Sales
- Wednesday: Rescheduled NFP
- Thursday: Existing Home Sales
- Friday: CPI
Best to Your Week!
P.S. If you find this research helpful, please tell a friend.
If you don't, tell an enemy.
Share this post on social media:
Facebook (@InvestSafely)
X / Twitter (@investsafely)
LinkedIn (@Invest-Safely)
Instagram (@investsafely)
Content Sources: Bloomberg, CNBC, Federal Reserve Bank of St. Louis (FRED), Hedgeye, StockCharts.com, TradingEconomics.com, U.S. Bureau of Economic Analysis, U.S. Bureau of Labor Statistics.
Price and Volume charts provided courtesy of stockcharts.com.
Performance Methodology: All sector performance data is sourced from ThinkorSwim and reflects price‑only returns calculated using end‑of‑week closing data. Bias classifications follow a proprietary Invest Safely, LLC model and update only when trend conditions meet predefined thresholds. All calculations are consistent across every chart on this page.
Disclaimer: Invest Safely, LLC is an independent investment research and online financial media company. Use of Invest Safely, LLC and any products available through Invest‑Safely.com is subject to our Terms of Service and Privacy Policy.
Not a recommendation to buy or sell any security.
Looking for more information on the Stock Market Outlook Signals? You'll find it here:
 If you're interested in learning more about the relationship between price and volume, or how to find and trade the best stocks for your growth strategy, check out this book via the following Amazon affiliate link:
How to Make Money in Stocks: A Winning System in Good Times and Bad.
It's one of my favorites.
In the past, I reviewed market outlook signals as if they were a mechanical trading system, while pointing out issues and making adjustments. The goal is to give you to give you an example of how to analyze and continuously improve your own systems.
- 2015 Performance - Stock Market Outlook
- 2016 Performance - Stock Market Outlook
- 2017 Performance - Stock Market Outlook
- 2018 Performance - Stock Market Outlook
- 2019 Performance - Stock Market Outlook
- 2020 Performance - Stock Market Outlook
For historical Elliott Wave commentary and analysis, go to ELLIOTT WAVE lives on by Tony Caldaro.
IMPORTANT DISCLOSURE INFORMATION
This material is for general communication and is provided for informational and/or educational purposes only. None of the content should be viewed as a suggestion that you take or refrain from taking any action nor as a recommendation for any specific investment product, strategy, or other such purpose. Certain information contained herein has been obtained from third-party sources believed to be reliable, but we cannot guarantee its accuracy or completeness.
To the extent that a reader has any questions regarding the applicability of any specific issue discussed above to his/her individual situation, he/she is encouraged to consult with the professional advisors of his/her choosing. Invest Safely, LLC is not a law firm, certified public accounting firm, or registered investment advisor and no portion of its content should be construed as legal, accounting, or investment advice.
The material is not to be construed as an offer or a recommendation to buy or sell a security nor is it to be construed as investment advice. Additionally, the material accessible through this website does not constitute a representation that the investments described herein are suitable or appropriate for any person.
Hypothetical Presentations:
Any referenced performance is “as calculated” using the referenced funds and has not been independently verified. This presentation does not discuss, directly or indirectly, the amount of the profits or losses, realized or unrealized, by any reader or contributor, from any specific funds or securities.
The author and/or any reader may have experienced materially different performance based upon various factors during the corresponding time periods. To the extent that any portion of the content reflects hypothetical results that were achieved by means of the retroactive application of a back-tested model, such results have inherent limitations, including:
Model results do not reflect the results of actual trading using assets, but were achieved by means of the retroactive application of the referenced models, certain aspects of which may have been designed with the benefit of hindsight
Back-tested performance may not reflect the impact that any material market or economic factors might have had on the use of a trading model if the model had been used during the period to actually manage assets
Actual investment results during the corresponding time periods may have been materially different from those portrayed in the model
Past performance may not be indicative of future results. Therefore, no one should assume that future performance will be profitable, or equal to any corresponding historical index.
The S&P 500 Composite Total Return Index (the "S&P") is a market capitalization-weighted index of 500 widely held stocks often used as a proxy for the stock market. Standard & Poor's chooses the member companies for the S&P based on market size, liquidity, and industry group representation. Included are the common stocks of industrial, financial, utility, and transportation companies. The S&P is not an index into which an investor can directly invest. The historical S&P performance results (and those of all other indices) are provided exclusively for comparison purposes only, so as to provide general comparative information to assist an individual in determining whether the performance of a specific portfolio or model meets, or continues to meet investment objective(s). The model and indices performance results do not reflect the impact of taxes.
Investing involves risk (even the “safe” kind)! Past performance does not guarantee or indicate future results. Different types of investments involve varying degrees of underlying risk. Therefore, do not assume that future performance of any specific investment or investment strategy be suitable for your portfolio or individual situation, will be profitable, equal any historical performance level(s), or prove successful (including the investments and/or investment strategies describe on this site).
Investing Process Links
Stabilize- Organize your $$$
- Manage your $$$
Plan
- Why You Invest
- Ways to Invest
- Where to Invest
- What to Invest In
Execute
- When to Invest
- How Much to Invest
- Buying & Selling
Monitor
- Track The Market
- Track Your Returns
Reflect & Adjust
- Improve Your Returns
- Adjust your Holdings
Popular Pages
- Jim Cramer- Personal Incomes Statements
- Hyperinflation
- Calculating Beta
- SMART Financial Goals
Blogroll
- Advisor Perspectives- Dividend Growth Investor
- Elliott Wave Lives On
- On My Radar | CMG Wealth
- Sure Dividend
- The Big Picture
- The Fat Pitch
- Thoughts from the Frontline
- Trader Feed
Sponsored Links
Invest Safely provides valuable, time-saving info about personal finance, money management, and investing.


