Stock Market Outlook
2019 Performance
It is time! Time for the annual review of the Stock Market Outlook's performance.

Back in 2014, I started publishing weekly posts on the current stock market conditions in the United States.
The content evolved over time, but remains an example of the steps you can take to “monitor” the current state of a market. With this information, you can figure out if it’s a good time to put your money “at risk”.
But monitoring market conditions is just one part of the process. You need to take action (e.g. the “execute” step in the safe investing process). So in 2016, I created a simple trading system using rules and criteria for entering and exiting trades, based on the weekly market outlook signals.
With signals in hand, it’s possible to estimate profits and losses from the system. And that theoretical performance allows us to discuss and determine what, if any, adjustments are needed. Evaluating and improving the process is critical to achieving better results (the “adjust” step).
Looking Back
Here's what I said about this year when I posted the 2018 performance review last January:
-
I’m not sure what to expect in 2019. The U.S. government was shut-down for almost the entire month of January, and we only have a stop gap funding measure in place right now (ed. - I bet you totally forgot about that!).
Tariff impacts are working their way through the supply chain and into corporate financials, and the US still doesn’t have a trade deal with China…not to mention the slowing Chinese economy, Brexit, ballooning corporate debt, etc., etc., etc..
Yet, despite all that, the U.S. equity markets made an impressive recovery from the brutal sell-off at the end of 2018, based on little more than the Fed backing off its interest rate and quantitative tightening policy!
“Little more” than the Fed? The Fed is all that we needed last year! 2019 was amazing for the stock market. The low for the year occurred on the second day of trading (Jan 3rd), and the high occurred on December 27th. Prices rocketed higher through Q1, traded sideways from May until October, then rocketed higher again to close out the year. It was a true, “sell in May and Go Away” market.
Stock Market Outlook in 2019
With such a great year in the books, I expected to see some money left on the table, so to speak. It’s the “cost” of avoiding really bad downtrends.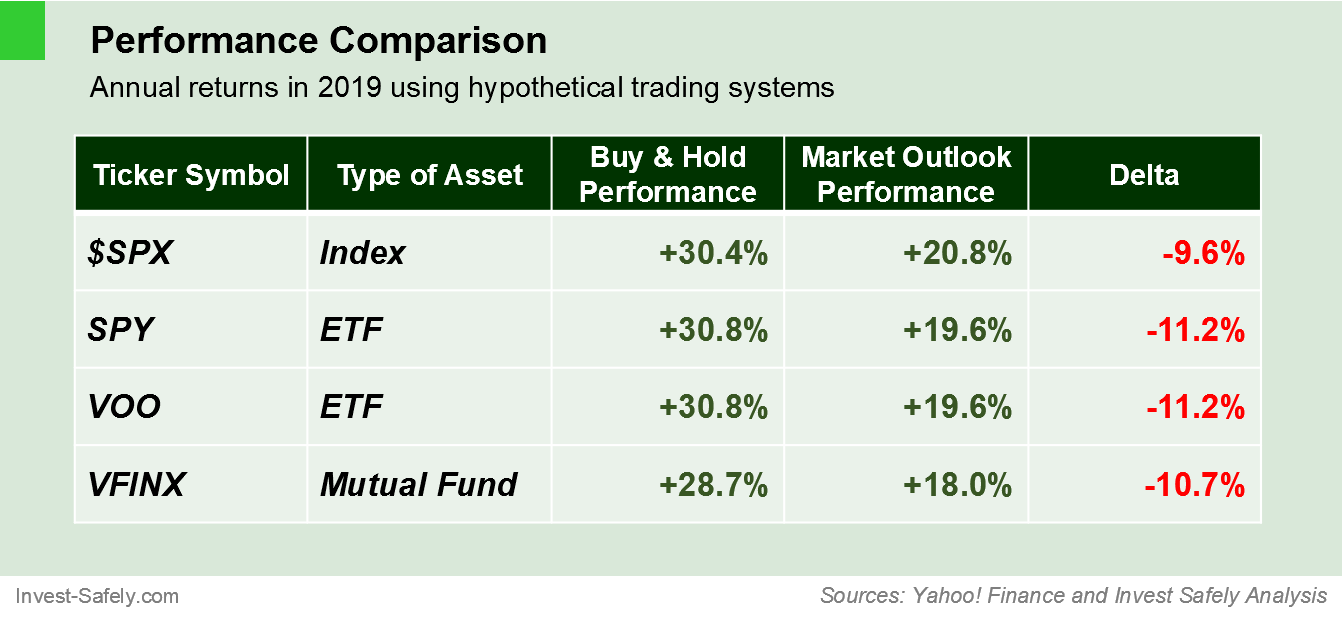
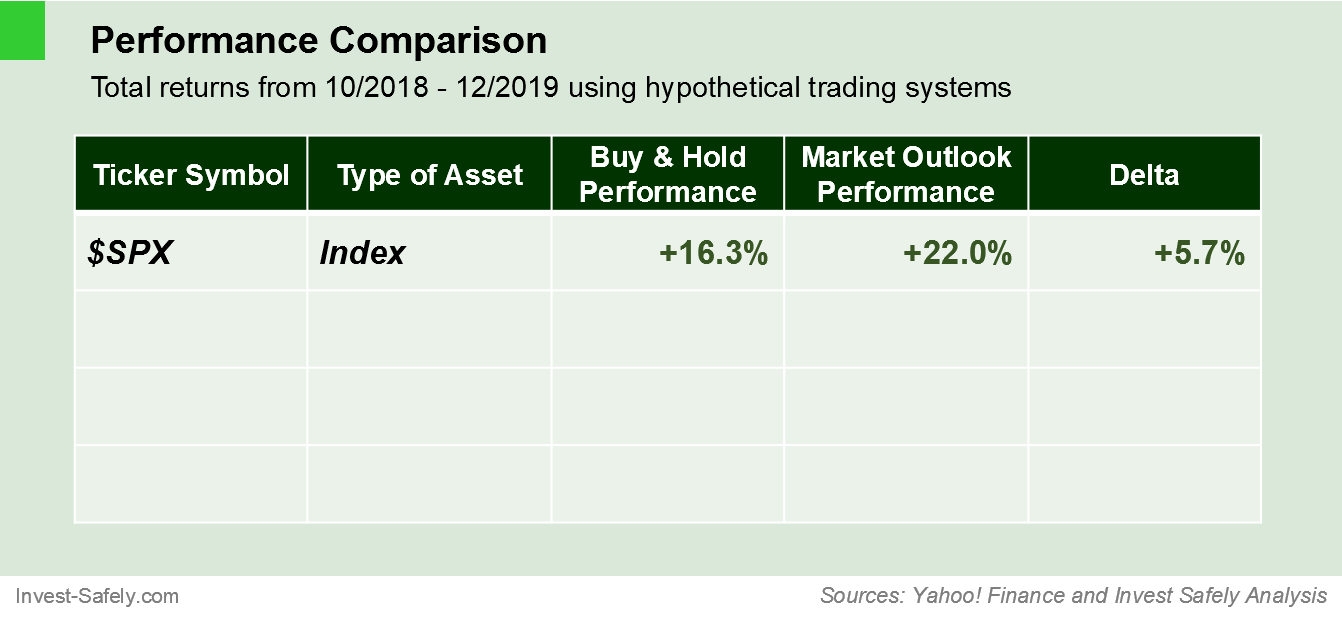
2019 Performance Analysis
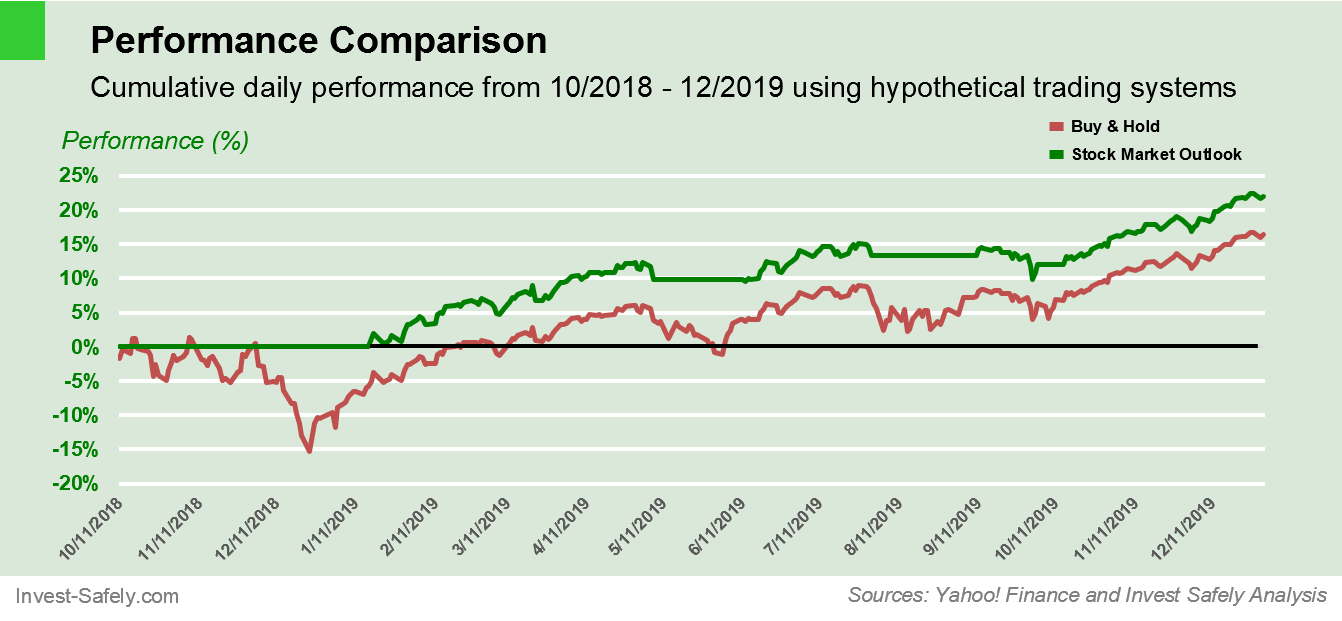
Like years past, I overlaid uptrends and downtrends from the stock market outlook on the S&P500 price chart: red for downtrends and green for uptrends. Also included are the entry and exit points: green circles for entry and red circles for exits.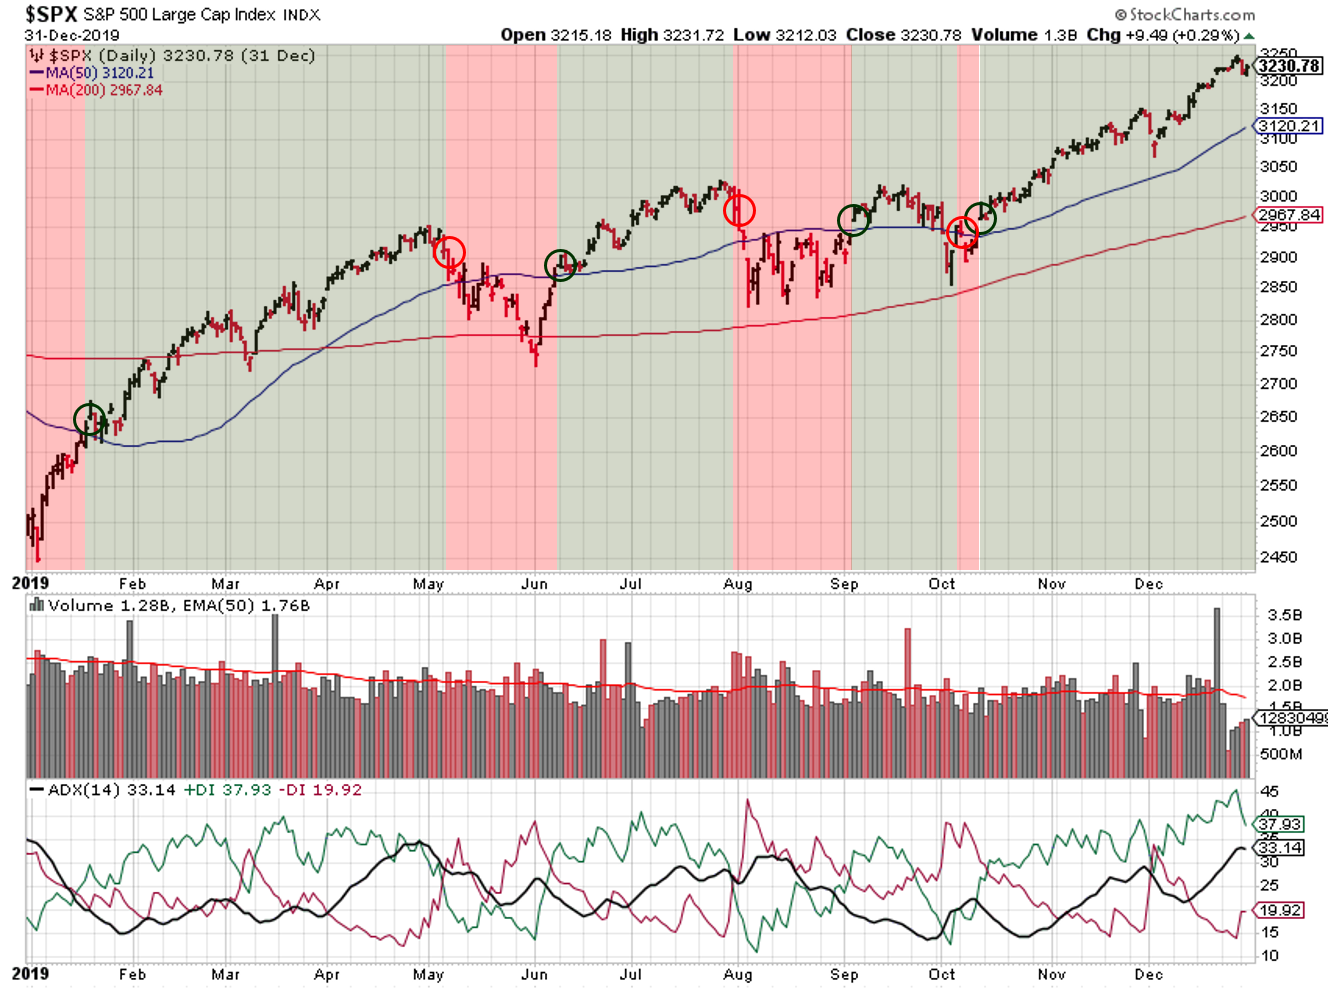
None of the trades really stand out; no large whiplashes or timing issues like we’ve seen in the past. The S&P500 experienced 2 major drawdowns:
- An 8.1% decline between May 3 and June 3
- A 7.5% decline between July 26 and August 14
So how much did the start of the year impact the performance comparison? Bigly.
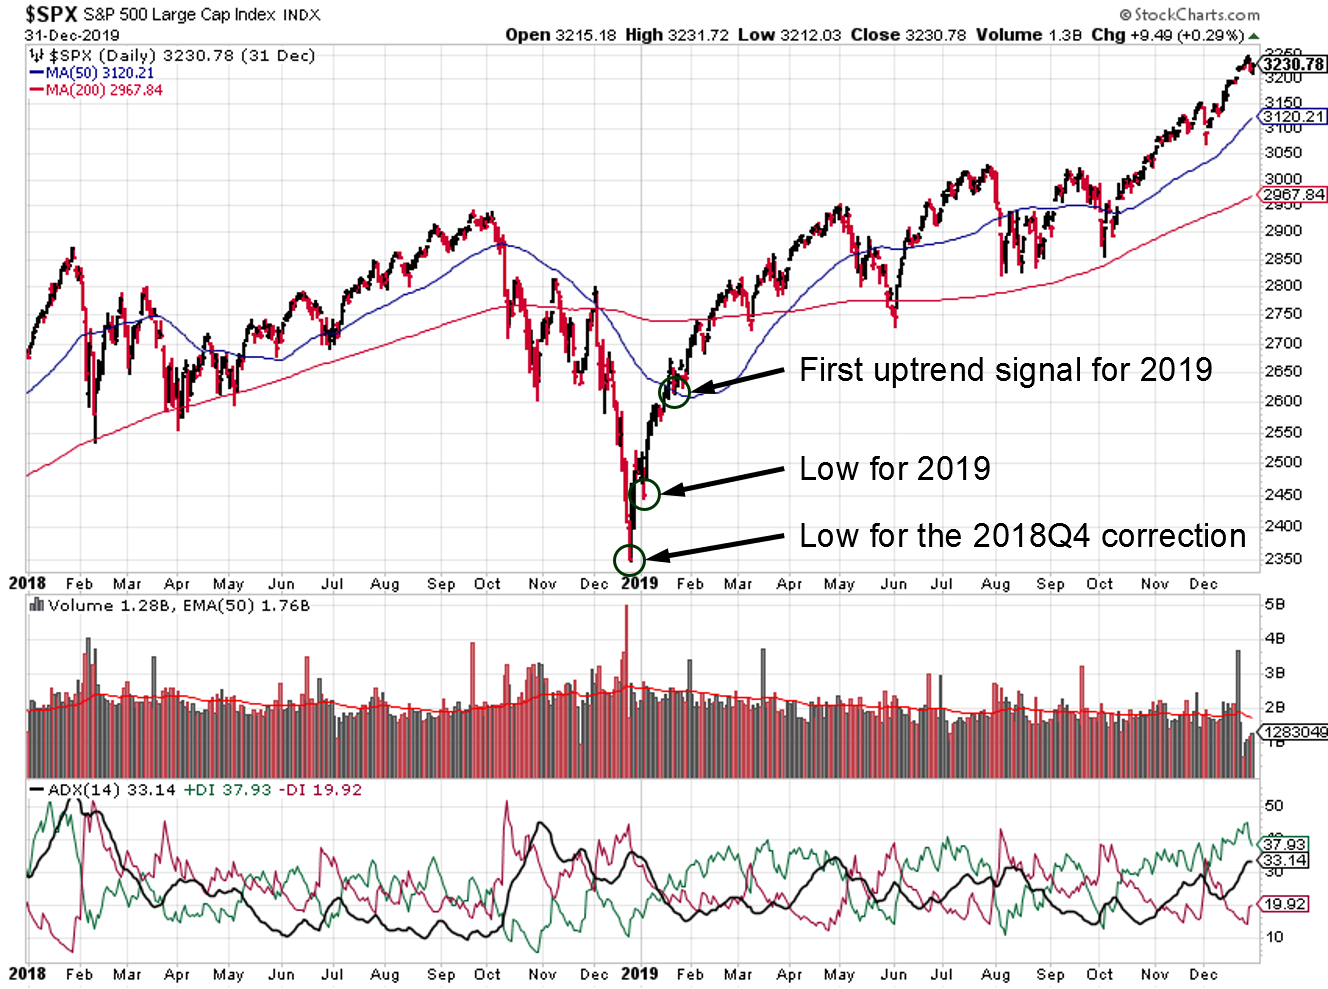
As we know, the low price for 2019 occurred two days after the start of trading for the year; almost perfect timing for buy and hold performance. The stock market outlook signaled a change on the close of January 17th, so the entry price is market open on January 18th.
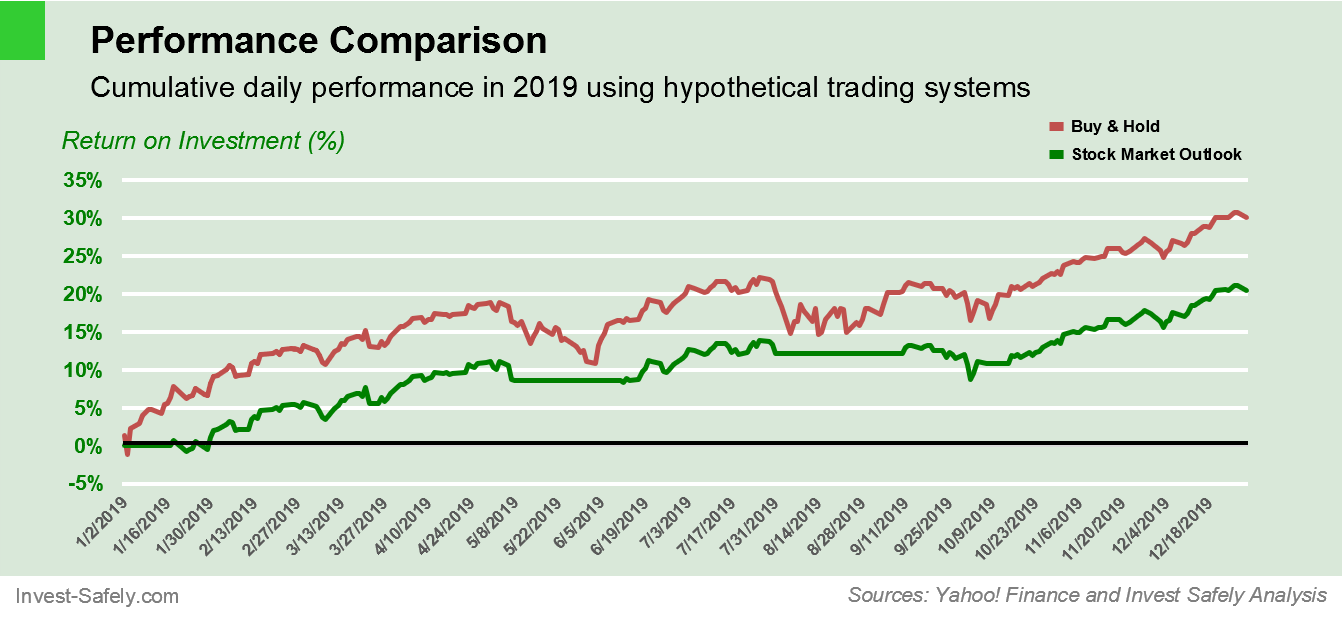
Between the 2nd and the 18th, the market gained 7%. Almost the entire difference between the stock market outlook and buy and hold occurred while waiting for confirmation of the uptrend. So the “cost” of waiting for an uptrend signal was 7%. After that, the stock market outlook does a good job limiting losses, without sacrificing gains.
Before making any adjustment to the signals, we need to know if any losses were limited prior to the start of the year. Because of the steep correction just prior to the start of 2019, we’re not seeing the full picture. If I select a starting point based on the last “exit” signal, the timeframe extends to October 2018, and we can see if losses were lessened.
The performance looks much better, right? If we include the last correction, the stock market outlook avoided the December drawdown, which limited losses by almost 6%.
Talking heads are quick to point out the market returned 30% last year, as if they somehow became perfect market timers or that’s what they were able to capture.
If someone absolutely nailed it and bought in on December 26th (the low for the correction), then they’d be touting a gain of 35%! What’s a few trading days between friends? But extend the time frame from 12 months to 15 months? That market return is cut in half!
Lesson learned? It’s easy to question your methods and fear you’re missing out. Don’t get too high or too low just because your process or system or method does or doesn’t “look” good during your review. Dig deeper, figure out the cause and effect, and then decide whether you need to make changes.
Adjustments
The first adjustment is a good one: removing the cost of commissions from my calculations. Last year, many brokers did away with commissions for equity trades. There are still trading fees, but they’re very relatively minor (i.e. less than $0.50 per trade).Sadly, Tony Caldaro passed away last year. His site, (Objective Elliott Wave), remains online but doesn’t provide updates with the same frequency as it did in the past. While still highly valuable, the reduced commentary makes calculating daily signals a bit more challenging. There were a few times last year where I posted without an OEW update, choosing instead to carry over the prior week’s signal. When OEW did eventually update, the new information changed the stock market outlook. I accounted for those changes in this review, but a lack of updates from the OEW blog is a risk going forward.
Looking Forward
Unlike last year, tariffs and trade talks are on the back-burner to start 2020, now that the Phase 1 deal between the US and China is signed, the new NAFTA is ready to go, and Brexit is confirmed. Implementation is still an issue, and many details are lacking, so any of these topics could positively or negatively impact the market at some point this year.The U.S. also experienced a yield-curve inversion last year. On average, recessions start 14 months after that event, putting the economy on notice for October this year...one month prior to the presidential election in November.
But the biggest risk for the S&P500 may come from outside the U.S. The world is grappling with a coronavirus that’s starting to spread from Wuhan China. You can't lockdown over 40 million people and ban travel during the largest travel season (Chinese New Year), and not expect some impact. The size of that impact will depend on progression and containment.
Global transportation and food service companies have already been impacted by closures (think airlines, Starbucks, McDonalds, etc.), so I expect some Q1 earnings to disappoint. Longer term (Q2-Q4), medical and health care companies could see earnings increase as the situation is contained and outcomes improve (and they will improve).
Stay safe and best to your year!
Joel
If you find this research helpful, please tell a friend. If not, tell an enemy. I share articles and other news of interest via Twitter; you can follow me @investsafely. The weekly market outlook is also posted on Facebook and Linkedin. All stock charts courtesy of Stockcharts.com.
--- APPENDIX ---
Remember: All models are wrong, but some are useful. The objective here is to give readers of my blog an example of systematically using an investing process, covering translating signals, executing trades, reviewing performance and adjusting methodologies. Providing this analysis (which mimics what I do for all my personal trading) gives you an example of the safe investing processes in action.
A Note on Investment Processes: From an investing technique perspective, I’ve used trend following for many years. I find that rules-based indicators, along with regular reviews, helps me improve performance over time. As far as timing, my goal is to enter and exit positions in line with market trends, and you can see that bias reflected throughout the Weekend Market Outlook.
Data
For analysis of the stock market outlook, I used historical data from Yahoo Finance.
Historical Summary
I posted the first annual review in 2016, examining the 2015 outlook, the opportunities & challenges that come with translating signals into trades, as well as refinements to improve performance. The market outlook model was a success. The signals and subsequent trades protected capital from losses and even generated some profit; buy and hold returns from the general markets were flat or even negative.In 2016, the trades continued to limit losses, but price movements between the time of signal generation and placing a trade influenced results significantly. As part of that year’s review, I changed the way I selected a price to represent a more realistic trade, and performance improved substantially.
In 2017, the trading model underperformed the market. Shallow sell-offs and the signal/trade delay were the main causes. I covered potential issues with the signals themselves (two were based on moving averages, making one redundant). But the cumulative performance since 2015 was still pretty good, so no changes were made.
2018 was the year I thought things would be great, and they were anything but! I erroneously used my blogging schedule as a trading schedule. I don’t model trades during the week or when a signal is actually generated. if I want to trade weekly prices, I would need to use weekly indicators (verses a summary of daily indicators on a weekly basis).
2019 Stock Market Outlook Signals
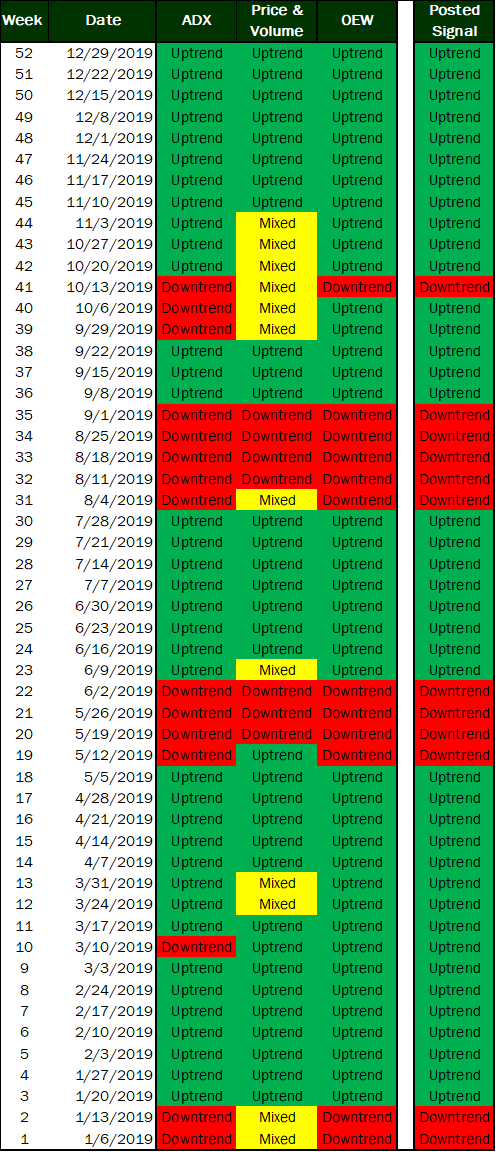
Methodology
The weekend stock market outlook continues to be based on the overall methodology from 2016; using 3 techniques to assess the state of the S&P 500. Each weekend, I determine whether the outlook (uptrend or downtrend) has changed, based on signals from those 3 methods. By cross-referencing three different methods and only changing the overall trend for the stock market outlook when they all align, I continue to attempt to reduce the number of false signals.For reference, the signals are:
- ADX (14 day) (Bullish/Bearish price trend)
- 50-day moving average + trading volumes (institutional investor behavior)
- Objective Elliott Wave Theory (overall market behavior / psychology)
Trading Criteria – Investment Type
I base the signals and the trading model on the S&P500 benchmark index. The reason is twofold: 1) The index is often used as a proxy for the general U.S. stock market 2) You can’t buy itYou might be asking yourself why I model something you can’t buy. The answer is simple. I am not a registered investment advisor. Therefore, I cannot give you, my readers, any investment advice and/or recommendations to buy/sell a security. Since you can’t buy the index, the blog posts, signals, and trades can’t be considered recommendations to buy or sell a security.
I can provide you with educational materials and/or entertainment. Since we can’t directly buy shares of an index, I also show you an example of the signals if they were applied to the next best thing: funds. I use 3 S&P funds (SPY, VOO, and VFINX) to show you the variation that can occur between investing instruments…even ones that are supposedly the same.
Trading Criteria - Buy and Sell Prices
The forward looking outlook is posted on Sunday, based on stock market price action from the prior week. Since the outlook reviews signals at the end of the week, the assumption for 2019 is that trades will be entered at the opening price the day after a signal is generated. In previous performance assessments, the “price” used for calculating performance is the market open price the week following a signal change.Trading Criteria - Position Sizing
For this study, I used a position size of 100 shares to keep the math simple. If I were buying shares of an index ETF, my position size would be calculated based on the size of my total portfolio and my risk tolerance (how much I’m willing to lose before selling the position).Trading Criteria - Buy and Sell Signals
Shares are purchased if the market outlook changes to an uptrend. If the outlook is mixed, watch and wait. If the outlook changes to a downtrend, the entire position is sold.Issues & Objections - Trade Prices
If a signal is generated, simulated trades are entered based on the market's opening price on the following trading day.Are you always going to get the opening price? No. As an example, one astute observer pointed out that I’m using opening price across the board, yet it’s not possible to purchase mutual funds at their opening price.
Will the opening price always be the best price? No. Price slippage between your signal generation and trade execution is one of the reasons that individual results can and WILL vary…as shown in the 2018 performance review.
Issues & Objections - Trends & Timing
Are you always going to buy an uptrend, sit on your hands when the market is "mixed", or sell exactly when a downtrend takes hold? No. General trends are great for giving you a sense of the overall investing environment. But each position needs to be evaluated on its own merits.For instance, there were several times in 2018 when the stock market outlook had been in an uptrend for a few weeks before any of my individual stock trades were executed.
IMPORTANT DISCLOSURE INFORMATION This material is for general communication and is provided for informational and/or educational purposes only. None of the content should be viewed as a suggestion that you take or refrain from taking any action nor as a recommendation for any specific investment product, strategy, or other such purpose.
To the extent that a reader has any questions regarding the applicability of any specific issue discussed above to his/her individual situation, he/she is encouraged to consult with the professional advisors of his/her choosing. Invest Safely, LLC is not a law firm, certified public accounting firm, or registered investment advisor and no portion of its content should be construed as legal, accounting, or investment advice.
The material is not to be construed as an offer or a recommendation to buy or sell a security nor is it to be construed as investment advice. Additionally, the material accessible through this website does not constitute a representation that the investments described herein are suitable or appropriate for any person.
Hypothetical Presentations: Any referenced performance is “as calculated” using the referenced funds and has not been independently verified. This presentation does not discuss, directly or indirectly, the amount of the profits or losses, realized or unrealized, by any reader or contributor, from any specific funds or securities.
The author and/or any reader may have experienced materially different performance based upon various factors during the corresponding time periods. To the extent that any portion of the content reflects hypothetical results that were achieved by means of the retroactive application of a back-tested model, such results have inherent limitations, including:
- Model results do not reflect the results of actual trading using assets, but were achieved by means of the retroactive application of the referenced models, certain aspects of which may have been designed with the benefit of hindsight
- Back-tested performance may not reflect the impact that any material market or economic factors might have had on the use of a trading model if the model had been used during the period to actually manage assets
- Actual investment results during the corresponding time periods may have been materially different from those portrayed in the model
The S&P 500 Composite Total Return Index (the "S&P") is a market capitalization-weighted index of 500 widely held stocks often used as a proxy for the stock market. Standard & Poor's chooses the member companies for the S&P based on market size, liquidity, and industry group representation. Included are the common stocks of industrial, financial, utility, and transportation companies. The S&P is not an index into which an investor can directly invest. The historical S&P performance results (and those of all other indices) are provided exclusively for comparison purposes only, so as to provide general comparative information to assist an individual in determining whether the performance of a specific portfolio or model meets, or continues to meet investment objective(s). The model and indices performance results do not reflect the impact of taxes.
Certain information contained herein has been obtained from third-party sources believed to be reliable, but we cannot guarantee its accuracy or completeness.
Investing involves risk (even the “safe” kind)! Past performance does not guarantee or indicate future results. Different types of investments involve varying degrees of underlying risk. Therefore, do not assume that future performance of any specific investment or investment strategy be suitable for your portfolio or individual situation, will be profitable, equal any historical performance level(s), or prove successful (including the investments and/or investment strategies describe on this site).
Popular Pages
- Jim Cramer- Personal Incomes Statements
- Hyperinflation
- Calculating Beta
- SMART Financial Goals
Blogroll
- Advisor Perspectives- Dividend Growth Investor
- Elliott Wave Lives On
- On My Radar | CMG Wealth
- Sure Dividend
- The Big Picture
- The Fat Pitch
- Thoughts from the Frontline
- Trader Feed
Sponsored Links
Invest Safely provides valuable, time-saving info about personal finance, money management, and investing.


