Stock Market Outlook
For The Week Of January 11th =
Uptrend
INDICATORS
-
ADX Directional Index: Bullish
Institutional Activity: Bullish
On Balance Volume: Bullish
ANALYSIS
The stock market outlook maintains an uptrend, despite geopolitical turmoil and news-driven vol
atility. The S&P500 ( $SPX ) rose 1.6% last week. The index sits ~2% above the 50-day moving average and ~10% above the 200-day moving average.
All three technical indicators are bullish to start the week. Price broke out of a recent trading range and the index dropped a few distribution days from the overall count.
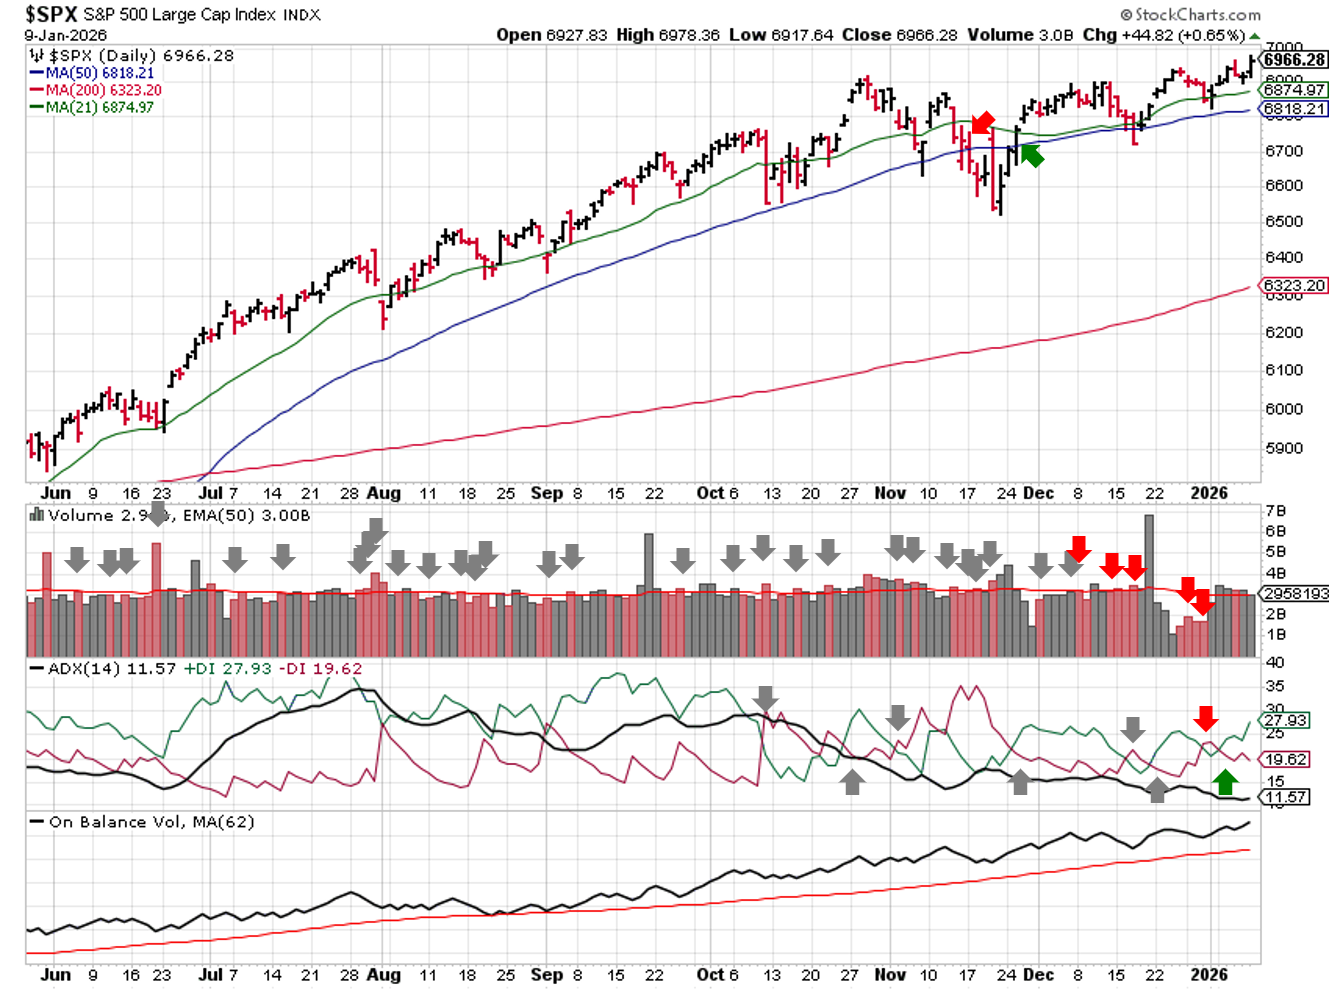
SPX Technical Analysis - January 11 2026
PERFORMANCE COMPARISONS
Consumer Discretionary ( $XLY ) outperformed by a wide margin, thought Industrials ( $XLI ) was a close second. Utilities ( $XLU ) underperformed; the only sector in the red. Consumer Discretionary and Consumer Staples ( $XLP ) improved to bullish bias.
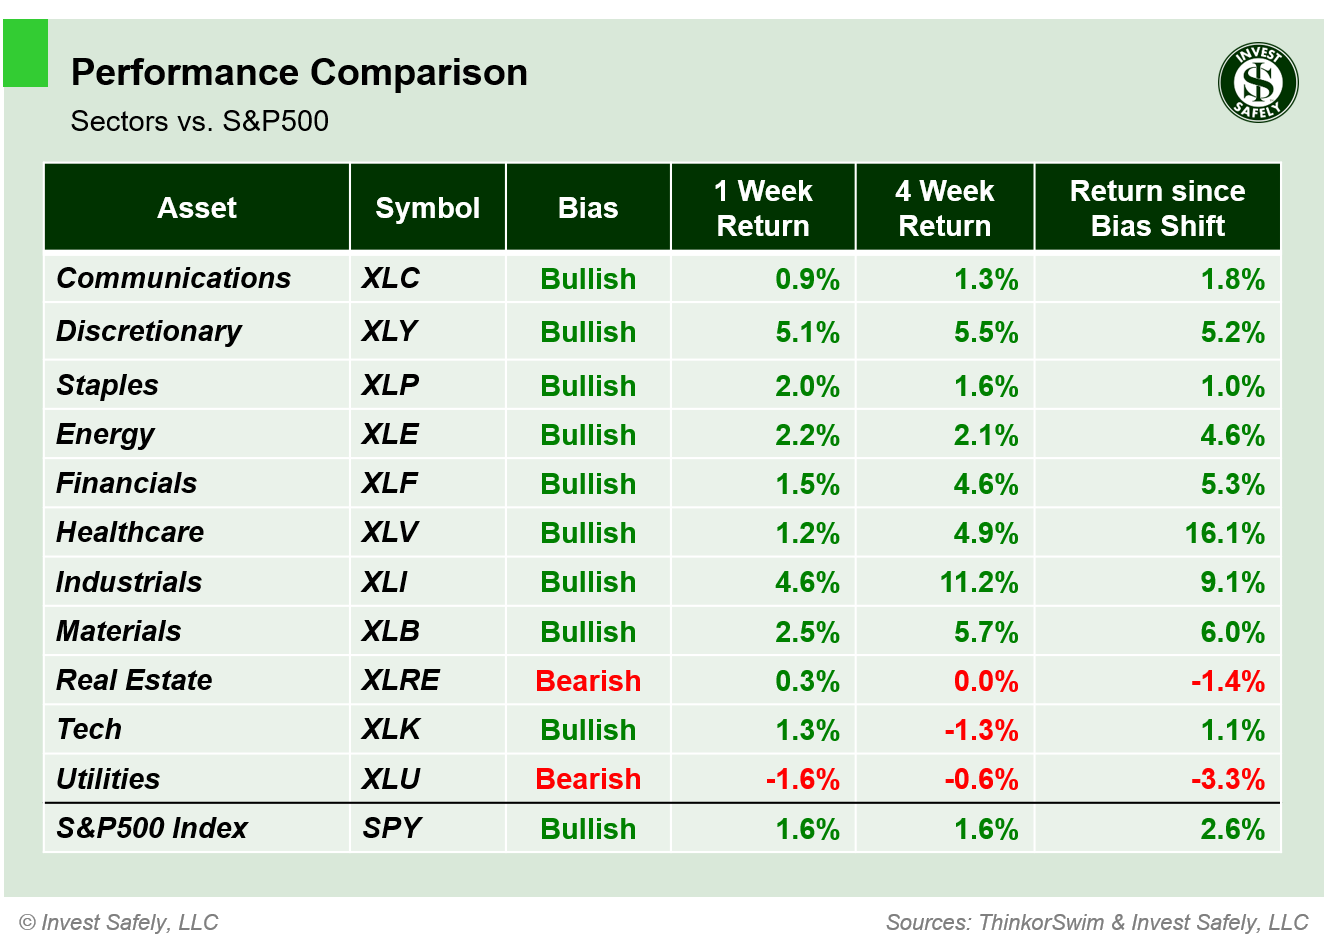
S&P500 Sector Performance - January 11 2026
All sector styles made headway last week, but it was Small Cap Value ( $IWN ) leading the charge. Interestingly, the "Value" category ( $IWN, $IJJ, $IWX ) has improved more than all other styles over the past 4 weeks, on a relative basis. High Dividend ( $SPHD ) underperformed. Low Beta ( $SPLV ) moved back to neutral; High Dividend and Defensives ( $POWA ) improved to bullish.
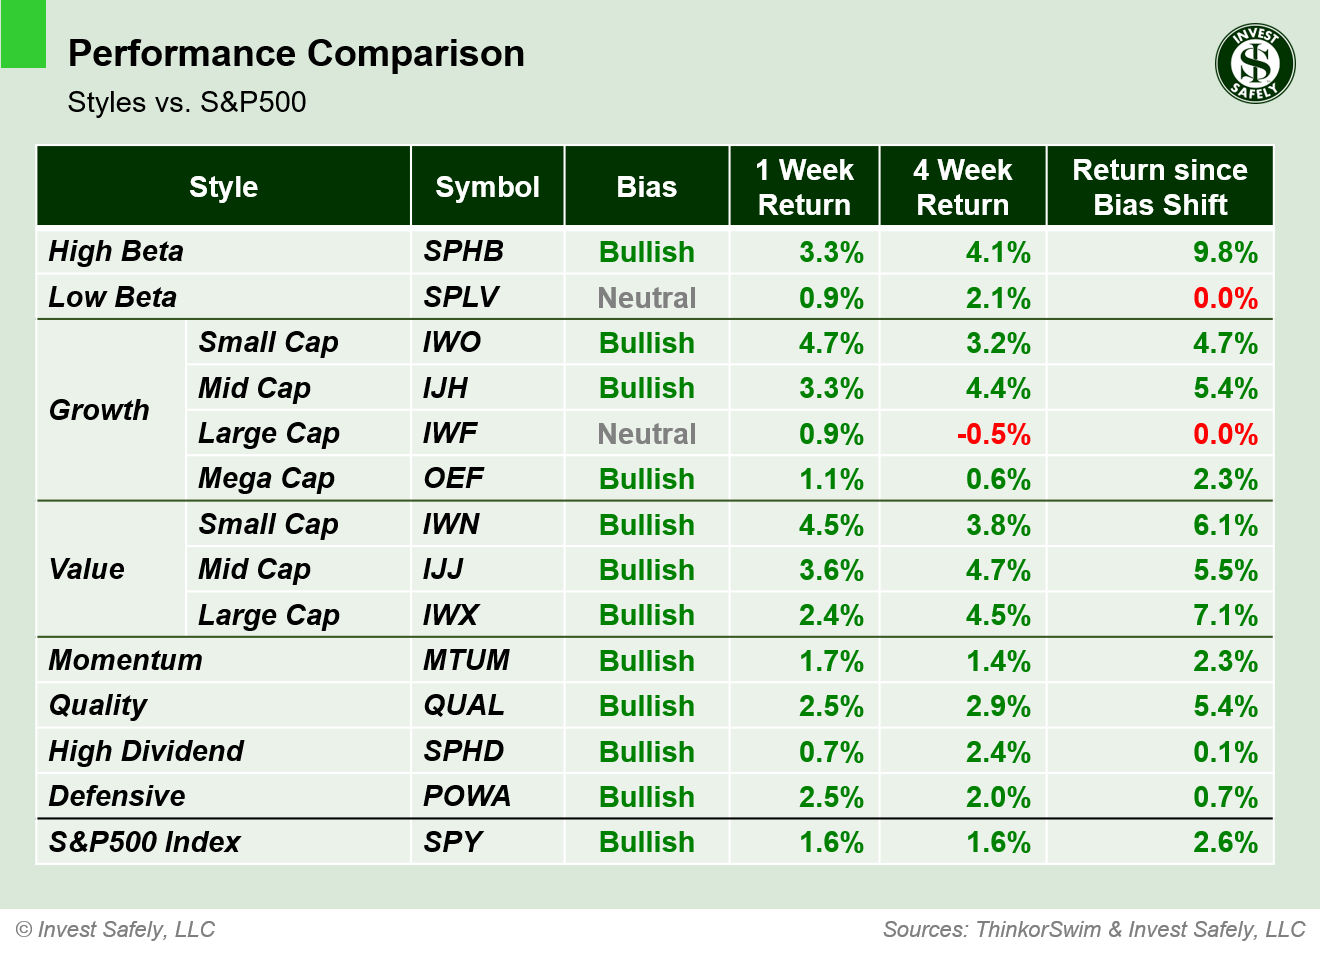
S&P500 Sector Style Performance - January 11 2026
Gold ( $GLD ) returned to the win column last week, leading assets higher. Bonds ( $IEF ) lagged. Oil ( $USO ) moved back to bullish bias after almost 4 months in bearish territory. Time will tell if it's a retest or a breakout. Bonds and U.S. dollar ( $DXY ) improved to neutral bias as well.

Asset Class Performance - January 11 2026
COMMENTARY
In addition to geopolitical headlines, policy by social media ramped up again last week, with the U.S. defense sector in the crosshairs. President Trump called out contractors and executives for their high dividends, stock buyback programs, and compensation packages, which sent most of the sector lower midweek. A few hours later, he requested for a $1.5 trillion dollar defense budget for 2027 ( +66% vs. 2026 ), boosting stocks back to where they were.
After market hours on Friday, he declared a one-year ceiling of 10% on credit card interest rates. Expect more news-drive volatility throughout the year, as political parties pander position ahead of mid-term elections.
December ISM Manufacturing PMI was 47.9 in December 2025, falling from November and below forecasts. It's the 3rd month of declines, and the lowest level since October 2024. Services PMI was 54.4, up from November and above forecasts.
Job openings ( JOLTS ) fell month over month, falling short of expectations and hitting the lowest level since September 2024. December Non-farm Payrolls fell in December, coming in below a downwardly revised November figure, forecasts, and far off last December's 323k number. The downward revisions hint that employment is weaker than initial reporting suggests, which will influence the FOMC's next interest rate decision.

Source: https://x.com/KobeissiLetter/status/2010079561581498856
This week's data releases include December CPI and PPI figures, as well as the start of earnings season.

Source: https://x.com/eWhispers/status/2009633514765877736
Best to Your Week!
P.S. If you find this research helpful, please tell a friend.
If you don't, tell an enemy.
Sources: Bloomberg, CNBC, Federal Reserve Bank of St. Louis, Hedgeye, U.S. Bureau of Economic Analysis, U.S. Bureau of Labor Statistics, TradingEconomics.com
Looking for more information on the Stock Market Outlook Signals?
You'll find it here:
Share this on social media:
Find articles and other news of interest from Invest-Safely:
Twitter (@investsafely)
Facebook (@InvestSafely)
LinkedIn (@Invest-Safely)
Instagram (@investsafely)
 If you're interested in learning more about the relationship between price and volume, or how to find and trade the best stocks for your growth strategy, check out this book via the following Amazon affiliate link:
How to Make Money in Stocks: A Winning System in Good Times and Bad.
It's one of my favorites.
Invest Safely, LLC is an independent investment research and online financial media company. Use of Invest Safely, LLC and any other products available through invest-safely.com is subject to our Terms of Service and Privacy Policy. Not a recommendation to buy or sell any security.
Charts provided courtesy of stockcharts.com.
For historical Elliott Wave commentary and analysis, go to ELLIOTT WAVE lives on by Tony Caldaro. Current counts can be found at: Pretzel Logic, and 12345ABCDEWXYZ
Once a year, I review the market outlook signals as if they were a mechanical trading system, while pointing out issues and making adjustments. The goal is to give you to give you an example of how to analyze and continuously improve your own systems.
- 2015 Performance - Stock Market Outlook
- 2016 Performance - Stock Market Outlook
- 2017 Performance - Stock Market Outlook
- 2018 Performance - Stock Market Outlook
- 2019 Performance - Stock Market Outlook
- 2020 Performance - Stock Market Outlook
IMPORTANT DISCLOSURE INFORMATION
This material is for general communication and is provided for informational and/or educational purposes only. None of the content should be viewed as a suggestion that you take or refrain from taking any action nor as a recommendation for any specific investment product, strategy, or other such purpose. Certain information contained herein has been obtained from third-party sources believed to be reliable, but we cannot guarantee its accuracy or completeness.
To the extent that a reader has any questions regarding the applicability of any specific issue discussed above to his/her individual situation, he/she is encouraged to consult with the professional advisors of his/her choosing. Invest Safely, LLC is not a law firm, certified public accounting firm, or registered investment advisor and no portion of its content should be construed as legal, accounting, or investment advice.
The material is not to be construed as an offer or a recommendation to buy or sell a security nor is it to be construed as investment advice. Additionally, the material accessible through this website does not constitute a representation that the investments described herein are suitable or appropriate for any person.
Hypothetical Presentations:
Any referenced performance is “as calculated” using the referenced funds and has not been independently verified. This presentation does not discuss, directly or indirectly, the amount of the profits or losses, realized or unrealized, by any reader or contributor, from any specific funds or securities.
The author and/or any reader may have experienced materially different performance based upon various factors during the corresponding time periods. To the extent that any portion of the content reflects hypothetical results that were achieved by means of the retroactive application of a back-tested model, such results have inherent limitations, including:
Model results do not reflect the results of actual trading using assets, but were achieved by means of the retroactive application of the referenced models, certain aspects of which may have been designed with the benefit of hindsight
Back-tested performance may not reflect the impact that any material market or economic factors might have had on the use of a trading model if the model had been used during the period to actually manage assets
Actual investment results during the corresponding time periods may have been materially different from those portrayed in the model
Past performance may not be indicative of future results. Therefore, no one should assume that future performance will be profitable, or equal to any corresponding historical index.
The S&P 500 Composite Total Return Index (the "S&P") is a market capitalization-weighted index of 500 widely held stocks often used as a proxy for the stock market. Standard & Poor's chooses the member companies for the S&P based on market size, liquidity, and industry group representation. Included are the common stocks of industrial, financial, utility, and transportation companies. The S&P is not an index into which an investor can directly invest. The historical S&P performance results (and those of all other indices) are provided exclusively for comparison purposes only, so as to provide general comparative information to assist an individual in determining whether the performance of a specific portfolio or model meets, or continues to meet investment objective(s). The model and indices performance results do not reflect the impact of taxes.
Investing involves risk (even the “safe” kind)! Past performance does not guarantee or indicate future results. Different types of investments involve varying degrees of underlying risk. Therefore, do not assume that future performance of any specific investment or investment strategy be suitable for your portfolio or individual situation, will be profitable, equal any historical performance level(s), or prove successful (including the investments and/or investment strategies describe on this site).
Investing Process Links
Stabilize- Organize your $$$
- Manage your $$$
Plan
- Why You Invest
- Ways to Invest
- Where to Invest
- What to Invest In
Execute
- When to Invest
- How Much to Invest
- Buying & Selling
Monitor
- Track The Market
- Track Your Returns
Reflect & Adjust
- Improve Your Returns
- Adjust your Holdings
Popular Pages
- Jim Cramer- Personal Incomes Statements
- Hyperinflation
- Calculating Beta
- SMART Financial Goals
Blogroll
- Advisor Perspectives- Dividend Growth Investor
- Elliott Wave Lives On
- On My Radar | CMG Wealth
- Sure Dividend
- The Big Picture
- The Fat Pitch
- Thoughts from the Frontline
- Trader Feed
Sponsored Links
Invest Safely provides valuable, time-saving info about personal finance, money management, and investing.


