Stock Market Outlook
For The Week Of January 4th =
Uptrend
INDICATORS
-
ADX Directional Index: Bearish
Institutional Activity: Mixed
On Balance Volume: Bullish
ANALYSIS
Happy New Year! The stock market outlook kicks off 2026 in an uptrend, with asterisks.
The S&P500 ( $SPX ) fell 1% last week. The index sits 1% above the 50-day moving average and ~10% above the 200-day moving average.
The ADX directional indicators had moved into bullish territory over the holidays, but fell back to bearish Friday; the main average shows a market without trend, corresponding to the index moving sideways since the end of October. The SPX is still above the 50-day moving average, though distribution days are high. The two days of elevated selling during the holidays came on below average trading volumes, so not the strongest signal, but a bearish one nonetheless. So the market outlook remains in an uptrend, while we wait for a breakdown or breakout from the recent trading range.
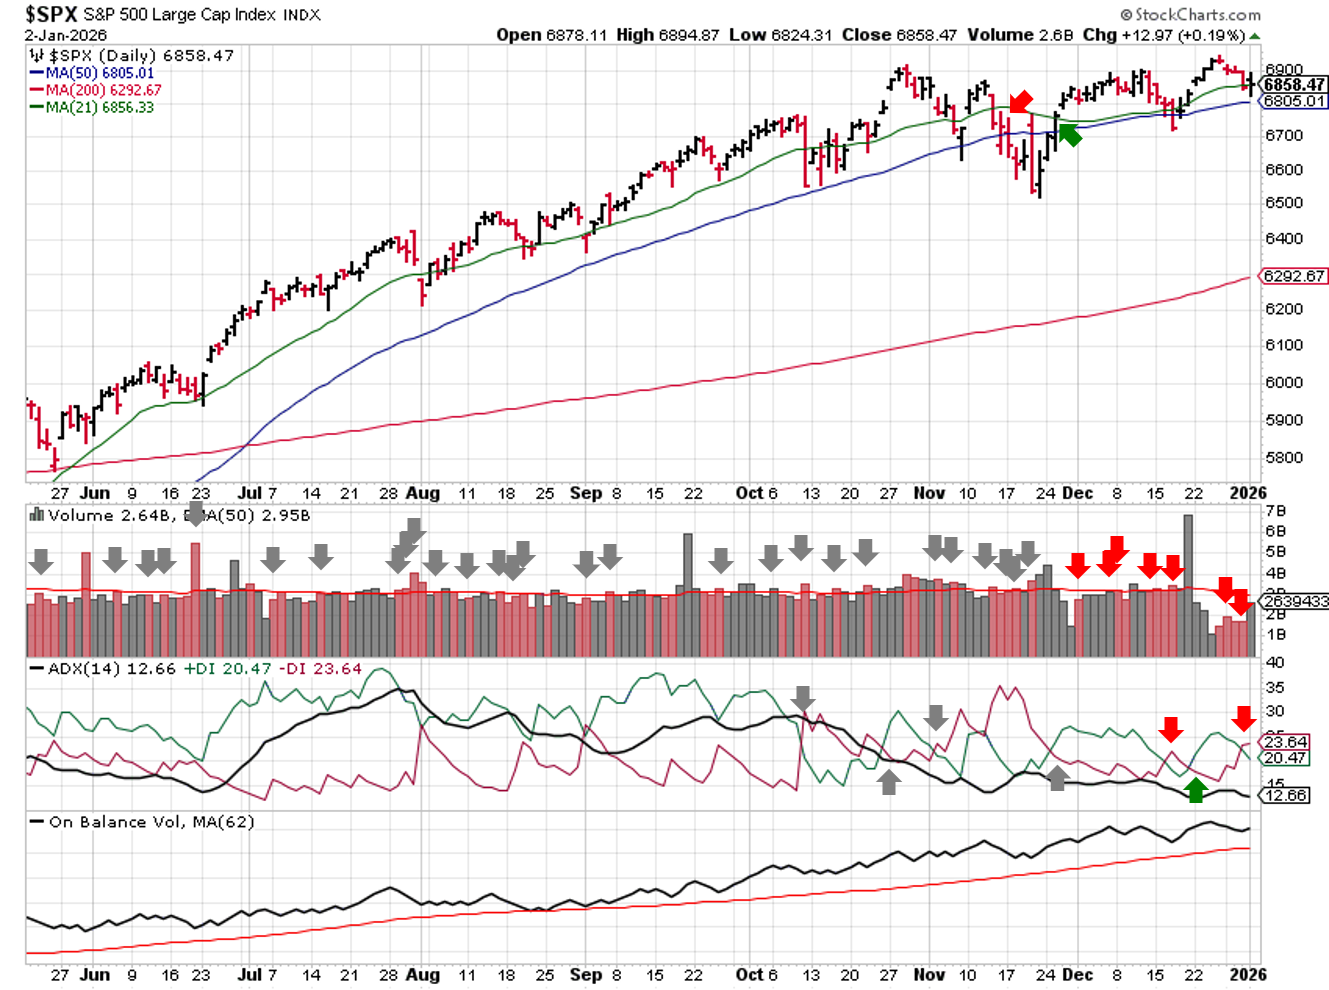
SPX Technical Analysis - January 04 2026
PERFORMANCE COMPARISONS
We'll kick off performance comparisons with a look at annual returns for the stock market outlook. During 2025, the $SPX netted a 942 point gain, from the January 2nd open to the December 31st close, for a gain of 16%. During the same time period, the stock market outlook signals triggered six times, creating a net increase of ~1216 points, for a gain of 20.6%.
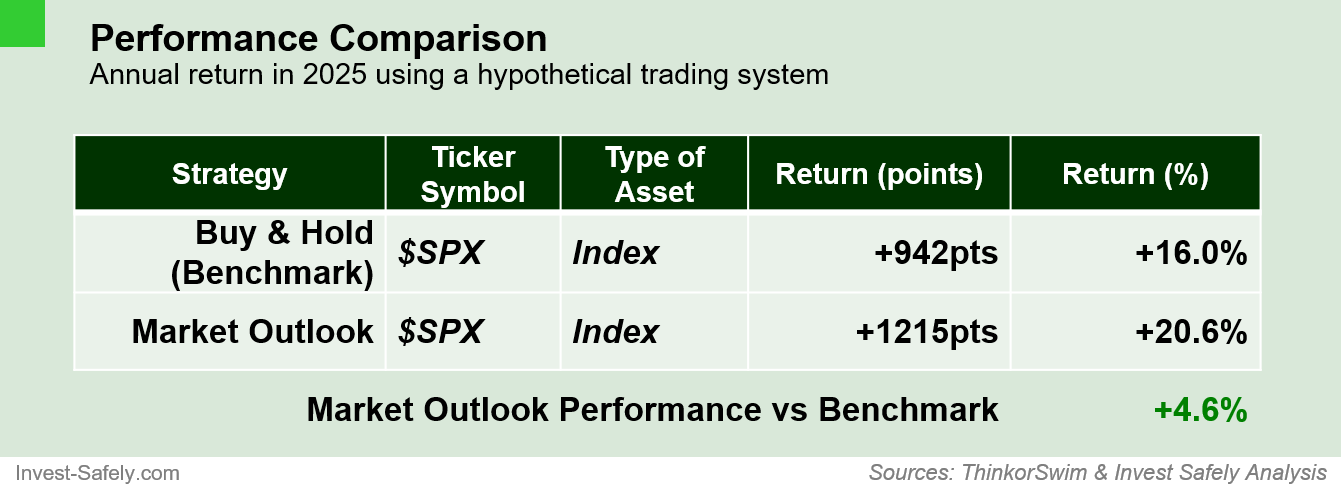
Market Outlook Performance - January 04 2026
The stock market outlook continues to function as intended: lowering risk of loss. Using the 3-signal combination improved returns by 4.6% versus buying and holding the index. Said another way, these signals reduced losses from the first quarter drawdown by ~5%. Returning to the near term, Energy ( $XLE ) outperformed last week and Consumer Discretionary ( $XLY ) underperformed. Energy and Technology ( $XLK ) slipped back to neutral bias.
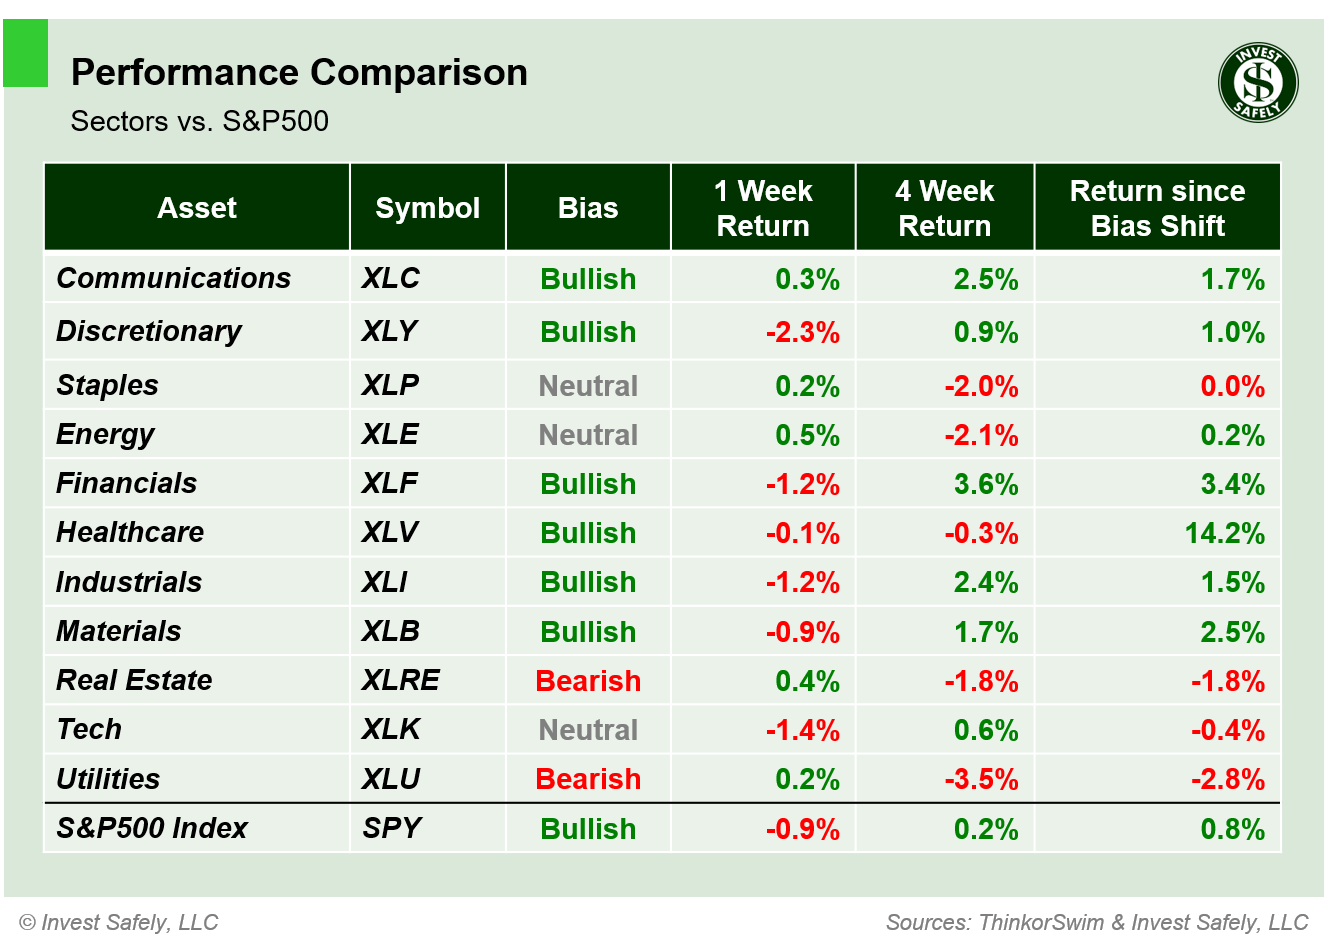
S&P500 Sector Performance - January 04 2026
High Dividend ( $SPHD ) stocks were the only style to close with a gain; the rest were led lower by Small Cap Growth ( $IWO ). Small Cap Growth, along with Defensives ( $POWA ) , dropped to Bearish bias, while Large Cap Growth, Small Cap Value, and Momentum ( $IWF, $IWN, $MTUM ) slipped to neutral (all from bullish).
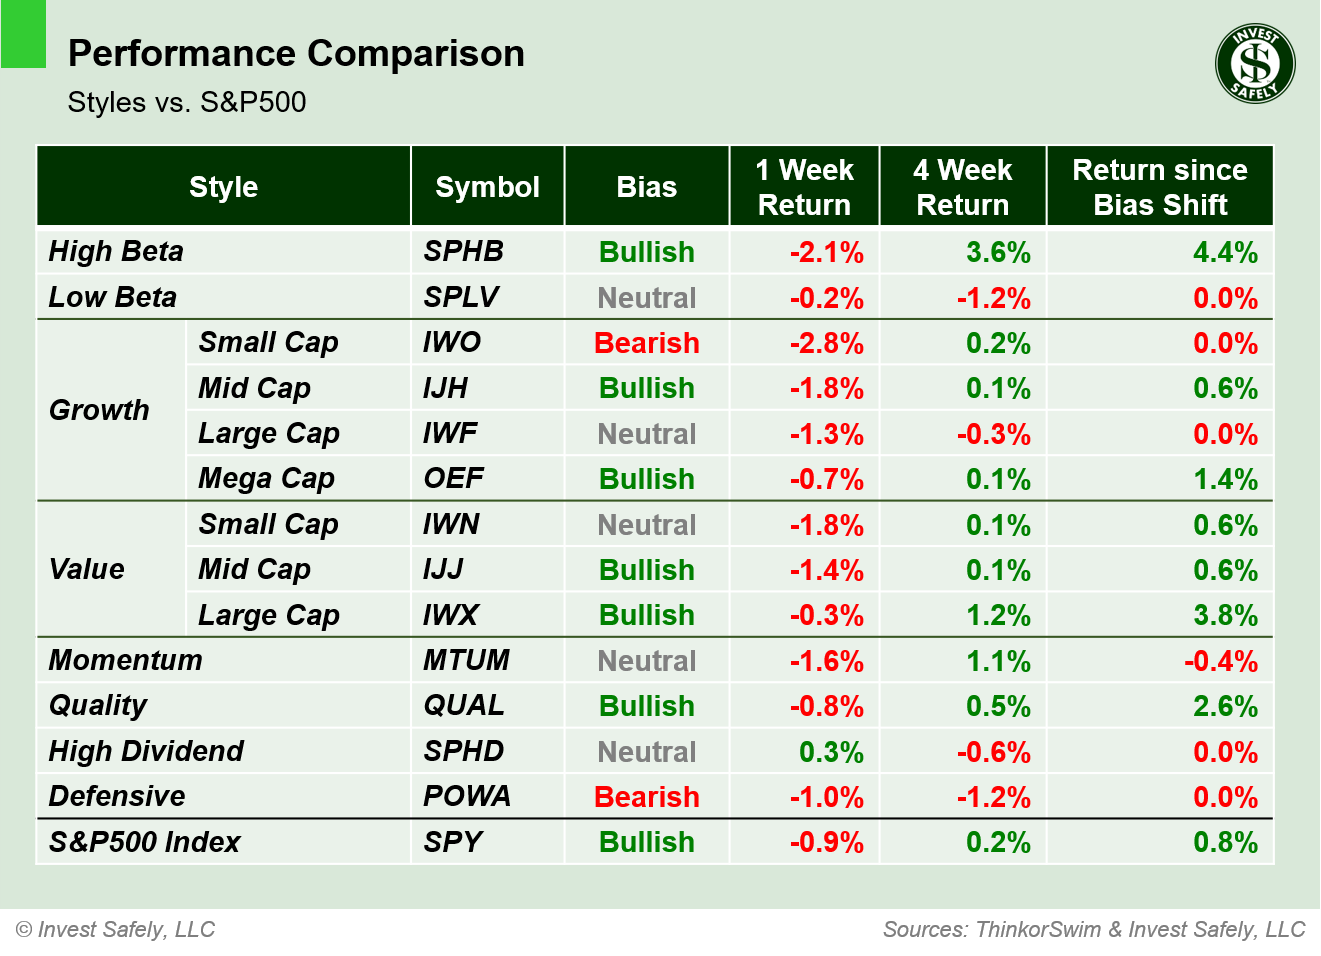
S&P500 Sector Style Performance - January 04 2026
US Bonds ( $IEF ) were the "best" asset class with a return of 0.1%. That said, they also shifted from neutral to bearish bias. Gold ( $GLD ) leading to the downside.
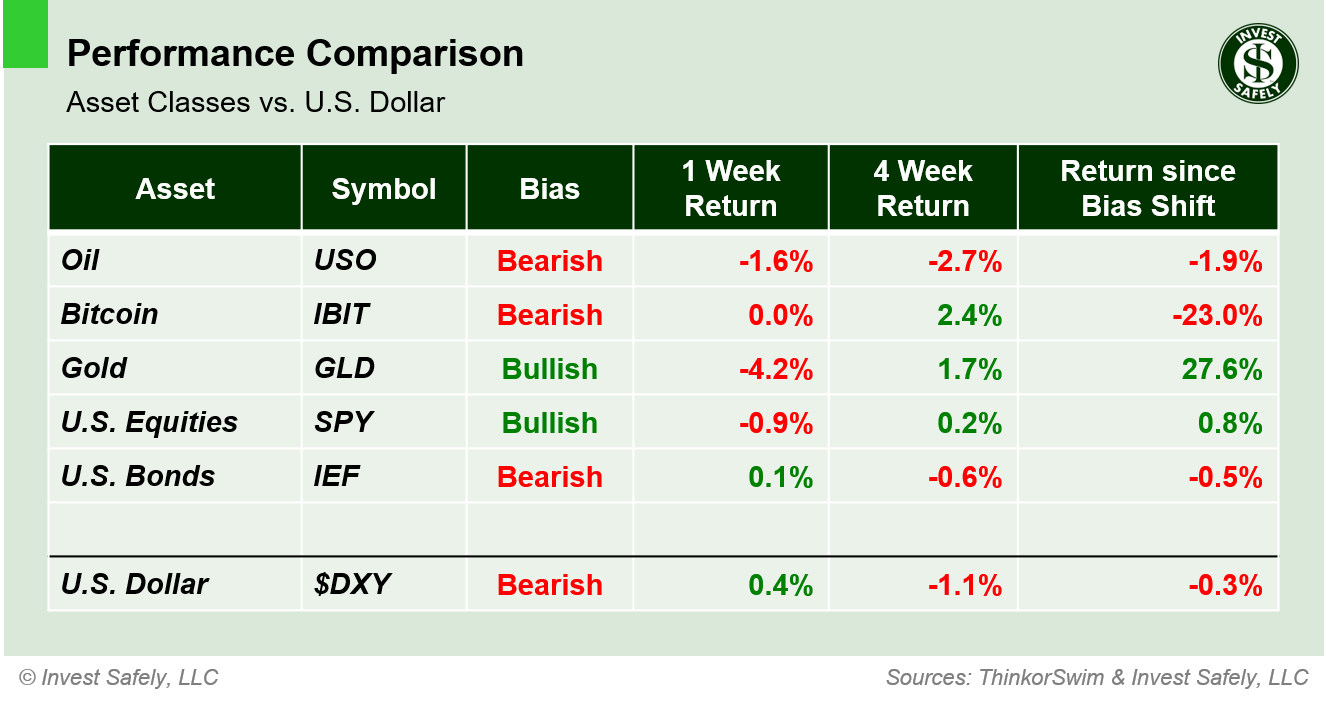
Asset Class Performance - January 04 2026
COMMENTARY
As we head into January, the overall price and volume action shows the market consolidating for much of the 4th quarter. There's almost no trend to speak of (per ADX), and institutional investors were shifting their holdings around: high volume selling on the indexes without major price declines. The rotation of flows also showed up in sector biases flipping back and forth for much of the 4th quarter.
On Saturday, investors woke up to news that the Venezuelan President Nicolás Maduro had been removed from office by U.S. forces. Our first peak at market reaction will be Sunday night futures, but it's safe to assume there will be some volatility when the U.S. markets open tomorrow.
Looking ahead, we'll get ISM, JOLTS, and NFP later this week. And earnings season kicks off the following week with large banks reporting.
Best to Your Week!
P.S. If you find this research helpful, please tell a friend.
If you don't, tell an enemy.
Sources: Bloomberg, CNBC, Federal Reserve Bank of St. Louis, Hedgeye, U.S. Bureau of Economic Analysis, U.S. Bureau of Labor Statistics, TradingEconomics.com
Looking for more information on the Stock Market Outlook Signals?
You'll find it here:
Share this on social media:
Find articles and other news of interest from Invest-Safely:
Twitter (@investsafely)
Facebook (@InvestSafely)
LinkedIn (@Invest-Safely)
Instagram (@investsafely)
 If you're interested in learning more about the relationship between price and volume, or how to find and trade the best stocks for your growth strategy, check out this book via the following Amazon affiliate link:
How to Make Money in Stocks: A Winning System in Good Times and Bad.
It's one of my favorites.
Invest Safely, LLC is an independent investment research and online financial media company. Use of Invest Safely, LLC and any other products available through invest-safely.com is subject to our Terms of Service and Privacy Policy. Not a recommendation to buy or sell any security.
Charts provided courtesy of stockcharts.com.
For historical Elliott Wave commentary and analysis, go to ELLIOTT WAVE lives on by Tony Caldaro. Current counts can be found at: Pretzel Logic, and 12345ABCDEWXYZ
Once a year, I review the market outlook signals as if they were a mechanical trading system, while pointing out issues and making adjustments. The goal is to give you to give you an example of how to analyze and continuously improve your own systems.
- 2015 Performance - Stock Market Outlook
- 2016 Performance - Stock Market Outlook
- 2017 Performance - Stock Market Outlook
- 2018 Performance - Stock Market Outlook
- 2019 Performance - Stock Market Outlook
- 2020 Performance - Stock Market Outlook
IMPORTANT DISCLOSURE INFORMATION
This material is for general communication and is provided for informational and/or educational purposes only. None of the content should be viewed as a suggestion that you take or refrain from taking any action nor as a recommendation for any specific investment product, strategy, or other such purpose. Certain information contained herein has been obtained from third-party sources believed to be reliable, but we cannot guarantee its accuracy or completeness.
To the extent that a reader has any questions regarding the applicability of any specific issue discussed above to his/her individual situation, he/she is encouraged to consult with the professional advisors of his/her choosing. Invest Safely, LLC is not a law firm, certified public accounting firm, or registered investment advisor and no portion of its content should be construed as legal, accounting, or investment advice.
The material is not to be construed as an offer or a recommendation to buy or sell a security nor is it to be construed as investment advice. Additionally, the material accessible through this website does not constitute a representation that the investments described herein are suitable or appropriate for any person.
Hypothetical Presentations:
Any referenced performance is “as calculated” using the referenced funds and has not been independently verified. This presentation does not discuss, directly or indirectly, the amount of the profits or losses, realized or unrealized, by any reader or contributor, from any specific funds or securities.
The author and/or any reader may have experienced materially different performance based upon various factors during the corresponding time periods. To the extent that any portion of the content reflects hypothetical results that were achieved by means of the retroactive application of a back-tested model, such results have inherent limitations, including:
Model results do not reflect the results of actual trading using assets, but were achieved by means of the retroactive application of the referenced models, certain aspects of which may have been designed with the benefit of hindsight
Back-tested performance may not reflect the impact that any material market or economic factors might have had on the use of a trading model if the model had been used during the period to actually manage assets
Actual investment results during the corresponding time periods may have been materially different from those portrayed in the model
Past performance may not be indicative of future results. Therefore, no one should assume that future performance will be profitable, or equal to any corresponding historical index.
The S&P 500 Composite Total Return Index (the "S&P") is a market capitalization-weighted index of 500 widely held stocks often used as a proxy for the stock market. Standard & Poor's chooses the member companies for the S&P based on market size, liquidity, and industry group representation. Included are the common stocks of industrial, financial, utility, and transportation companies. The S&P is not an index into which an investor can directly invest. The historical S&P performance results (and those of all other indices) are provided exclusively for comparison purposes only, so as to provide general comparative information to assist an individual in determining whether the performance of a specific portfolio or model meets, or continues to meet investment objective(s). The model and indices performance results do not reflect the impact of taxes.
Investing involves risk (even the “safe” kind)! Past performance does not guarantee or indicate future results. Different types of investments involve varying degrees of underlying risk. Therefore, do not assume that future performance of any specific investment or investment strategy be suitable for your portfolio or individual situation, will be profitable, equal any historical performance level(s), or prove successful (including the investments and/or investment strategies describe on this site).
Investing Process Links
Stabilize- Organize your $$$
- Manage your $$$
Plan
- Why You Invest
- Ways to Invest
- Where to Invest
- What to Invest In
Execute
- When to Invest
- How Much to Invest
- Buying & Selling
Monitor
- Track The Market
- Track Your Returns
Reflect & Adjust
- Improve Your Returns
- Adjust your Holdings
Popular Pages
- Jim Cramer- Personal Incomes Statements
- Hyperinflation
- Calculating Beta
- SMART Financial Goals
Blogroll
- Advisor Perspectives- Dividend Growth Investor
- Elliott Wave Lives On
- On My Radar | CMG Wealth
- Sure Dividend
- The Big Picture
- The Fat Pitch
- Thoughts from the Frontline
- Trader Feed
Sponsored Links
Invest Safely provides valuable, time-saving info about personal finance, money management, and investing.


