Stock Market Outlook
For The Week Of November 23rd=
Downtrend
INDICATORS
-
ADX Directional Index: Bearish
Institutional Activity: Bearish
On Balance Volume: Bullish
ANALYSIS
The stock market outlook shifted to a downtrend last Monday, putting equities into a correction after a gain of more than 20% from the April lows.
The S&P500 ( $SPX ) fell 1.9% last week. The index sits ~2% below the 50-day moving average and ~7% above the 200-day moving average.
The ADX is bearish. Institutional selling ramped up, adding 3 distribution days to the count. But it was Monday's high volume move through the 50-day moving average that shifted the indicator to bearish and the outlook to a downtrend.

SPX Technical Analysis - November 23 2025
PERFORMANCE COMPARISONS
Healthcare ( $XLV ) led sectors higher for the third straight week; the only sector showing any real resilience. Energy ( $XLE ) is the other bullish sector, but it's still finding its footing. Technology ( $XLK ) underperformed significantly and dropped to bearish bias. Utilities ( $XLU ) eased back to neutral.
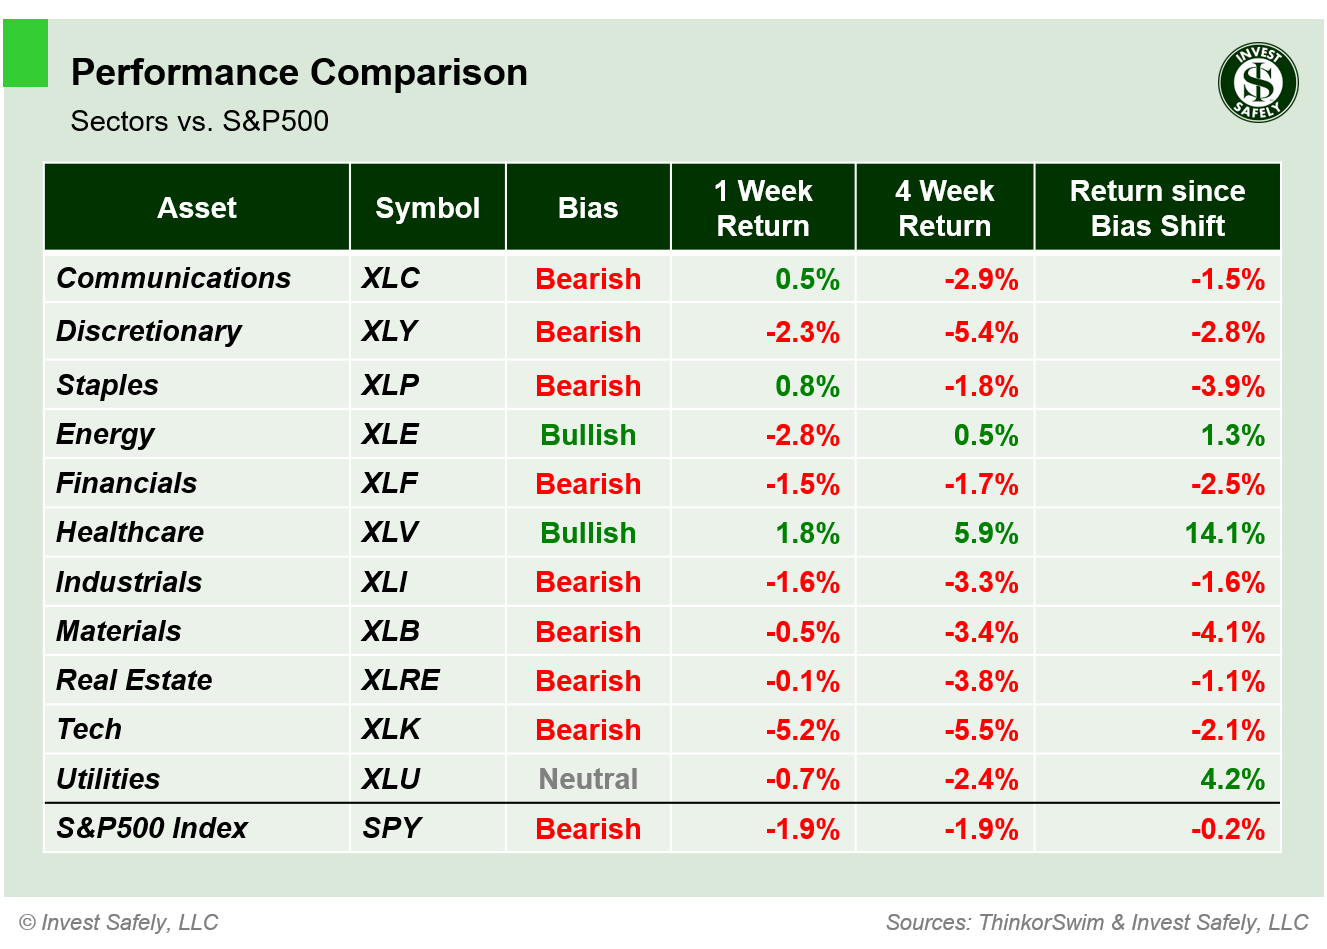
S&P500 Sector Performance - November 23 2025
Low Beta ( $SPLV ) outperformed other sector styles, but still lost steam during the week and moved to neutral bias. Momentum ( $MTUM ) led to the downside. High Beta, Large and Mega Cap Growth ( $SPHB, $IWF, $OEF ) moved to bearish bias; Large Cap Value and Quality ( $IWX, $QUAL ) moved to neutral.

S&P500 Sector Style Performance - November 23 2025
Bonds ( $IEF ) outperformed last week, but all assets have been weaker versus the dollar. The crypto space continues to experience deleveraging, so no surprise that Bitcoin ( $IBIT ) was the laggard again.
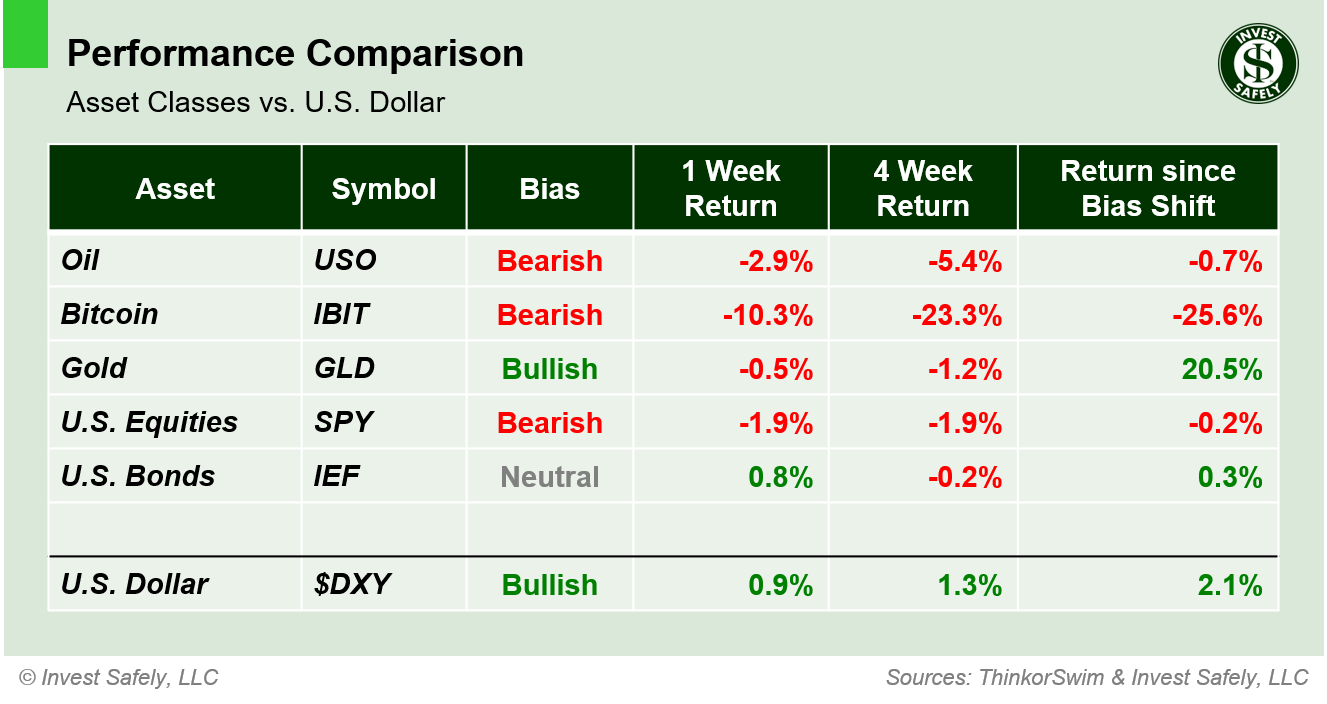
Asset Class Performance - November 23 2025
COMMENTARY
Institutions were definitely reducing their exposures last week, especially on Thursday. Market participants dumped risk-on plays, such as the Technology sector, High Beta/Momentum sector styles, and cryptocurrency assets. Excluding crypto, those categories are still within 10% of their all time highs, so they're not priced at a discount just yet ( $SPHB was up ~80% from the April low ).
Last week's release of FOMC minutes showed that members are divided on how to proceed on interest rates: lower them to help the job market or keep them steady to fight inflation. Equity market participants were pricing in a December rate cut. A less than certain reduced that probability, which may have influenced capital flows last week.
Although they're fewer and farther between these days, corrections are normal and actually a welcome aspect of investing. When they occur, investors get a chance to find assets that are "truly" oversold, or at the very least no longer overbought.
Corrections aren't typically "one and done", meaning there's usually a retest and then another move lower. We saw this play out earlier in the year, when stocks sold off in February, consolidated in March, then bottomed in April. Perhaps we correct in November, get that Santa Claus rally in December, and bottom in January closer to the 200-day moving average.
Regardless of the narrative, risk-on assets are bearish across a wide range of categories right now. While there are pockets of strength for short-term plays ( e.g. Healthcare ), you'll want to broader participation before making moves. Or at least see the Mag 7 turn around, since they're so heavily weighted within indexes.
Over the coming sessions, dust off those watchlists, pick companies with high quality fundamentals with high quality chart patterns, and then look for signs that institutions are back on the buy side: accumulation days ( large daily moves higher on increasing volume ) and price regaining/remaining above key moving averages ( 21 day and 50 day ).
Next week starts the holiday trading season, with Thursday market closures for thanksgiving in the US. PPI and retail sales on Tuesday, Durable Goods on Wednesday. The Bureau of Economic Analysis (BEA) initially scheduled PCE for Wednesday, but the release has been delayed.
Best to Your Week!
P.S. If you find this research helpful, please tell a friend.
If you don't, tell an enemy.
Sources: Bloomberg, CNBC, Federal Reserve Bank of St. Louis, Hedgeye, U.S. Bureau of Economic Analysis, U.S. Bureau of Labor Statistics, TradingEconomics.com
Looking for more information on the Stock Market Outlook Signals?
You'll find it here:
Share this on social media:
Find articles and other news of interest from Invest-Safely:
Twitter (@investsafely)
Facebook (@InvestSafely)
LinkedIn (@Invest-Safely)
Instagram (@investsafely)
 If you're interested in learning more about the relationship between price and volume, or how to find and trade the best stocks for your growth strategy, check out this book via the following Amazon affiliate link:
How to Make Money in Stocks: A Winning System in Good Times and Bad.
It's one of my favorites.
Invest Safely, LLC is an independent investment research and online financial media company. Use of Invest Safely, LLC and any other products available through invest-safely.com is subject to our Terms of Service and Privacy Policy. Not a recommendation to buy or sell any security.
Charts provided courtesy of stockcharts.com.
For historical Elliott Wave commentary and analysis, go to ELLIOTT WAVE lives on by Tony Caldaro. Current counts can be found at: Pretzel Logic, and 12345ABCDEWXYZ
Once a year, I review the market outlook signals as if they were a mechanical trading system, while pointing out issues and making adjustments. The goal is to give you to give you an example of how to analyze and continuously improve your own systems.
- 2015 Performance - Stock Market Outlook
- 2016 Performance - Stock Market Outlook
- 2017 Performance - Stock Market Outlook
- 2018 Performance - Stock Market Outlook
- 2019 Performance - Stock Market Outlook
- 2020 Performance - Stock Market Outlook
IMPORTANT DISCLOSURE INFORMATION
This material is for general communication and is provided for informational and/or educational purposes only. None of the content should be viewed as a suggestion that you take or refrain from taking any action nor as a recommendation for any specific investment product, strategy, or other such purpose. Certain information contained herein has been obtained from third-party sources believed to be reliable, but we cannot guarantee its accuracy or completeness.
To the extent that a reader has any questions regarding the applicability of any specific issue discussed above to his/her individual situation, he/she is encouraged to consult with the professional advisors of his/her choosing. Invest Safely, LLC is not a law firm, certified public accounting firm, or registered investment advisor and no portion of its content should be construed as legal, accounting, or investment advice.
The material is not to be construed as an offer or a recommendation to buy or sell a security nor is it to be construed as investment advice. Additionally, the material accessible through this website does not constitute a representation that the investments described herein are suitable or appropriate for any person.
Hypothetical Presentations:
Any referenced performance is “as calculated” using the referenced funds and has not been independently verified. This presentation does not discuss, directly or indirectly, the amount of the profits or losses, realized or unrealized, by any reader or contributor, from any specific funds or securities.
The author and/or any reader may have experienced materially different performance based upon various factors during the corresponding time periods. To the extent that any portion of the content reflects hypothetical results that were achieved by means of the retroactive application of a back-tested model, such results have inherent limitations, including:
Model results do not reflect the results of actual trading using assets, but were achieved by means of the retroactive application of the referenced models, certain aspects of which may have been designed with the benefit of hindsight
Back-tested performance may not reflect the impact that any material market or economic factors might have had on the use of a trading model if the model had been used during the period to actually manage assets
Actual investment results during the corresponding time periods may have been materially different from those portrayed in the model
Past performance may not be indicative of future results. Therefore, no one should assume that future performance will be profitable, or equal to any corresponding historical index.
The S&P 500 Composite Total Return Index (the "S&P") is a market capitalization-weighted index of 500 widely held stocks often used as a proxy for the stock market. Standard & Poor's chooses the member companies for the S&P based on market size, liquidity, and industry group representation. Included are the common stocks of industrial, financial, utility, and transportation companies. The S&P is not an index into which an investor can directly invest. The historical S&P performance results (and those of all other indices) are provided exclusively for comparison purposes only, so as to provide general comparative information to assist an individual in determining whether the performance of a specific portfolio or model meets, or continues to meet investment objective(s). The model and indices performance results do not reflect the impact of taxes.
Investing involves risk (even the “safe” kind)! Past performance does not guarantee or indicate future results. Different types of investments involve varying degrees of underlying risk. Therefore, do not assume that future performance of any specific investment or investment strategy be suitable for your portfolio or individual situation, will be profitable, equal any historical performance level(s), or prove successful (including the investments and/or investment strategies describe on this site).
Investing Process Links
Stabilize- Organize your $$$
- Manage your $$$
Plan
- Why You Invest
- Ways to Invest
- Where to Invest
- What to Invest In
Execute
- When to Invest
- How Much to Invest
- Buying & Selling
Monitor
- Track The Market
- Track Your Returns
Reflect & Adjust
- Improve Your Returns
- Adjust your Holdings
Popular Pages
- Jim Cramer- Personal Incomes Statements
- Hyperinflation
- Calculating Beta
- SMART Financial Goals
Blogroll
- Advisor Perspectives- Dividend Growth Investor
- Elliott Wave Lives On
- On My Radar | CMG Wealth
- Sure Dividend
- The Big Picture
- The Fat Pitch
- Thoughts from the Frontline
- Trader Feed
Sponsored Links
Invest Safely provides valuable, time-saving info about personal finance, money management, and investing.


