Stock Market Outlook
For The Week Of November 2nd = Uptrend
INDICATORS
-
ADX Directional Index: Uptrend
Institutional Activity: Uptrend
On Balance Volume: Uptrend
ANALYSIS
The stock market outlook continues to show an uptrend for U.S. equities.
The S&P500 ( $SPX ) rose 0.7% last week. The index sits ~3% above the 50-day moving average and ~12% above the 200-day moving average.
All three indicators show bullish price action. The index saw elevated selling on Thursday and Friday, but neither session met the criteria for a distribution day.
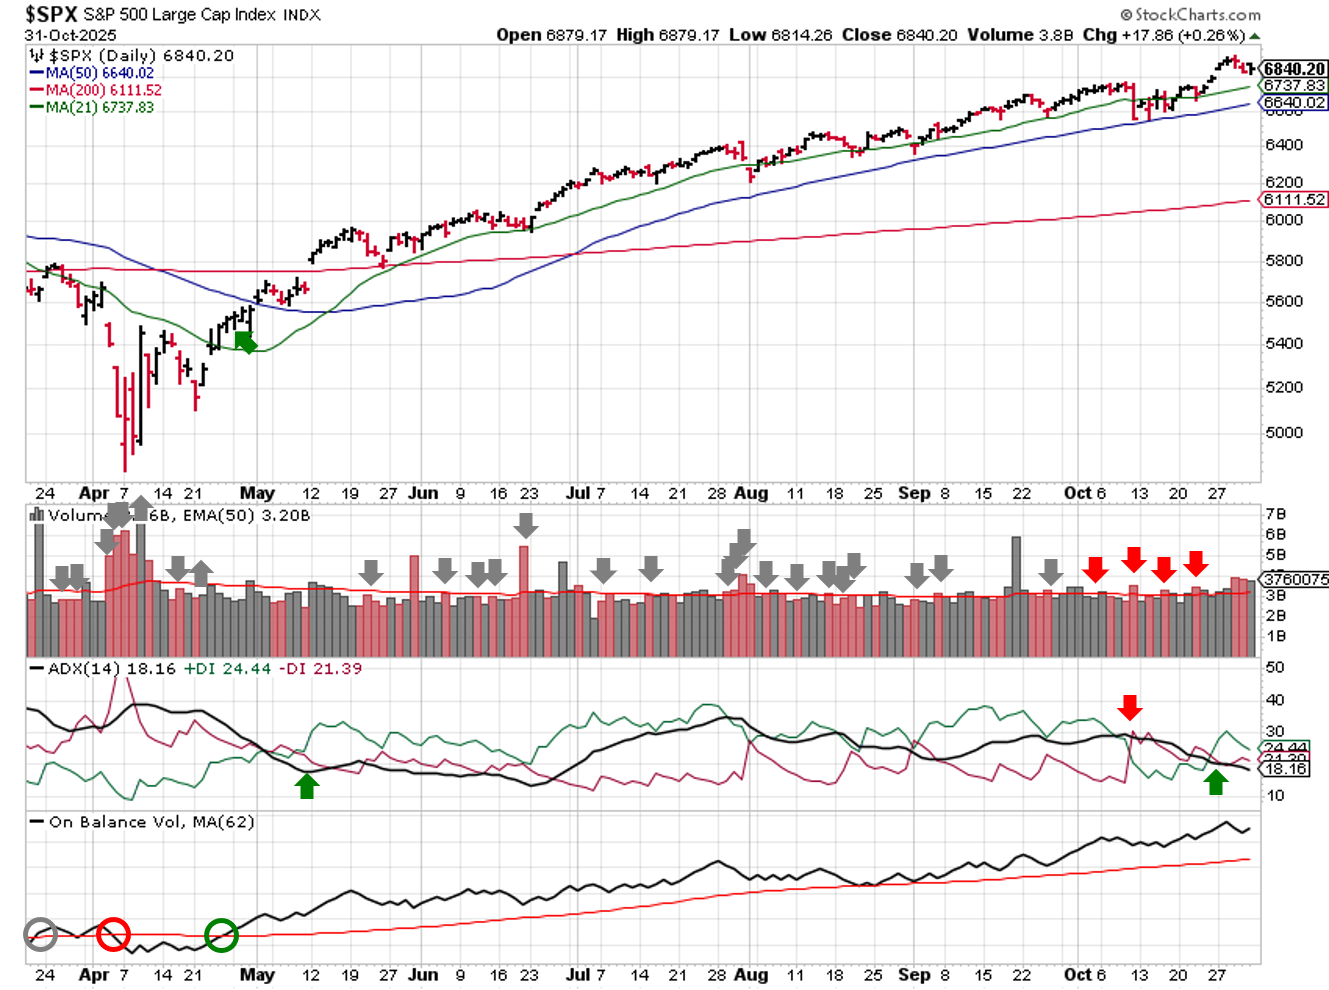
SPX Technical Analysis - November 02 2025
PERFORMANCE COMPARISONS
The Tech sector ( $XLK ) led stocks higher again, while Real Estate ( $XLRE ) underperformed, along with Materials and Consumer Staples ( $XLB & $XLP ).
Financials and Real Estate ( $XLF, $XLRE ) fell to bearish bias; Communications ( $XLC ) eased to neutral after rising almost 18% since it shifted to bullish back in May.
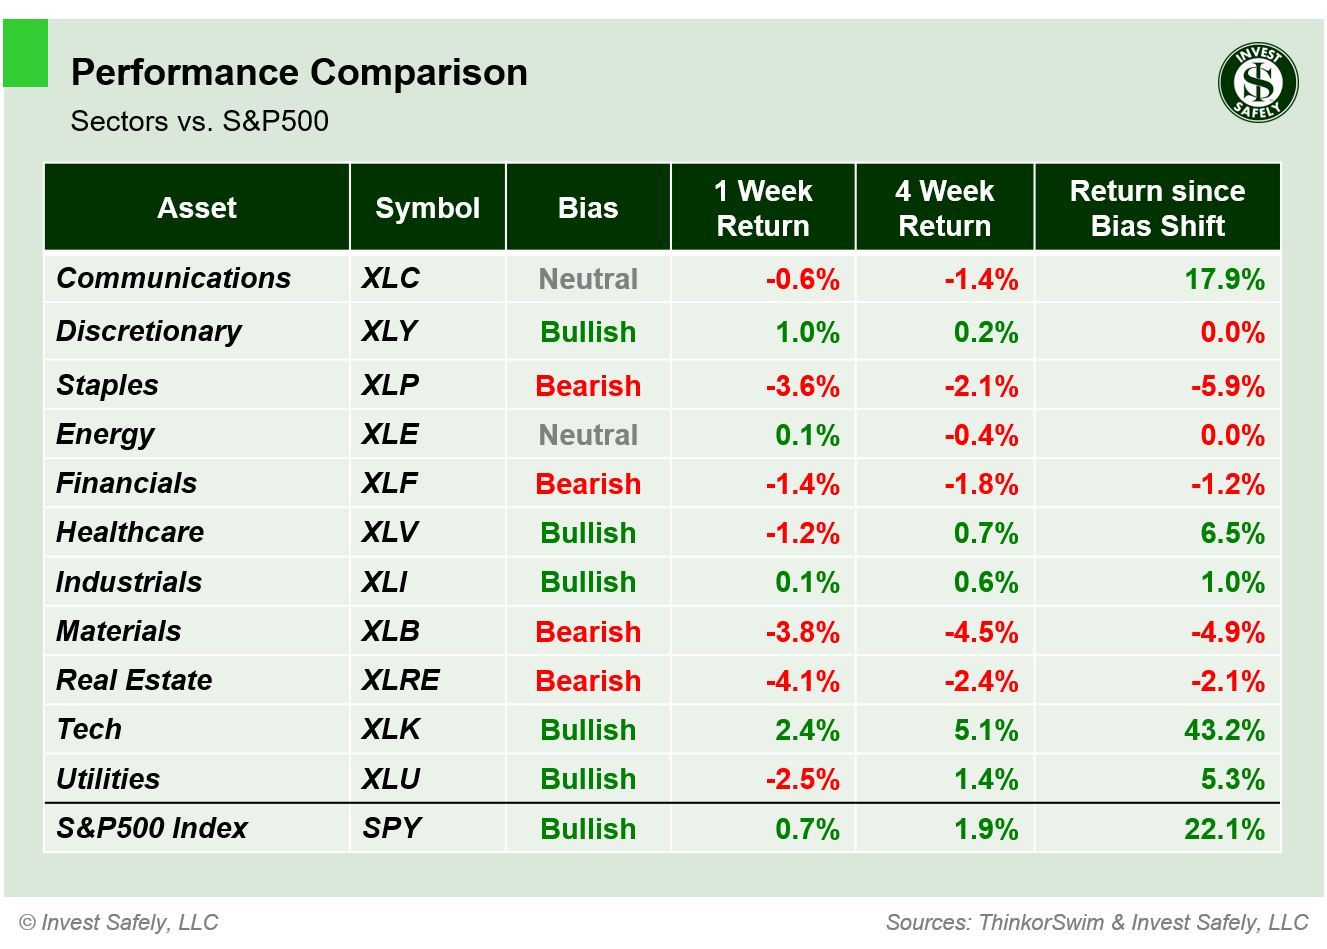
S&P500 Sector Performance - November 02 2025
Large and Mega Cap Growth ( $IWF & $OEF ) outperformed, while High Dividend, Low Beta, Small and Midcap Value ( $SPHD, $SPLV, $IWN, $IJJ ) underperformed significantly.
Mid Cap Growth and Value ( $IJH, $IJJ ) were on the move again this week; Mid Cap Growth slowed back to Neutral and Mid Cap Value fell to Bearish bias.
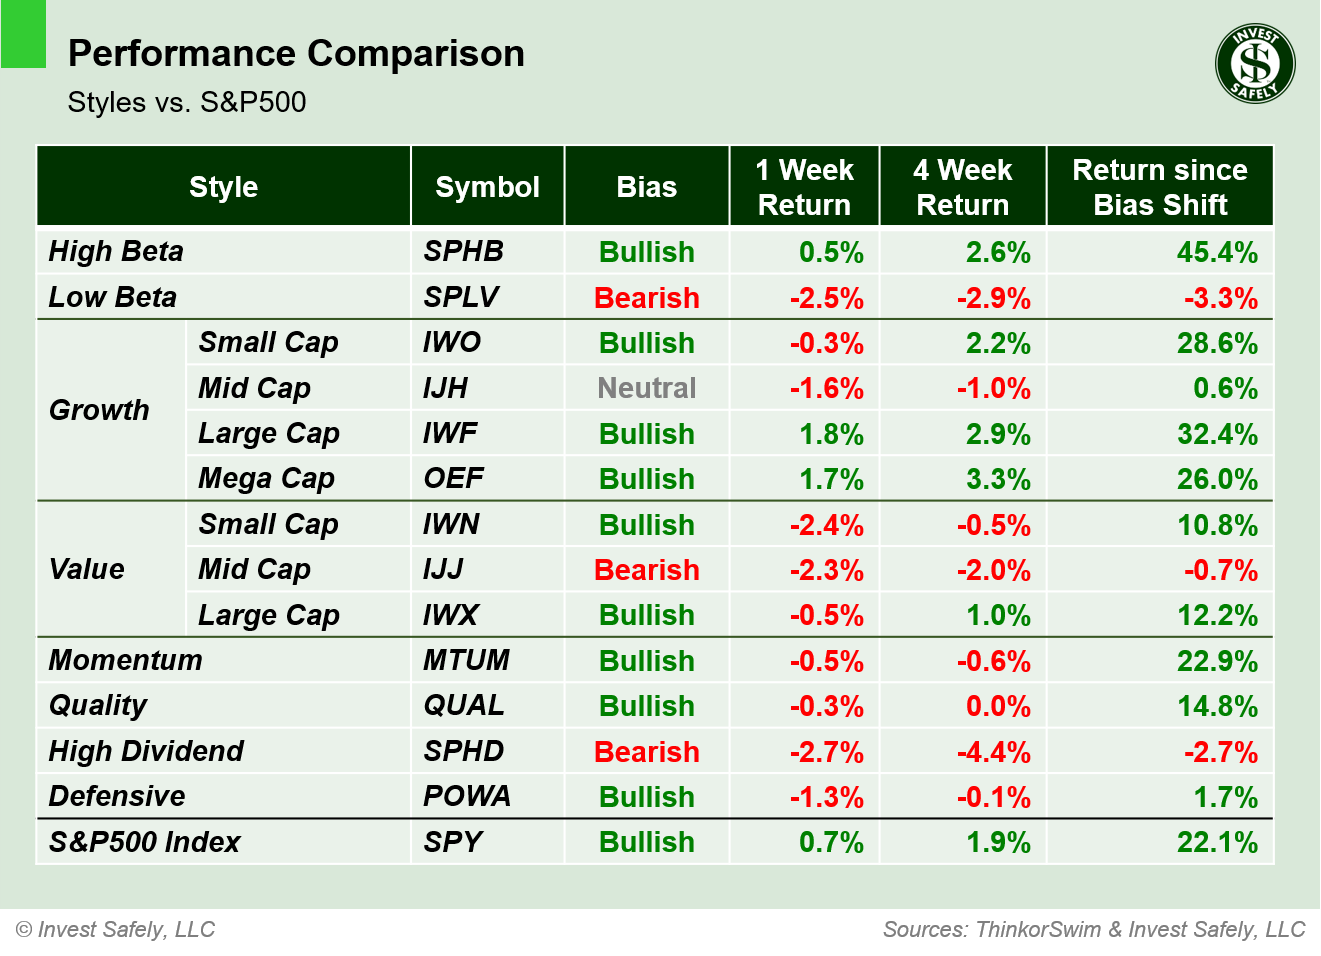
S&P500 Sector Style Performance - November 02 2025
The U.S. Dollar ( $DXY ) was the best asset last week, so that was headwind for the other classes ( Gold struggled the most ). Bonds went back to Neutral bias.
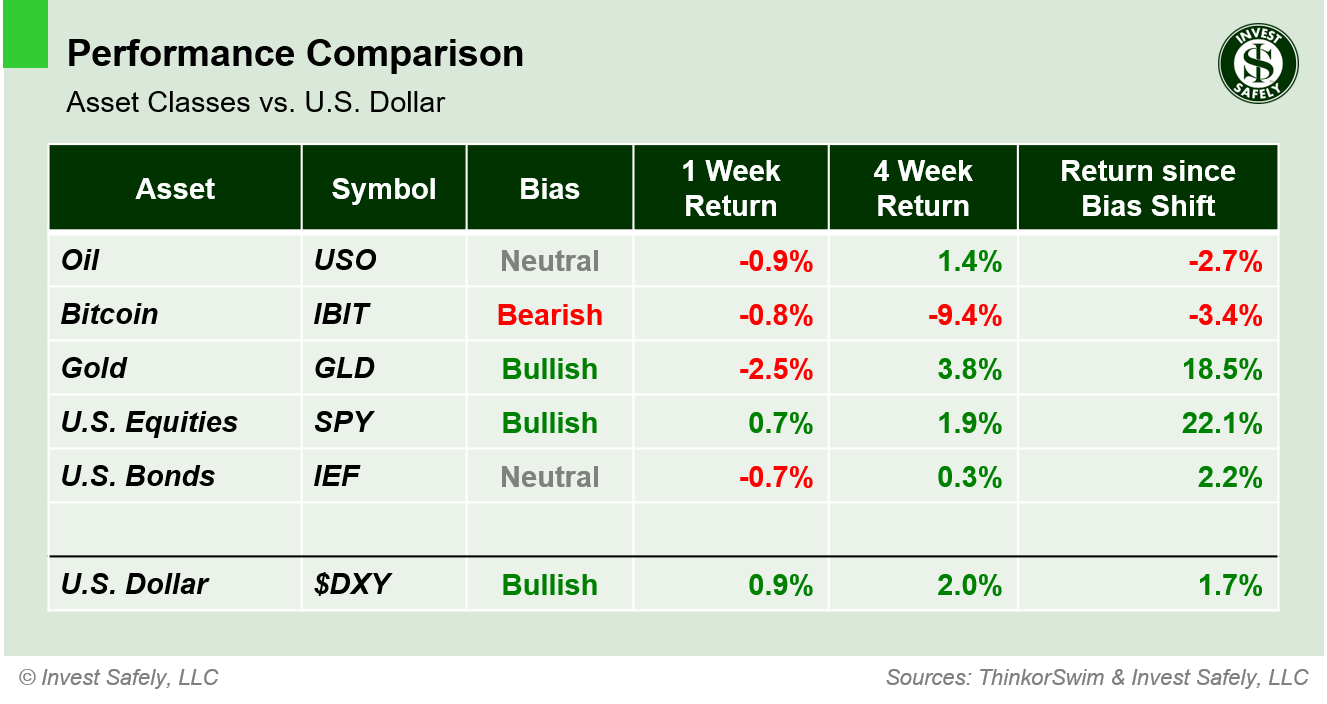
Asset Class Performance - November 02 2025
COMMENTARY
The FOMC decided to lower interest rates 0.25% last week. Given the lack of government data, there was a very small chance of no change, but the number of recent layoff announcements probably spooked them enough to do something.
5 of the Magnificent 7 have reported earnings last week, and Amazon ( $AMZN ) stole the show, in terms of price performance, gaping up ~12%. Alphabet ( $GOOGL ) also performed well, while Apple's stock price didn't respond much. Microsoft ( $MSFT ) didn't far as well, reversing the positive, post-earnings move by the end of the week, and Meta ( $META ) was punished after the company announced plans for $100 billion in AI investments for 2026.
The U.S. and China reached a trade deal over the weekend, which removes many of the recent trade barriers the two countries enacted. The deal should reduce supply chain issues for a number of industries, including semiconductors, rare earth materials, agriculture. Expect to see some volatility in Sunday futures...much like prior trade-deal headlines that occurred while markets were closed.
Looking ahead, ISM Manufacturing and Services PMI data is released Monday and Wednesday, respectively. Since it's unlikely we'll see any government data releases, attention shifts to private sector reporting, namely ADP Employment Change on Wednesday, and Challenger Job cuts on Thursday.
Best to Your Week!
P.S. If you find this research helpful, please tell a friend.
If you don't, tell an enemy.
Sources: Bloomberg, CNBC, Federal Reserve Bank of St. Louis, Hedgeye, U.S. Bureau of Economic Analysis, U.S. Bureau of Labor Statistics, TradingEconomics.com
Looking for more information on the Stock Market Outlook Signals?
You'll find it here:
Share this on social media:
Find articles and other news of interest from Invest-Safely:
Twitter (@investsafely)
Facebook (@InvestSafely)
LinkedIn (@Invest-Safely)
Instagram (@investsafely)
 If you're interested in learning more about the relationship between price and volume, or how to find and trade the best stocks for your growth strategy, check out this book via the following Amazon affiliate link:
How to Make Money in Stocks: A Winning System in Good Times and Bad.
It's one of my favorites.
Invest Safely, LLC is an independent investment research and online financial media company. Use of Invest Safely, LLC and any other products available through invest-safely.com is subject to our Terms of Service and Privacy Policy. Not a recommendation to buy or sell any security.
Charts provided courtesy of stockcharts.com.
For historical Elliott Wave commentary and analysis, go to ELLIOTT WAVE lives on by Tony Caldaro. Current counts can be found at: Pretzel Logic, and 12345ABCDEWXYZ
Once a year, I review the market outlook signals as if they were a mechanical trading system, while pointing out issues and making adjustments. The goal is to give you to give you an example of how to analyze and continuously improve your own systems.
- 2015 Performance - Stock Market Outlook
- 2016 Performance - Stock Market Outlook
- 2017 Performance - Stock Market Outlook
- 2018 Performance - Stock Market Outlook
- 2019 Performance - Stock Market Outlook
- 2020 Performance - Stock Market Outlook
IMPORTANT DISCLOSURE INFORMATION
This material is for general communication and is provided for informational and/or educational purposes only. None of the content should be viewed as a suggestion that you take or refrain from taking any action nor as a recommendation for any specific investment product, strategy, or other such purpose. Certain information contained herein has been obtained from third-party sources believed to be reliable, but we cannot guarantee its accuracy or completeness.
To the extent that a reader has any questions regarding the applicability of any specific issue discussed above to his/her individual situation, he/she is encouraged to consult with the professional advisors of his/her choosing. Invest Safely, LLC is not a law firm, certified public accounting firm, or registered investment advisor and no portion of its content should be construed as legal, accounting, or investment advice.
The material is not to be construed as an offer or a recommendation to buy or sell a security nor is it to be construed as investment advice. Additionally, the material accessible through this website does not constitute a representation that the investments described herein are suitable or appropriate for any person.
Hypothetical Presentations:
Any referenced performance is “as calculated” using the referenced funds and has not been independently verified. This presentation does not discuss, directly or indirectly, the amount of the profits or losses, realized or unrealized, by any reader or contributor, from any specific funds or securities.
The author and/or any reader may have experienced materially different performance based upon various factors during the corresponding time periods. To the extent that any portion of the content reflects hypothetical results that were achieved by means of the retroactive application of a back-tested model, such results have inherent limitations, including:
Model results do not reflect the results of actual trading using assets, but were achieved by means of the retroactive application of the referenced models, certain aspects of which may have been designed with the benefit of hindsight
Back-tested performance may not reflect the impact that any material market or economic factors might have had on the use of a trading model if the model had been used during the period to actually manage assets
Actual investment results during the corresponding time periods may have been materially different from those portrayed in the model
Past performance may not be indicative of future results. Therefore, no one should assume that future performance will be profitable, or equal to any corresponding historical index.
The S&P 500 Composite Total Return Index (the "S&P") is a market capitalization-weighted index of 500 widely held stocks often used as a proxy for the stock market. Standard & Poor's chooses the member companies for the S&P based on market size, liquidity, and industry group representation. Included are the common stocks of industrial, financial, utility, and transportation companies. The S&P is not an index into which an investor can directly invest. The historical S&P performance results (and those of all other indices) are provided exclusively for comparison purposes only, so as to provide general comparative information to assist an individual in determining whether the performance of a specific portfolio or model meets, or continues to meet investment objective(s). The model and indices performance results do not reflect the impact of taxes.
Investing involves risk (even the “safe” kind)! Past performance does not guarantee or indicate future results. Different types of investments involve varying degrees of underlying risk. Therefore, do not assume that future performance of any specific investment or investment strategy be suitable for your portfolio or individual situation, will be profitable, equal any historical performance level(s), or prove successful (including the investments and/or investment strategies describe on this site).
Investing Process Links
Stabilize- Organize your $$$
- Manage your $$$
Plan
- Why You Invest
- Ways to Invest
- Where to Invest
- What to Invest In
Execute
- When to Invest
- How Much to Invest
- Buying & Selling
Monitor
- Track The Market
- Track Your Returns
Reflect & Adjust
- Improve Your Returns
- Adjust your Holdings
Popular Pages
- Jim Cramer- Personal Incomes Statements
- Hyperinflation
- Calculating Beta
- SMART Financial Goals
Blogroll
- Advisor Perspectives- Dividend Growth Investor
- Elliott Wave Lives On
- On My Radar | CMG Wealth
- Sure Dividend
- The Big Picture
- The Fat Pitch
- Thoughts from the Frontline
- Trader Feed
Sponsored Links
Invest Safely provides valuable, time-saving info about personal finance, money management, and investing.


