Stock Market Outlook
For The Week Of October 19th = Uptrend
INDICATORS
-
ADX Directional Index: Downtrend
Institutional Activity: Uptrend
On Balance Volume: Uptrend
ANALYSIS
The stock market outlook continues to show an uptrend for U.S. equities.
The S&P500 ( $SPX ) rose 1.7% last week. The index sits less than 2% above the 50-day moving average and ~10% above the 200-day moving average.
No change in the indicators from last week. The index added another distribution day, bringing the total 4; 5 or more is considered elevated.
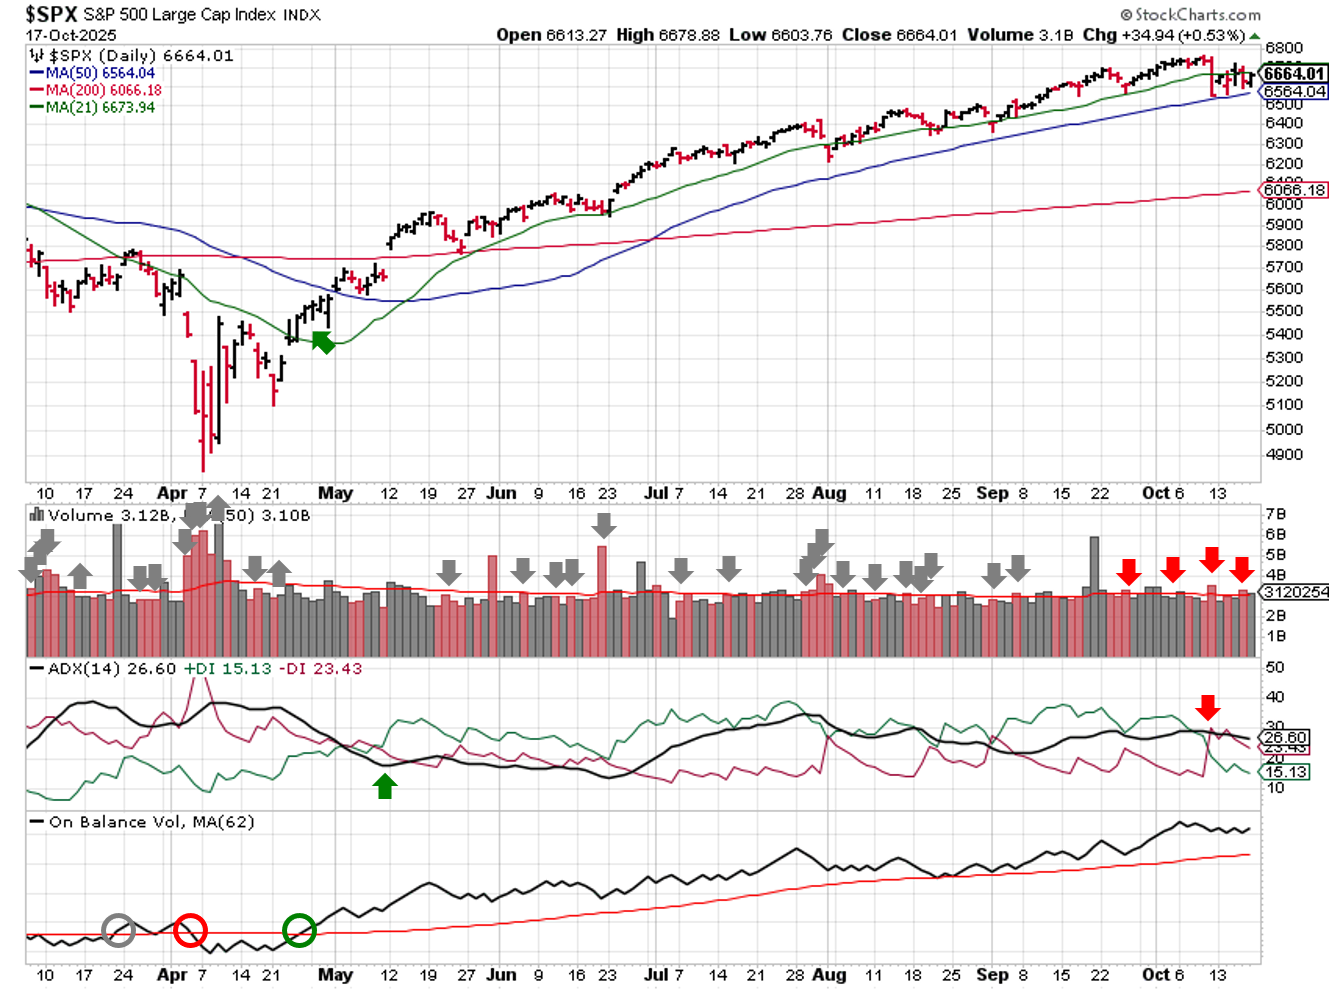
SPX Technical Analysis - October 19 2025
PERFORMANCE COMPARISONS
Real Estate ( $XLRE ) led sectors higher, while Financials ( $XLF ) underperformed; more on that sector in the commentary. Communications, Consumer Discretionary, and Real Estate ( $XLC, $XLY, $XLRE ) recovered to Bullish bias; Industrials ( $XLI ) eased back to Neutral.
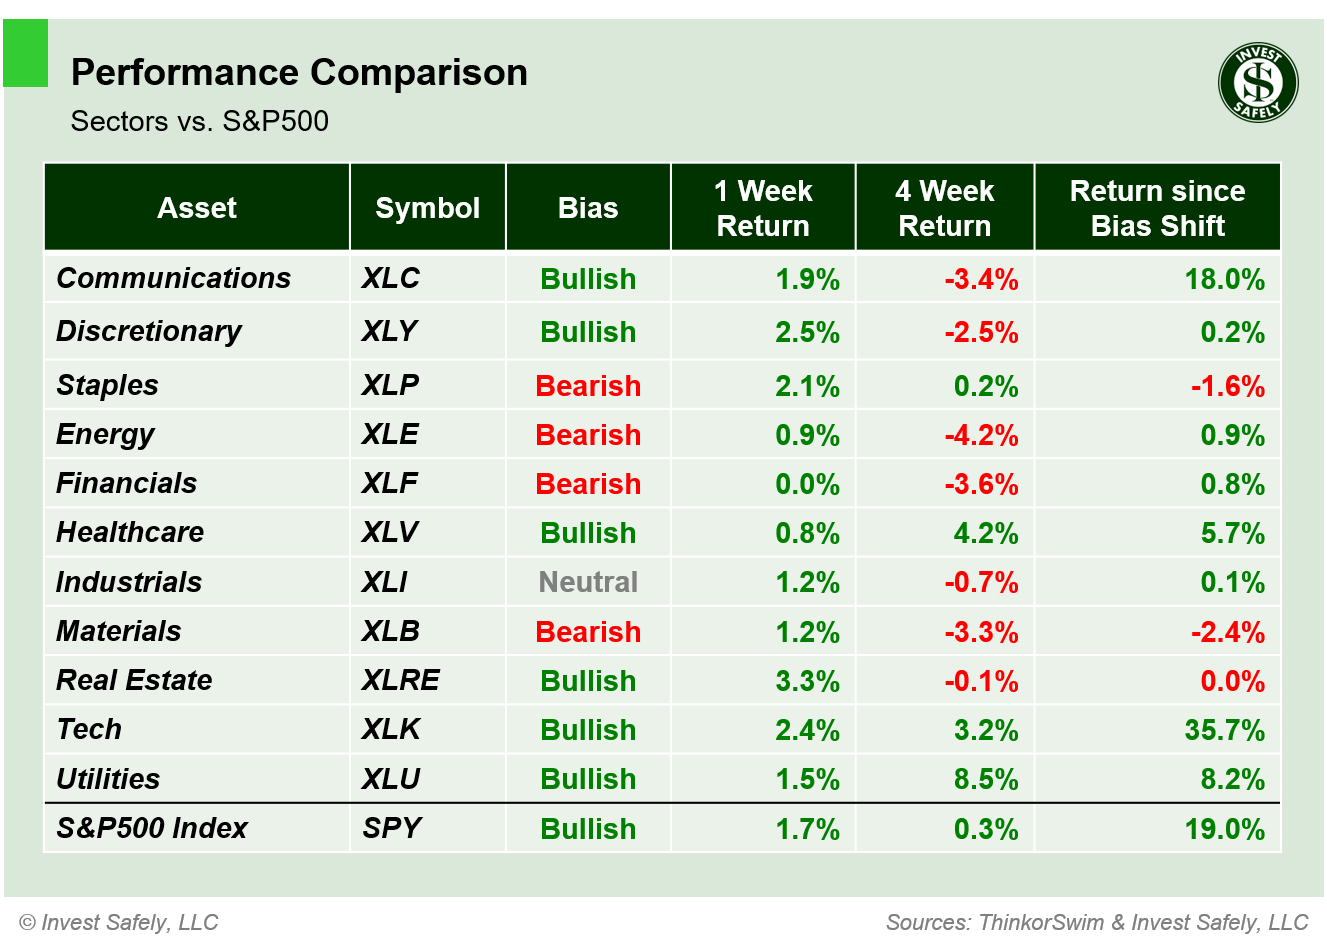
S&P500 Sector Performance - October 19 2025
Reversing from the prior week, all sector styles registered a gain; High Beta ( $SPHB ) outperformed, Low Beta underperformed ( $SPLV ). Mega Cap Growth and Large Cap Value ( $OEF, $IWX, $POWA ) moved to Bullish bias; Mid Cap Growth and Value, ( $IJH, $IJJ ) eased back to Neutral bias.
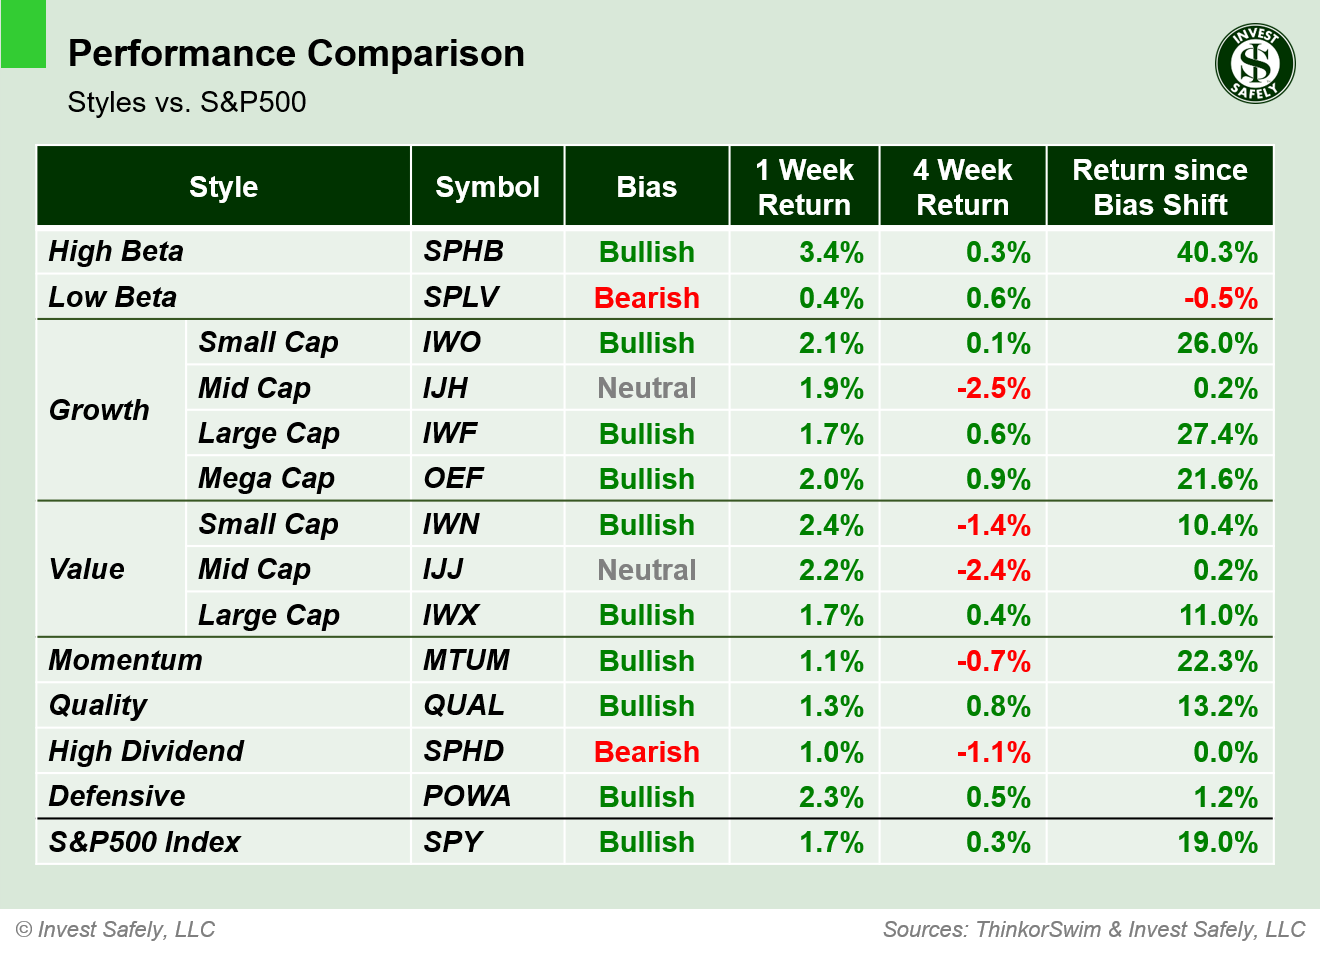
S&P500 Sector Style Performance - October 19 2025
Gold outperformed all assets last week, despite the dip on Friday. Bitcoin ( $IBIT ) sold off again, and fell to Bearish bias. The U.S. Dollar moved back to Neutral bias.
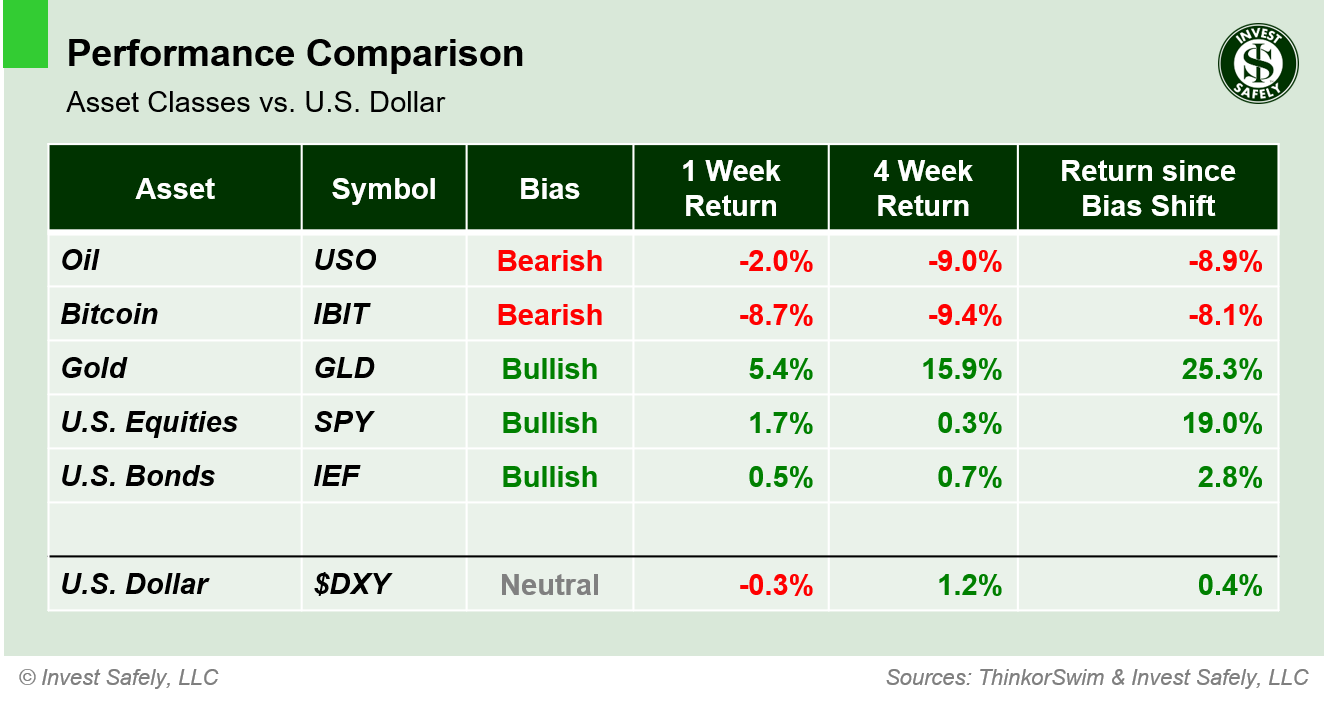
Asset Class Performance - October 19 2025
COMMENTARY
Price and volume didn't give many clues to the markets next move. The S&P500 spent the week consolidating the October 10th sell-off; no quick recovery, but no further sell-off. Volatility ( $VIX ) eased towards 20 on Friday, but made higher lows all week. The U.S. dollar faded towards oversold, but remains bullish.
Fraud allegations led to a sell off across the banking sector, on fears of broader commercial credit risks. Two regional banks revealed multi-million dollar losses tied to suspected loan fraud by borrowers. These disclosures follow bankruptcies by an auto parts supplier ( First Brands ) and car dealership ( Tricolor ), after these two borrowers engaging in off-balance-sheet debt and subprime loans to undocumented and no credit borrowers, respectively. Despite the boilerplate responses ( financial system is sound, credit quality is strong ), keep an eye out for more "cockroaches", as Jamie Dimon put it.
With Gold up 25% since turning bullish, and last week's move looking a bit parabolic, taking some profit is a good idea. The same goes for other sectors and styles with returns in the double digits (*cough* High Beta *cough*).
This week September CPI will be released, despite the government shutdown, since the Social Security Administration needs third-quarter CPI data for annual cost-of-living adjustments.
Best to Your Week!
P.S. If you find this research helpful, please tell a friend.
If you don't, tell an enemy.
Sources: Bloomberg, CNBC, Federal Reserve Bank of St. Louis, Hedgeye, U.S. Bureau of Economic Analysis, U.S. Bureau of Labor Statistics, TradingEconomics.com
Looking for more information on the Stock Market Outlook Signals?
You'll find it here:
Share this on social media:
Find articles and other news of interest from Invest-Safely:
Twitter (@investsafely)
Facebook (@InvestSafely)
LinkedIn (@Invest-Safely)
Instagram (@investsafely)
 If you're interested in learning more about the relationship between price and volume, or how to find and trade the best stocks for your growth strategy, check out this book via the following Amazon affiliate link:
How to Make Money in Stocks: A Winning System in Good Times and Bad.
It's one of my favorites.
Invest Safely, LLC is an independent investment research and online financial media company. Use of Invest Safely, LLC and any other products available through invest-safely.com is subject to our Terms of Service and Privacy Policy. Not a recommendation to buy or sell any security.
Charts provided courtesy of stockcharts.com.
For historical Elliott Wave commentary and analysis, go to ELLIOTT WAVE lives on by Tony Caldaro. Current counts can be found at: Pretzel Logic, and 12345ABCDEWXYZ
Once a year, I review the market outlook signals as if they were a mechanical trading system, while pointing out issues and making adjustments. The goal is to give you to give you an example of how to analyze and continuously improve your own systems.
- 2015 Performance - Stock Market Outlook
- 2016 Performance - Stock Market Outlook
- 2017 Performance - Stock Market Outlook
- 2018 Performance - Stock Market Outlook
- 2019 Performance - Stock Market Outlook
- 2020 Performance - Stock Market Outlook
IMPORTANT DISCLOSURE INFORMATION
This material is for general communication and is provided for informational and/or educational purposes only. None of the content should be viewed as a suggestion that you take or refrain from taking any action nor as a recommendation for any specific investment product, strategy, or other such purpose. Certain information contained herein has been obtained from third-party sources believed to be reliable, but we cannot guarantee its accuracy or completeness.
To the extent that a reader has any questions regarding the applicability of any specific issue discussed above to his/her individual situation, he/she is encouraged to consult with the professional advisors of his/her choosing. Invest Safely, LLC is not a law firm, certified public accounting firm, or registered investment advisor and no portion of its content should be construed as legal, accounting, or investment advice.
The material is not to be construed as an offer or a recommendation to buy or sell a security nor is it to be construed as investment advice. Additionally, the material accessible through this website does not constitute a representation that the investments described herein are suitable or appropriate for any person.
Hypothetical Presentations:
Any referenced performance is “as calculated” using the referenced funds and has not been independently verified. This presentation does not discuss, directly or indirectly, the amount of the profits or losses, realized or unrealized, by any reader or contributor, from any specific funds or securities.
The author and/or any reader may have experienced materially different performance based upon various factors during the corresponding time periods. To the extent that any portion of the content reflects hypothetical results that were achieved by means of the retroactive application of a back-tested model, such results have inherent limitations, including:
Model results do not reflect the results of actual trading using assets, but were achieved by means of the retroactive application of the referenced models, certain aspects of which may have been designed with the benefit of hindsight
Back-tested performance may not reflect the impact that any material market or economic factors might have had on the use of a trading model if the model had been used during the period to actually manage assets
Actual investment results during the corresponding time periods may have been materially different from those portrayed in the model
Past performance may not be indicative of future results. Therefore, no one should assume that future performance will be profitable, or equal to any corresponding historical index.
The S&P 500 Composite Total Return Index (the "S&P") is a market capitalization-weighted index of 500 widely held stocks often used as a proxy for the stock market. Standard & Poor's chooses the member companies for the S&P based on market size, liquidity, and industry group representation. Included are the common stocks of industrial, financial, utility, and transportation companies. The S&P is not an index into which an investor can directly invest. The historical S&P performance results (and those of all other indices) are provided exclusively for comparison purposes only, so as to provide general comparative information to assist an individual in determining whether the performance of a specific portfolio or model meets, or continues to meet investment objective(s). The model and indices performance results do not reflect the impact of taxes.
Investing involves risk (even the “safe” kind)! Past performance does not guarantee or indicate future results. Different types of investments involve varying degrees of underlying risk. Therefore, do not assume that future performance of any specific investment or investment strategy be suitable for your portfolio or individual situation, will be profitable, equal any historical performance level(s), or prove successful (including the investments and/or investment strategies describe on this site).
Investing Process Links
Stabilize- Organize your $$$
- Manage your $$$
Plan
- Why You Invest
- Ways to Invest
- Where to Invest
- What to Invest In
Execute
- When to Invest
- How Much to Invest
- Buying & Selling
Monitor
- Track The Market
- Track Your Returns
Reflect & Adjust
- Improve Your Returns
- Adjust your Holdings
Popular Pages
- Jim Cramer- Personal Incomes Statements
- Hyperinflation
- Calculating Beta
- SMART Financial Goals
Blogroll
- Advisor Perspectives- Dividend Growth Investor
- Elliott Wave Lives On
- On My Radar | CMG Wealth
- Sure Dividend
- The Big Picture
- The Fat Pitch
- Thoughts from the Frontline
- Trader Feed
Sponsored Links
Invest Safely provides valuable, time-saving info about personal finance, money management, and investing.


