Stock Market Outlook
For The Week Of October 12th = Uptrend
INDICATORS
-
ADX Directional Index: Downtrend
Institutional Activity: Uptrend
On Balance Volume: Uptrend
ANALYSIS
The stock market outlook continues to show an uptrend for U.S. equities, despite Friday's meltdown.
The S&P500 ( $SPX ) fell 2.4% last week, with all the damage occurring during Friday's session. The index sits less than 1% above the 50-day moving average and ~8% above the 200-day moving average.
The ADX indicator flipped to bearish; not a surprise given Friday's move. In addition to Friday's distribution day, there was a stalling day on October 3rd missed in the last update, bringing the total count to 3.
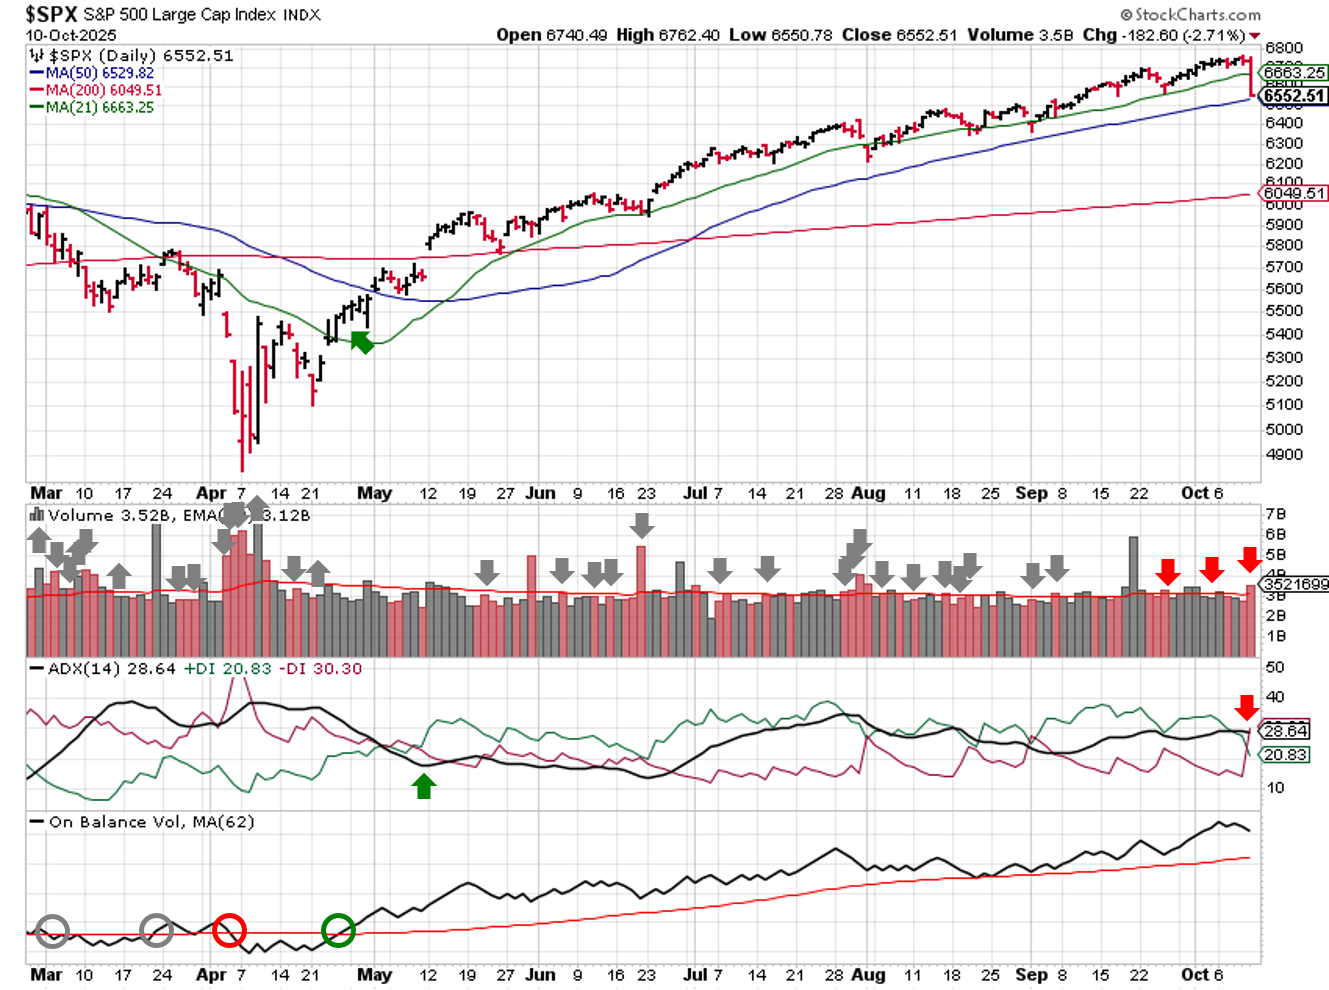
SPX Technical Analysis - October 12 2025
PERFORMANCE COMPARISONS
Utilities ( $XLU ) escaped the week with a gain, Consumer Staples basically broke even. Otherwise a lot of losses, led lower by Energy ( $XLE ). Consumer Discretionary, Energy, Financials, Industrials, Materials, and Real Estate ( $XLY, $XLE, $XLF, $XLI, $XLB, $XLRE ) all dropped to Bearish bias, and Communications ( $XLC ) fell to Neutral.
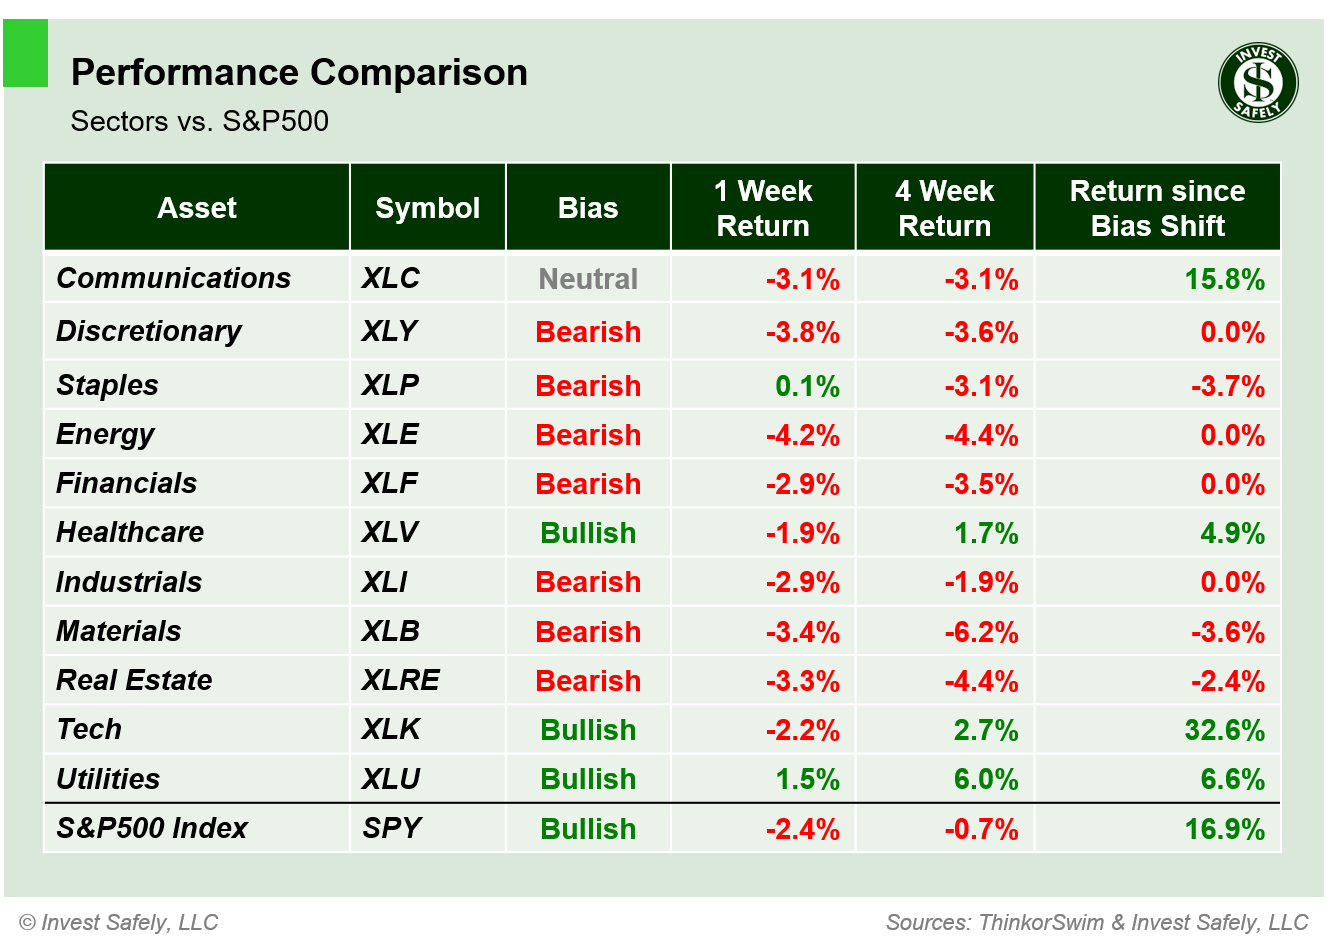
S&P500 Sector Performance - October 12 2025
All sector styles registered a loss lasts week; Low Beta ( $SPLV ) was the least "bad" and Mid Cap Value ( $IJJ ) was the worst. Low Beta, Mid Cap Growth and Value, High Dividend and Defensive ( $SPLV, $OJH, $IJJ, $SPHD, $POWA ) all moved to Bearish Bias; Mega Cap Growth and Large Cap Value ( $OEF, $IWX ) moved to neutral.
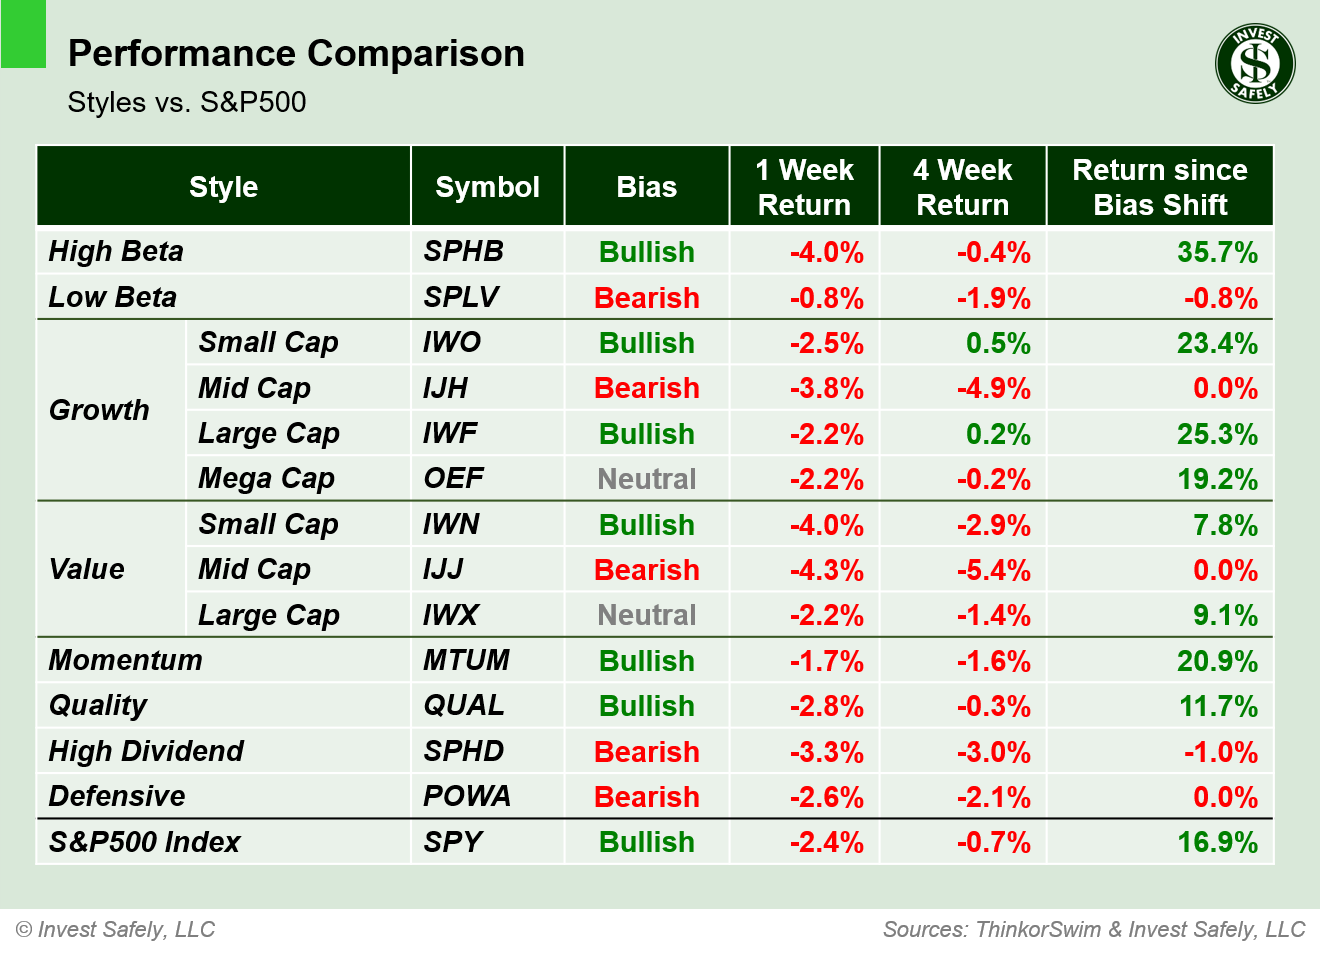
S&P500 Sector Style Performance - October 12 2025
Bitcoin ( $IBIT ) led Oil and U.S. equities lower, while Gold outperformed to the upside. Bitcoin also moved to Bearish bias, while the U.S. Dollar moved to bullish.
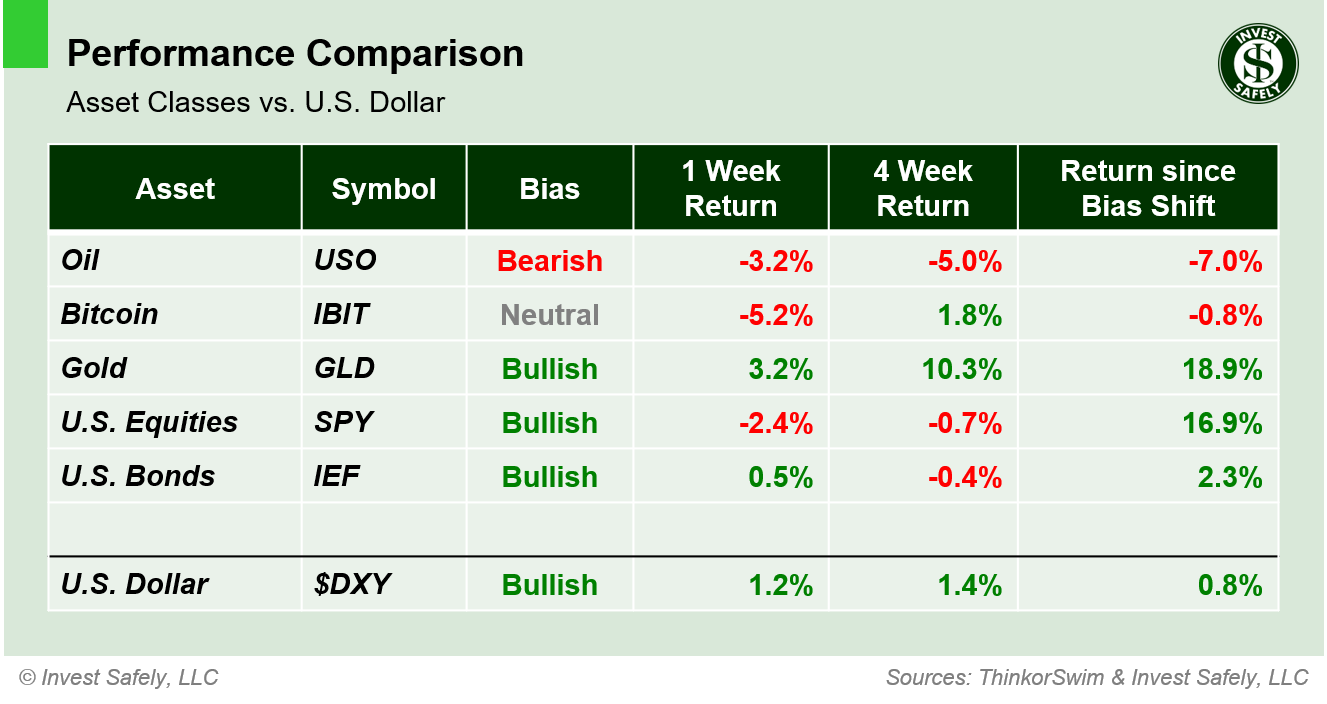
Asset Class Performance - October 12 2025
COMMENTARY
Friday's trading session was a reminder that substantial geopolitical risks remain in play, even if the market has largely ignored them since April. The massive sell-off was sparked by a social media post from President Trump at 10:57 a.m., lamenting China's recent stance on sourcing rare earth metals and potential response options.
The volatility was especially bad for crypto markets, resulting in forced liquidations and other "emergency" measures. The level of wealth destruction is a sobering reminder that crypto remains a highly leveraged, highly speculative, low liquidity asset class, despite making inroads into institutional portfolios and fund offerings.
The silver lining was a lack of by institutional selling, seen in the indexes, leading up to Friday's meltdown. Now we need to see how institutions respond; was this a one time event that's recovered quickly, or the start of repricing for a higher risk environment. Watch volatility ( $VIX ) for the next few days; it spiked into the 20's on Friday and needs to retreat quickly to avoid altering capital flows.
U.S. equity sectors and styles flirted with bias changes over the past few weeks, so the fact that Friday's sell-off pushed many into bearish territory isn't too surprising. Recent outperformance by Utilities and Healthcare is a bit more interesting, as those sectors typically lead when growth and inflation are slowing.
Keep an eye on the U.S. dollar as well. It's moved to bullish bias now, and may have completed its own bottoming process in mid-September, which would also contribute to weaker returned for equities, from a historical perspective.
Monday's session is also a bit of an unknown, as equity markets are open despite a bank holiday here in the U.S. Any residual liquidity issues created Friday, or new ones created Monday, may not be rectified until Tuesday. It's possible volatility could drag on into the middle of next week.
Federal Reserve officials were already planning to work overtime next week, slated for a total of 18 speaking engagements! September PPI was on the schedule, but we won't see those numbers unless the government shutdown ends.
And in the background of all this market "drama" is the start of earnings season, with major investment banks kicking things off on Tuesday!
Best to Your Week!
P.S. If you find this research helpful, please tell a friend.
If you don't, tell an enemy.
Sources: Bloomberg, CNBC, Federal Reserve Bank of St. Louis, Hedgeye, U.S. Bureau of Economic Analysis, U.S. Bureau of Labor Statistics, TradingEconomics.com
Looking for more information on the Stock Market Outlook Signals?
You'll find it here:
Share this on social media:
Find articles and other news of interest from Invest-Safely:
Twitter (@investsafely)
Facebook (@InvestSafely)
LinkedIn (@Invest-Safely)
Instagram (@investsafely)
 If you're interested in learning more about the relationship between price and volume, or how to find and trade the best stocks for your growth strategy, check out this book via the following Amazon affiliate link:
How to Make Money in Stocks: A Winning System in Good Times and Bad.
It's one of my favorites.
Invest Safely, LLC is an independent investment research and online financial media company. Use of Invest Safely, LLC and any other products available through invest-safely.com is subject to our Terms of Service and Privacy Policy. Not a recommendation to buy or sell any security.
Charts provided courtesy of stockcharts.com.
For historical Elliott Wave commentary and analysis, go to ELLIOTT WAVE lives on by Tony Caldaro. Current counts can be found at: Pretzel Logic, and 12345ABCDEWXYZ
Once a year, I review the market outlook signals as if they were a mechanical trading system, while pointing out issues and making adjustments. The goal is to give you to give you an example of how to analyze and continuously improve your own systems.
- 2015 Performance - Stock Market Outlook
- 2016 Performance - Stock Market Outlook
- 2017 Performance - Stock Market Outlook
- 2018 Performance - Stock Market Outlook
- 2019 Performance - Stock Market Outlook
- 2020 Performance - Stock Market Outlook
IMPORTANT DISCLOSURE INFORMATION
This material is for general communication and is provided for informational and/or educational purposes only. None of the content should be viewed as a suggestion that you take or refrain from taking any action nor as a recommendation for any specific investment product, strategy, or other such purpose. Certain information contained herein has been obtained from third-party sources believed to be reliable, but we cannot guarantee its accuracy or completeness.
To the extent that a reader has any questions regarding the applicability of any specific issue discussed above to his/her individual situation, he/she is encouraged to consult with the professional advisors of his/her choosing. Invest Safely, LLC is not a law firm, certified public accounting firm, or registered investment advisor and no portion of its content should be construed as legal, accounting, or investment advice.
The material is not to be construed as an offer or a recommendation to buy or sell a security nor is it to be construed as investment advice. Additionally, the material accessible through this website does not constitute a representation that the investments described herein are suitable or appropriate for any person.
Hypothetical Presentations:
Any referenced performance is “as calculated” using the referenced funds and has not been independently verified. This presentation does not discuss, directly or indirectly, the amount of the profits or losses, realized or unrealized, by any reader or contributor, from any specific funds or securities.
The author and/or any reader may have experienced materially different performance based upon various factors during the corresponding time periods. To the extent that any portion of the content reflects hypothetical results that were achieved by means of the retroactive application of a back-tested model, such results have inherent limitations, including:
Model results do not reflect the results of actual trading using assets, but were achieved by means of the retroactive application of the referenced models, certain aspects of which may have been designed with the benefit of hindsight
Back-tested performance may not reflect the impact that any material market or economic factors might have had on the use of a trading model if the model had been used during the period to actually manage assets
Actual investment results during the corresponding time periods may have been materially different from those portrayed in the model
Past performance may not be indicative of future results. Therefore, no one should assume that future performance will be profitable, or equal to any corresponding historical index.
The S&P 500 Composite Total Return Index (the "S&P") is a market capitalization-weighted index of 500 widely held stocks often used as a proxy for the stock market. Standard & Poor's chooses the member companies for the S&P based on market size, liquidity, and industry group representation. Included are the common stocks of industrial, financial, utility, and transportation companies. The S&P is not an index into which an investor can directly invest. The historical S&P performance results (and those of all other indices) are provided exclusively for comparison purposes only, so as to provide general comparative information to assist an individual in determining whether the performance of a specific portfolio or model meets, or continues to meet investment objective(s). The model and indices performance results do not reflect the impact of taxes.
Investing involves risk (even the “safe” kind)! Past performance does not guarantee or indicate future results. Different types of investments involve varying degrees of underlying risk. Therefore, do not assume that future performance of any specific investment or investment strategy be suitable for your portfolio or individual situation, will be profitable, equal any historical performance level(s), or prove successful (including the investments and/or investment strategies describe on this site).
Investing Process Links
Stabilize- Organize your $$$
- Manage your $$$
Plan
- Why You Invest
- Ways to Invest
- Where to Invest
- What to Invest In
Execute
- When to Invest
- How Much to Invest
- Buying & Selling
Monitor
- Track The Market
- Track Your Returns
Reflect & Adjust
- Improve Your Returns
- Adjust your Holdings
Popular Pages
- Jim Cramer- Personal Incomes Statements
- Hyperinflation
- Calculating Beta
- SMART Financial Goals
Blogroll
- Advisor Perspectives- Dividend Growth Investor
- Elliott Wave Lives On
- On My Radar | CMG Wealth
- Sure Dividend
- The Big Picture
- The Fat Pitch
- Thoughts from the Frontline
- Trader Feed
Sponsored Links
Invest Safely provides valuable, time-saving info about personal finance, money management, and investing.


