Stock Market Outlook
For The Week Of June 2nd =
Uptrend
INDICATORS
-
ADX Directional Indicators: Downtrend
Price & Volume Action: Uptrend
On Balance Volume Indicator: Uptrend
The S&P500 ($SPX) was down 0.5% last week. The index closed ~2% above the 50-day moving average and ~9% above the 200-day moving average.
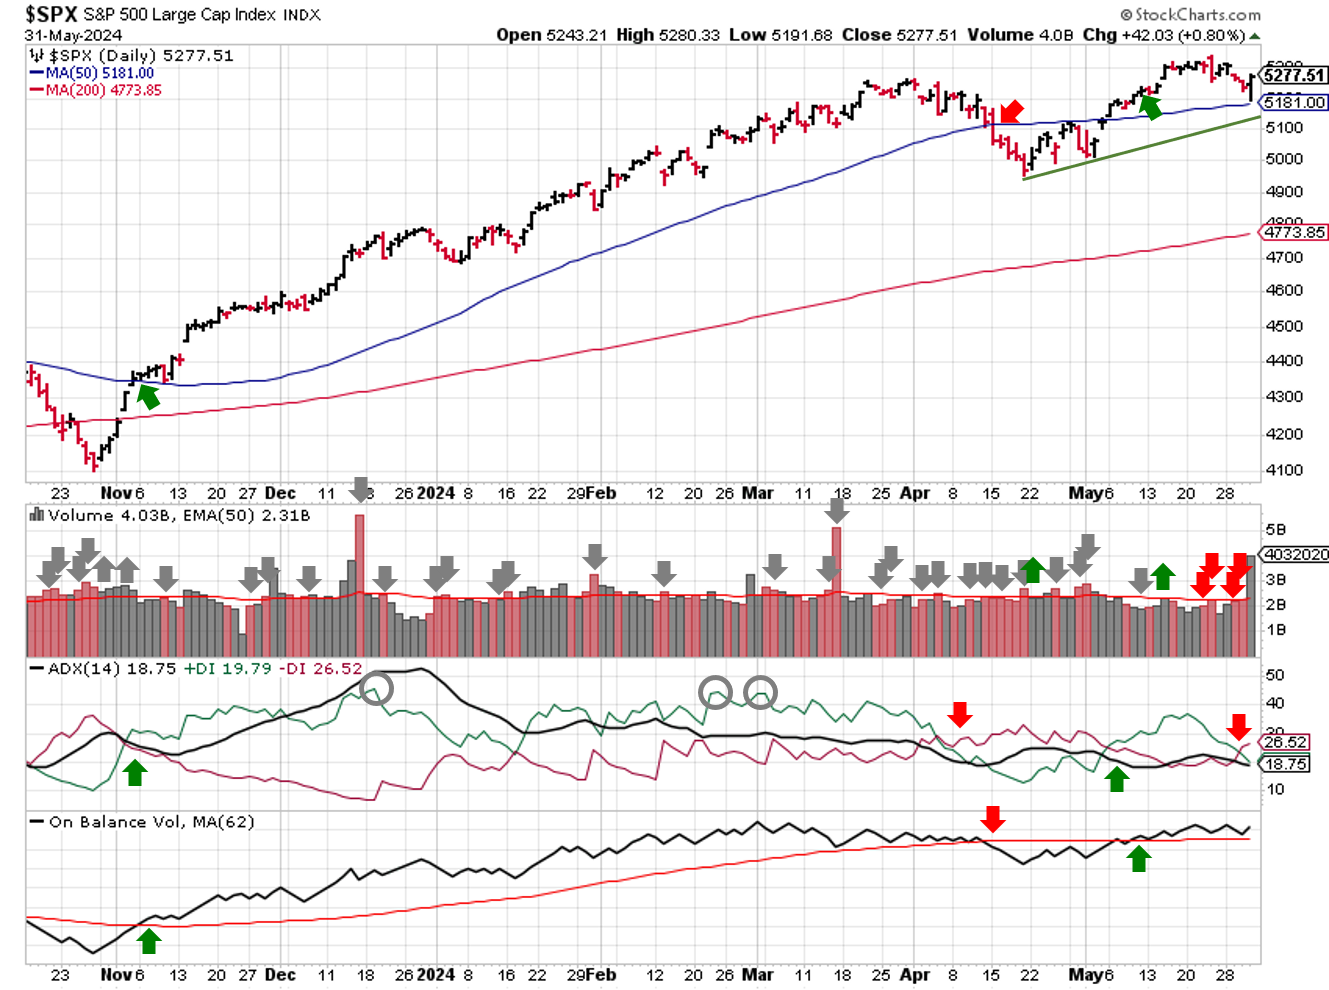
SPX Technical Analysis - June 02 2024
ADX flipped to bearish on Thursday, and OBV stays bullish.
Institutional activity was mixed last week, but remains bullish overall. Market makers sold mid-week (2 more distribution days for a total of 4), then bought substantially at the 50-day moving average on Friday.
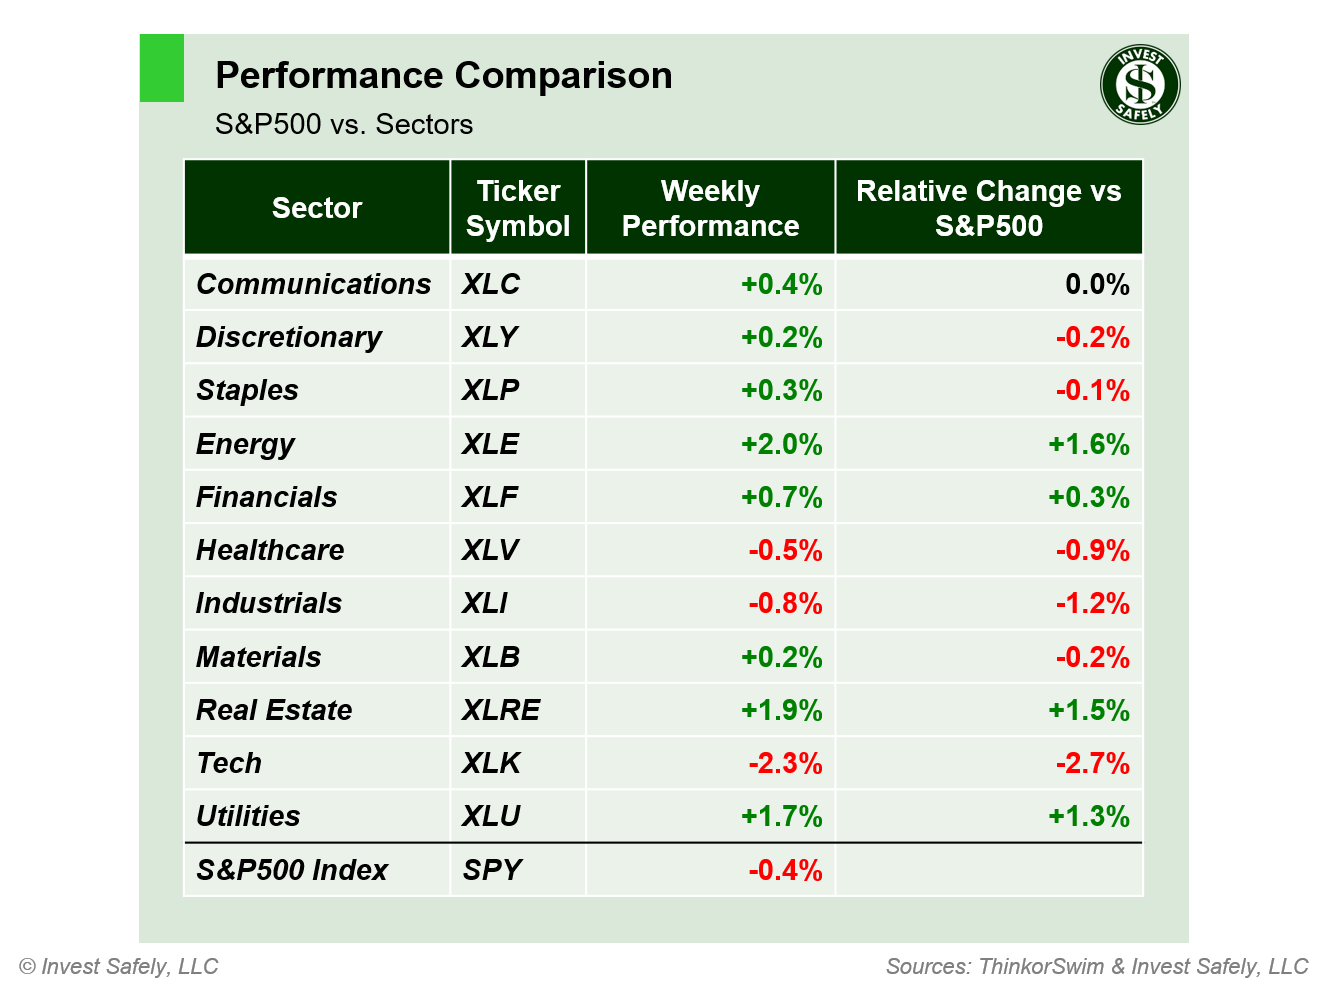
Although a majority of sectors ended the week in positive territory, large capitalization stocks like Microsoft ($MSFT) counteracted those gains in the broader index. Technology ($XLK) dropped 2.3%, while the Energy ($XLE) rebounded from its recent losing streak and finished 2% higher.
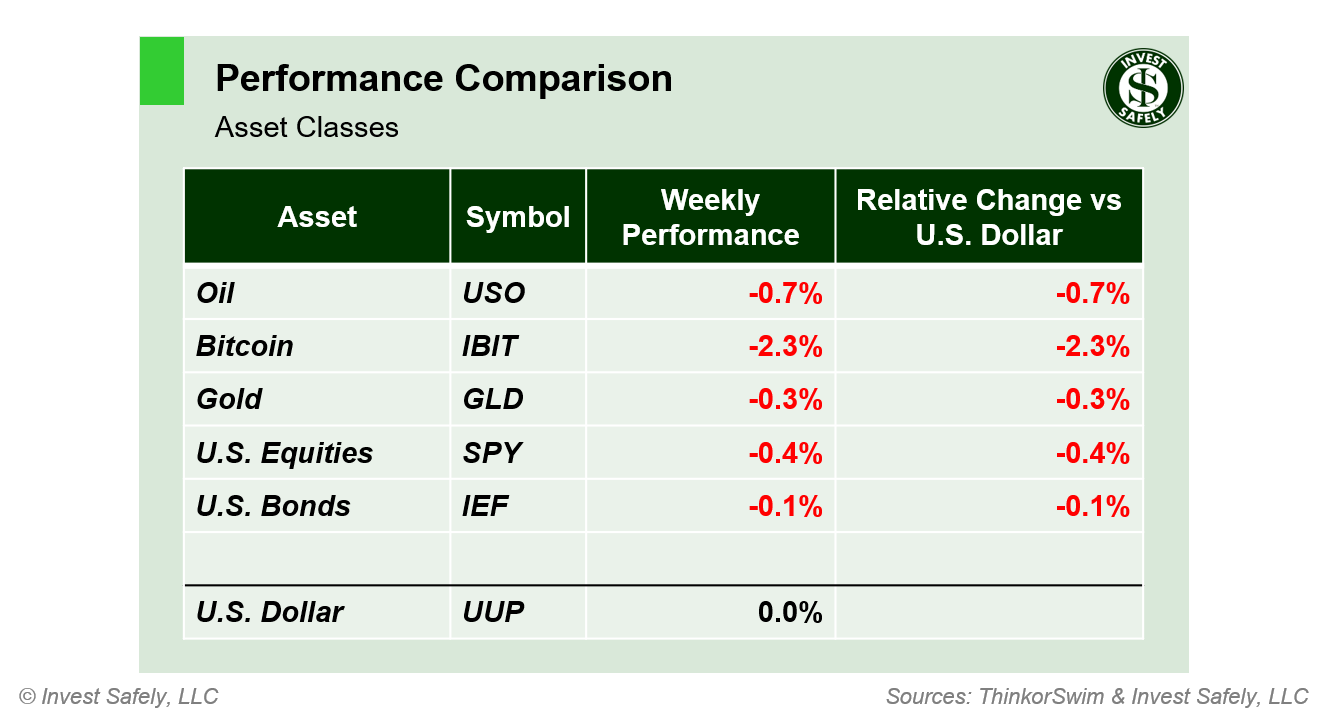
Across asset classes, it was a case of "least bad", with each one registering a loss last week. Bonds suffered the least damage, down 0.10%, while Bitcoin fell 2.3%.
COMMENTARY
The second estimate for Q1 GDP came in at 1.3%, which is 0.3% below the first estimate of 1.6% and well below Q4 GDP at 3.4%. Consumer spending slowed more than initial estimates, for both good and services, while government spending was revised slightly higher. Inflation remains sticky, with PCE showing no additional reductions in April.
| PCE (y/y) | Actual | Prior | Expected |
| Headline | +2.7% | +2.7% | +2.7% |
| Core | +2.8% | +2.8% | +2.8% |
Weaker growth and sticky inflation will put even more pressure on interest rate policy, as any move to improve one will hurt the other. Rates resumed their rising trend over the past two weeks, making any kind of spending or stimulus even more expensive. On the equity side, sector performance and institutional activity gives the impression of rotation and re-balancing, rather than any kind of reduction in exposure to equities.
And if Friday proved anything, it's that this isn't your father's stock market. After a brief rise at the open, the $SPX sold off during the morning, losing roughly 1% by mid-session. But once the index closed in on the 50-day moving average, buyers stepped in and pushed prices up roughly 0.5%. Turns out that was just a warm-up. In the final 30 minutes of trading, the S&P500 rallied almost 1%. Not 1 stock. Not the Magnificent 7. The entire index of 505 tickers, representing 500 companies and ~44 trillion dollars of market cap.

Source: Google.com
Let it serve as a reminder about the nature of today's financial markets. Corporate financials (corporate revenue, earnings, debt) had nothing to do with the move. Nothing. No macroeconomic data (i.e. GDP, CPI) or fundamental research on Apple, Microsoft or Tesla would've prepared you to take a position. Instead, market makers had an imbalance of some kind, and needed to buy equities at whatever price was available before the market closed...at a rate of ~15 Billion dollars per minute.
This week, the market will digest May ISM manufacturing and services PMI data, as well as jobs-related data (April JOLTS and May Non-Farm Payrolls)
Best to Your Week!
P.S. If you find this research helpful, please tell a friend.
If you don't, tell an enemy.
Sources: Bloomberg, CNBC, Federal Reserve Bank of St. Louis, Hedgeye, U.S. Bureau of Economic Analysis, U.S. Bureau of Labor Statistics
Share this Post on:

How to Make Money in Stocks: A Winning System in Good Times and Bad.
It's one of my favorites.
I regularly share articles and other news of interest on:
Twitter (@investsafely)
Facebook (@InvestSafely)
LinkedIn (@Invest-Safely)
Instagram (@investsafely)
Invest Safely, LLC is an independent investment research and online financial media company. Use of Invest Safely, LLC and any other products available through invest-safely.com is subject to our Terms of Service and Privacy Policy. Not a recommendation to buy or sell any security.
Charts provided courtesy of stockcharts.com.
For historical Elliott Wave commentary and analysis, go to ELLIOTT WAVE lives on by Tony Caldaro. Current counts can be found at: Pretzel Logic, and 12345ABCDEWXYZ
Once a year, I review the market outlook signals as if they were a mechanical trading system, while pointing out issues and making adjustments. The goal is to give you to give you an example of how to analyze and continuously improve your own systems.
- 2015 Performance - Stock Market Outlook
- 2016 Performance - Stock Market Outlook
- 2017 Performance - Stock Market Outlook
- 2018 Performance - Stock Market Outlook
- 2019 Performance - Stock Market Outlook
- 2020 Performance - Stock Market Outlook
IMPORTANT DISCLOSURE INFORMATION
This material is for general communication and is provided for informational and/or educational purposes only. None of the content should be viewed as a suggestion that you take or refrain from taking any action nor as a recommendation for any specific investment product, strategy, or other such purpose. Certain information contained herein has been obtained from third-party sources believed to be reliable, but we cannot guarantee its accuracy or completeness.
To the extent that a reader has any questions regarding the applicability of any specific issue discussed above to his/her individual situation, he/she is encouraged to consult with the professional advisors of his/her choosing. Invest Safely, LLC is not a law firm, certified public accounting firm, or registered investment advisor and no portion of its content should be construed as legal, accounting, or investment advice.
The material is not to be construed as an offer or a recommendation to buy or sell a security nor is it to be construed as investment advice. Additionally, the material accessible through this website does not constitute a representation that the investments described herein are suitable or appropriate for any person.
Hypothetical Presentations:
Any referenced performance is “as calculated” using the referenced funds and has not been independently verified. This presentation does not discuss, directly or indirectly, the amount of the profits or losses, realized or unrealized, by any reader or contributor, from any specific funds or securities.
The author and/or any reader may have experienced materially different performance based upon various factors during the corresponding time periods. To the extent that any portion of the content reflects hypothetical results that were achieved by means of the retroactive application of a back-tested model, such results have inherent limitations, including:
Model results do not reflect the results of actual trading using assets, but were achieved by means of the retroactive application of the referenced models, certain aspects of which may have been designed with the benefit of hindsight
Back-tested performance may not reflect the impact that any material market or economic factors might have had on the use of a trading model if the model had been used during the period to actually manage assets
Actual investment results during the corresponding time periods may have been materially different from those portrayed in the model
Past performance may not be indicative of future results. Therefore, no one should assume that future performance will be profitable, or equal to any corresponding historical index.
The S&P 500 Composite Total Return Index (the "S&P") is a market capitalization-weighted index of 500 widely held stocks often used as a proxy for the stock market. Standard & Poor's chooses the member companies for the S&P based on market size, liquidity, and industry group representation. Included are the common stocks of industrial, financial, utility, and transportation companies. The S&P is not an index into which an investor can directly invest. The historical S&P performance results (and those of all other indices) are provided exclusively for comparison purposes only, so as to provide general comparative information to assist an individual in determining whether the performance of a specific portfolio or model meets, or continues to meet investment objective(s). The model and indices performance results do not reflect the impact of taxes.
Investing involves risk (even the “safe” kind)! Past performance does not guarantee or indicate future results. Different types of investments involve varying degrees of underlying risk. Therefore, do not assume that future performance of any specific investment or investment strategy be suitable for your portfolio or individual situation, will be profitable, equal any historical performance level(s), or prove successful (including the investments and/or investment strategies describe on this site).
Investing Process Links
Stabilize- Organize your $$$
- Manage your $$$
Plan
- Why You Invest
- Ways to Invest
- Where to Invest
- What to Invest In
Execute
- When to Invest
- How Much to Invest
- Buying & Selling
Monitor
- Track The Market
- Track Your Returns
Reflect & Adjust
- Improve Your Returns
- Adjust your Holdings
Popular Pages
- Jim Cramer- Personal Incomes Statements
- Hyperinflation
- Calculating Beta
- SMART Financial Goals
Blogroll
- Advisor Perspectives- Dividend Growth Investor
- Elliott Wave Lives On
- On My Radar | CMG Wealth
- Sure Dividend
- The Big Picture
- The Fat Pitch
- Thoughts from the Frontline
- Trader Feed
Sponsored Links
Invest Safely provides valuable, time-saving info about personal finance, money management, and investing.


