Stock Market Outlook
For The Week Of March 14th =
Uptrend
INDICATORS
-
ADX Directional Indicators: Downtrend
Price & Volume Action: Mixed
On Balance Volume Indicator: Mixed
The S&P500 ($SPX) dropped 1.6% last week, unable to re-establish the trend line and dropping to the 50-day moving average. The index still sits ~10% above the 200-day moving average.
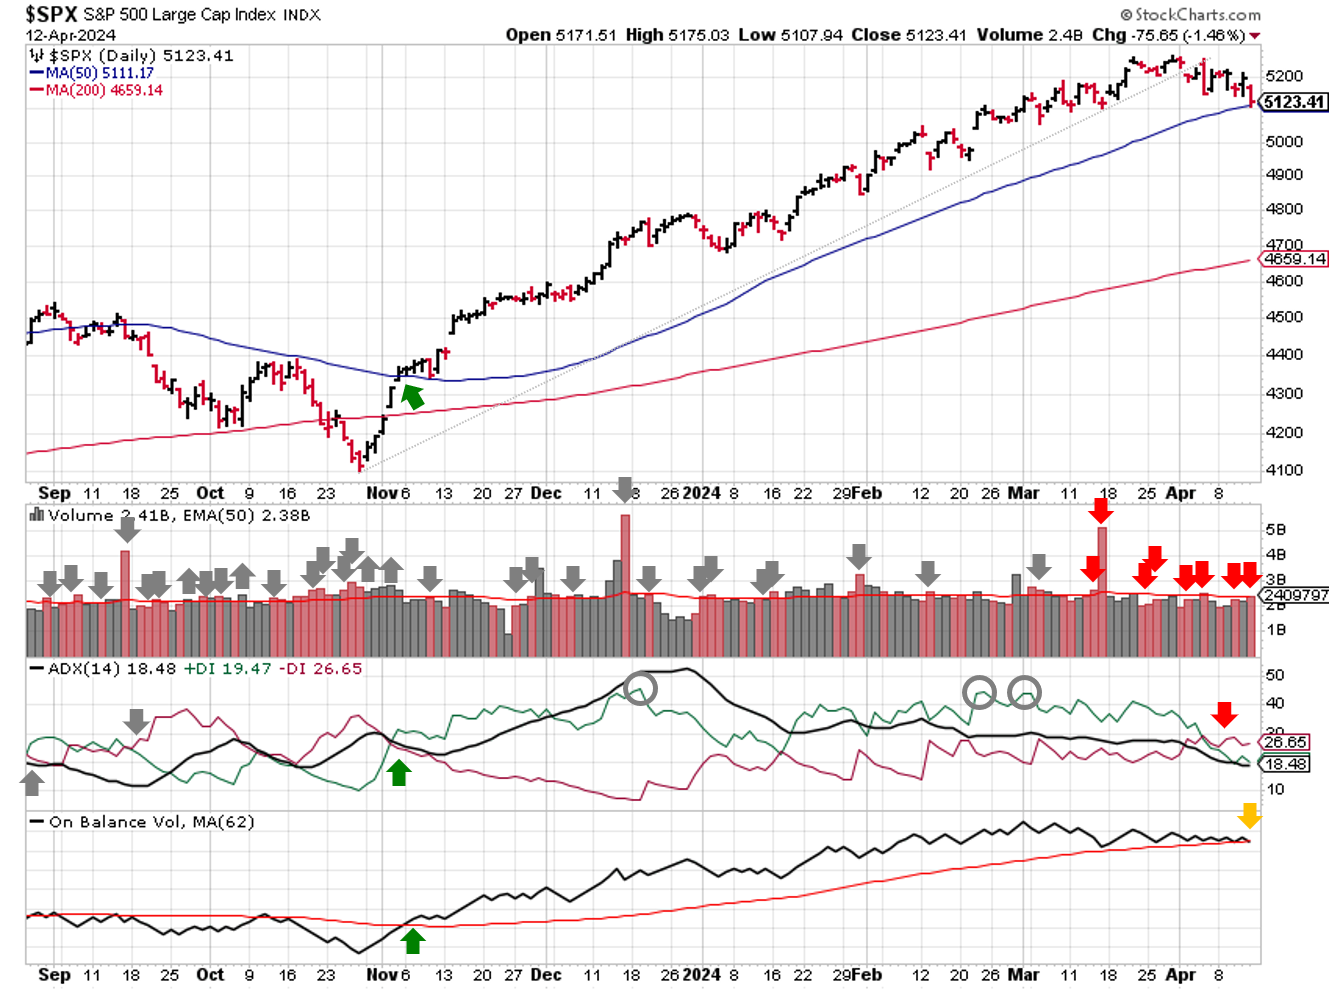
SPX Technical Analysis entering the Week of Apr 142024
After a borderline crossover the week prior, the ADX confirmed a downtrend signal last Tuesday. It's a similar set-up for On-Balance Volume this week, thanks to a marginal crossover on Friday, so the signal moves to mixed while we look for confirmation early this week.
Institutional selling increased, hitting 8 distribution days within the past 5 weeks, which is above the threshold for a correction. For now, the price/volume signal shifts to mixed, while we wait to see if the index finds support at the 50-day moving average.
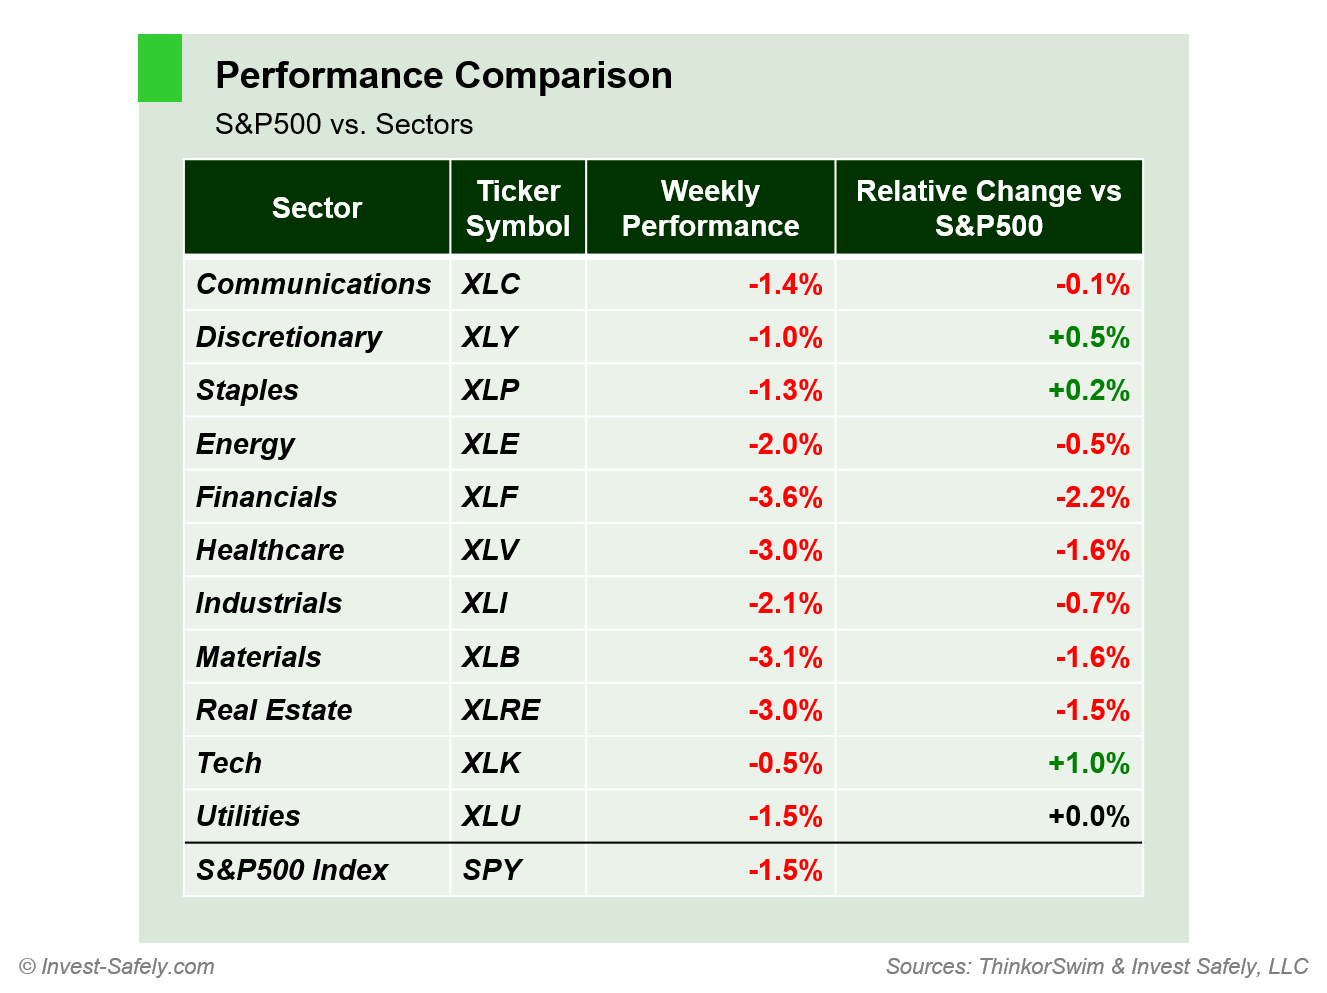
S&P Sector Performance for Week 15of 2024
Every major equity sector in the S&P registered a loss last week. Relative to the index, Technology ($XLK) outperformed by 1%, while Financials ($XLF) dropped an additional ~2%. Gold was the best asset class, rising almost 1%, although all 5 underperformed versus the U.S. dollar. You'd have to dig a bit more into precious metals to find real outperformance (i.e. Palladium, Platinum, Silver).
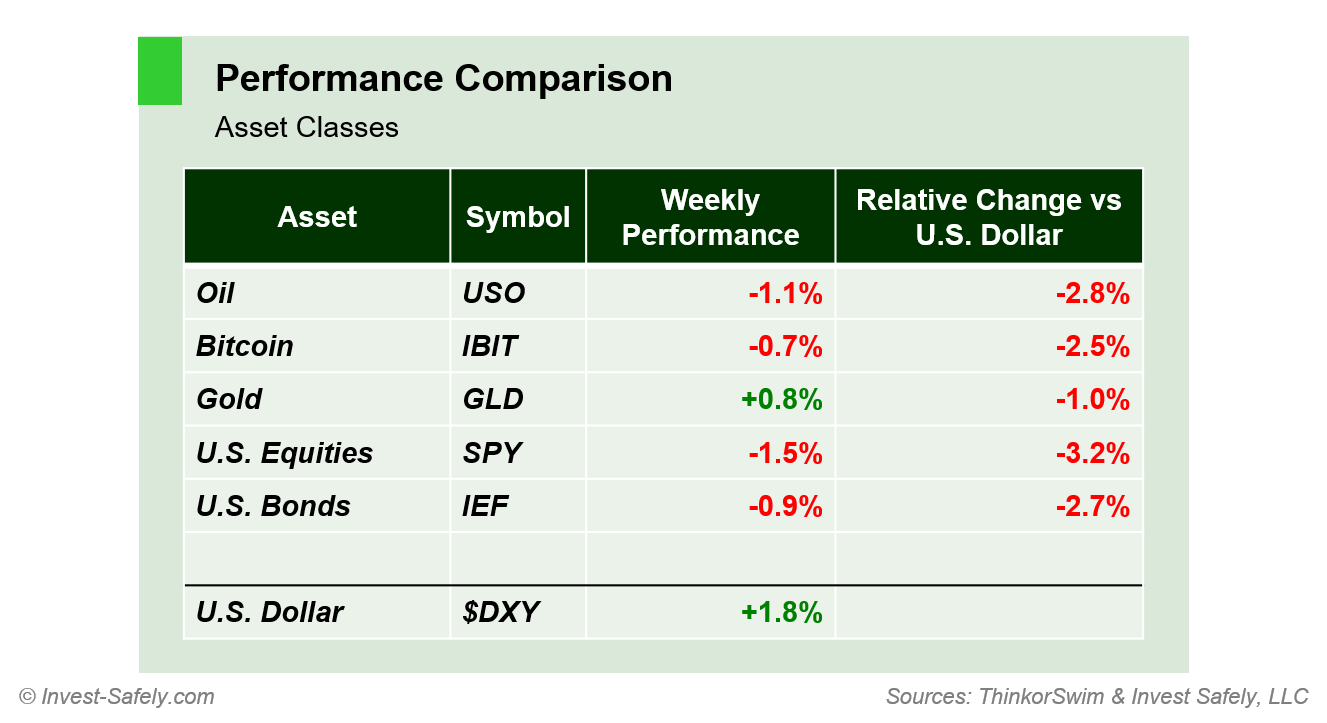
Asset Class Performance for Week 15of 2024
COMMENTARY
Stocks have had an incredible run from late October, and the factors in play have changed. Given the recent weakness in equities, it's a good time to review your holdings and make adjustments (i.e. take profits and redeploy capital).
Inflation continues to be a concern for the Federal Reserve, producers, and consumers. The March FOMC minutes revealed that the U.S. central bank that wouldn't commit to rate cuts, out of concern that inflation remains elevated from their targets. The release of the latest CPI and PPI data validates those worries.
March CPI was higher than expected, with the recent surge in oil and other commodities working its way through supply chains to the consumer.
| CPI(y/y) | Actual | Prior | Expected |
| Headline | +3.5% | +3.2% | +3.4% |
| Core | +3.8% | +3.8% | +3.7% |
On the producer side, Core PPI was the main story. Even after an upward revision to February data, March came in higher still, and that's without food and energy costs.
| PPI(y/y) | Actual | Prior | Expected |
| Headline | +2.1% | +1.6% | +2.2% |
| Core | +2.4% | +2.1% | +2.3% |
In response to March inflation readings, the probability of a rate cut moved further into the future. Last month, the odds of a rate cut in June fell to 50/50, as measured by the CME Group's 30-Day Fed Fund futures prices. As of today, probability of a rate cut in June is less than 30%, and July is 50/50.
Earnings season kicked off last week with big banks (JPMorgan Chase, CitiGroup, and Wells Fargo) beating expectations. This week the announcements really get going:
— Earnings Whispers (@eWhispers) April 12, 2024
Earnings for the week of April 15, 2024
$NFLX $TSM $BAC $GS $UNH $ASML $JNJ $UAL $AXP $MS $ISRG $PG $SCHW $ABT $AA $NOK $SLB $LVS $SKIL $PLD $BK $MTB $KMI $IBKR $TRV $JBHT $BX $DFS $KEY $USB $PNC $PPG $GNTY $DHI $CSX $ELV $FBK $ALK $SSLG $TCBI $WIT…
Best to Your Week!
P.S. If you find this research helpful, please tell a friend.
If you don't, tell an enemy.
Sources: Bloomberg, CNBC, Federal Reserve Bank of St. Louis, Hedgeye, U.S. Bureau of Economic Analysis, U.S. Bureau of Labor Statistics
Share this Post on:

How to Make Money in Stocks: A Winning System in Good Times and Bad.
It's one of my favorites.
I regularly share articles and other news of interest on:
Twitter (@investsafely)
Facebook (@InvestSafely)
LinkedIn (@Invest-Safely)
Instagram (@investsafely)
Invest Safely, LLC is an independent investment research and online financial media company. Use of Invest Safely, LLC and any other products available through invest-safely.com is subject to our Terms of Service and Privacy Policy. Not a recommendation to buy or sell any security.
Charts provided courtesy of stockcharts.com.
For historical Elliott Wave commentary and analysis, go to ELLIOTT WAVE lives on by Tony Caldaro. Current counts can be found at: Pretzel Logic, and 12345ABCDEWXYZ
Once a year, I review the market outlook signals as if they were a mechanical trading system, while pointing out issues and making adjustments. The goal is to give you to give you an example of how to analyze and continuously improve your own systems.
- 2015 Performance - Stock Market Outlook
- 2016 Performance - Stock Market Outlook
- 2017 Performance - Stock Market Outlook
- 2018 Performance - Stock Market Outlook
- 2019 Performance - Stock Market Outlook
- 2020 Performance - Stock Market Outlook
IMPORTANT DISCLOSURE INFORMATION
This material is for general communication and is provided for informational and/or educational purposes only. None of the content should be viewed as a suggestion that you take or refrain from taking any action nor as a recommendation for any specific investment product, strategy, or other such purpose. Certain information contained herein has been obtained from third-party sources believed to be reliable, but we cannot guarantee its accuracy or completeness.
To the extent that a reader has any questions regarding the applicability of any specific issue discussed above to his/her individual situation, he/she is encouraged to consult with the professional advisors of his/her choosing. Invest Safely, LLC is not a law firm, certified public accounting firm, or registered investment advisor and no portion of its content should be construed as legal, accounting, or investment advice.
The material is not to be construed as an offer or a recommendation to buy or sell a security nor is it to be construed as investment advice. Additionally, the material accessible through this website does not constitute a representation that the investments described herein are suitable or appropriate for any person.
Hypothetical Presentations:
Any referenced performance is “as calculated” using the referenced funds and has not been independently verified. This presentation does not discuss, directly or indirectly, the amount of the profits or losses, realized or unrealized, by any reader or contributor, from any specific funds or securities.
The author and/or any reader may have experienced materially different performance based upon various factors during the corresponding time periods. To the extent that any portion of the content reflects hypothetical results that were achieved by means of the retroactive application of a back-tested model, such results have inherent limitations, including:
Model results do not reflect the results of actual trading using assets, but were achieved by means of the retroactive application of the referenced models, certain aspects of which may have been designed with the benefit of hindsight
Back-tested performance may not reflect the impact that any material market or economic factors might have had on the use of a trading model if the model had been used during the period to actually manage assets
Actual investment results during the corresponding time periods may have been materially different from those portrayed in the model
Past performance may not be indicative of future results. Therefore, no one should assume that future performance will be profitable, or equal to any corresponding historical index.
The S&P 500 Composite Total Return Index (the "S&P") is a market capitalization-weighted index of 500 widely held stocks often used as a proxy for the stock market. Standard & Poor's chooses the member companies for the S&P based on market size, liquidity, and industry group representation. Included are the common stocks of industrial, financial, utility, and transportation companies. The S&P is not an index into which an investor can directly invest. The historical S&P performance results (and those of all other indices) are provided exclusively for comparison purposes only, so as to provide general comparative information to assist an individual in determining whether the performance of a specific portfolio or model meets, or continues to meet investment objective(s). The model and indices performance results do not reflect the impact of taxes.
Investing involves risk (even the “safe” kind)! Past performance does not guarantee or indicate future results. Different types of investments involve varying degrees of underlying risk. Therefore, do not assume that future performance of any specific investment or investment strategy be suitable for your portfolio or individual situation, will be profitable, equal any historical performance level(s), or prove successful (including the investments and/or investment strategies describe on this site).
Investing Process Links
Stabilize- Organize your $$$
- Manage your $$$
Plan
- Why You Invest
- Ways to Invest
- Where to Invest
- What to Invest In
Execute
- When to Invest
- How Much to Invest
- Buying & Selling
Monitor
- Track The Market
- Track Your Returns
Reflect & Adjust
- Improve Your Returns
- Adjust your Holdings
Popular Pages
- Jim Cramer- Personal Incomes Statements
- Hyperinflation
- Calculating Beta
- SMART Financial Goals
Blogroll
- Advisor Perspectives- Dividend Growth Investor
- Elliott Wave Lives On
- On My Radar | CMG Wealth
- Sure Dividend
- The Big Picture
- The Fat Pitch
- Thoughts from the Frontline
- Trader Feed
Sponsored Links
Invest Safely provides valuable, time-saving info about personal finance, money management, and investing.


