Stock Market Outlook
For The Week Of October 8th = Downtrend
INDICATORS
-
ADX Directional Indicators: Downtrend
Price & Volume Action: Mixed
Elliott Wave Analysis: Mixed
The S&P500 ($SPX) rose 0.5% last week, after finding support at the 200-day moving average. As of Friday's close, the index was ~2.5% below the 50-day moving average, and ~2% above the 200 day moving average.
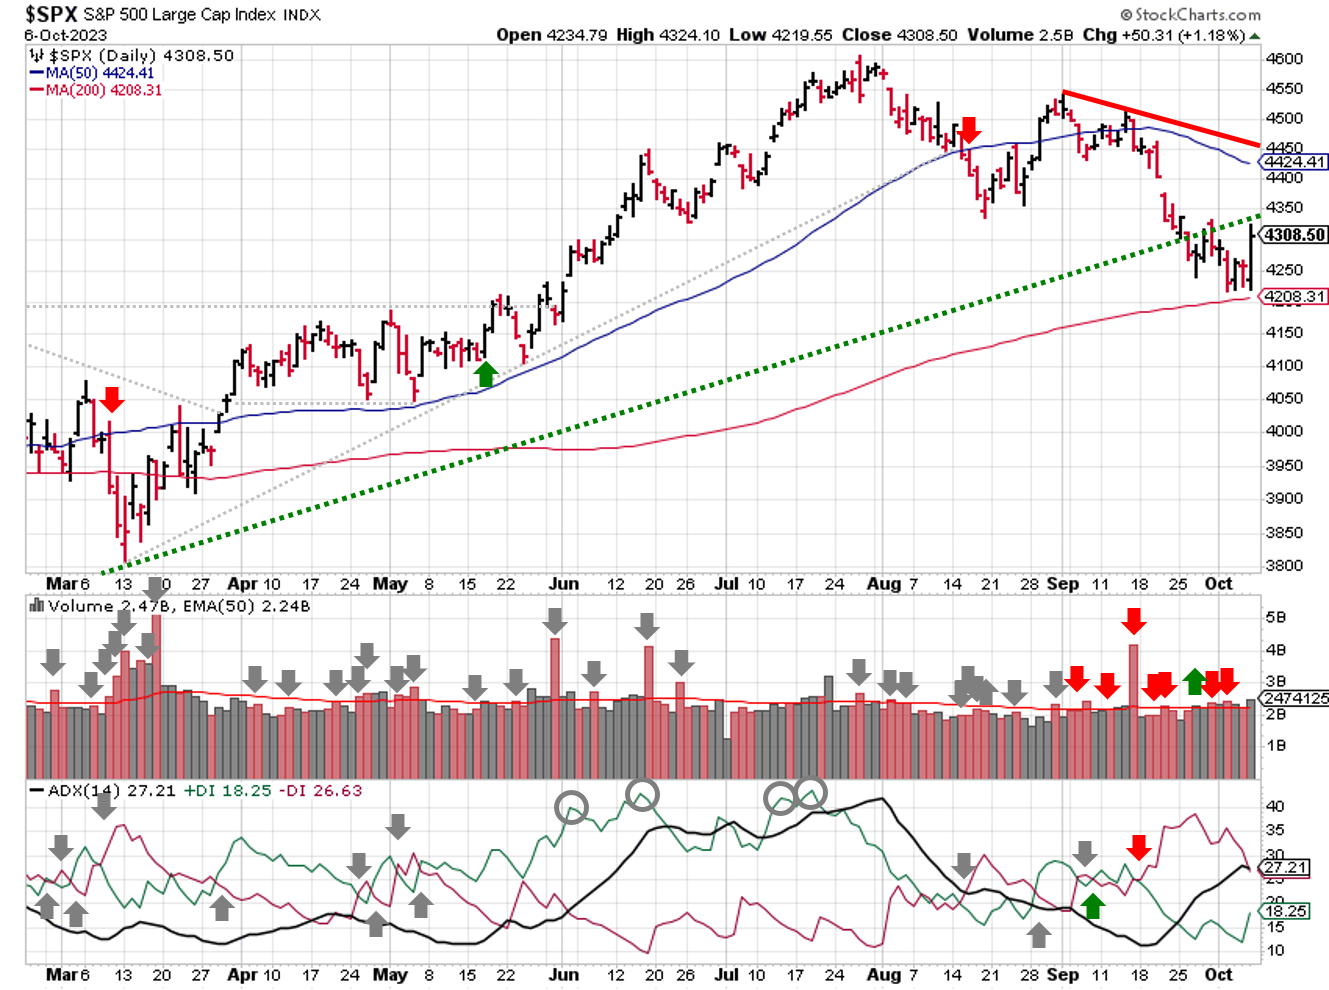
2023-10-08-SPX Trendline Analysis - Daily
The ADX directional indicators remain bearish.
Price/volume switched to mixed after a big up day on Friday, which came on Day 7 of the latest rally attempt. That said, the latest attempt isn't without issues, and those issues are why the signal's not an outright uptrend.
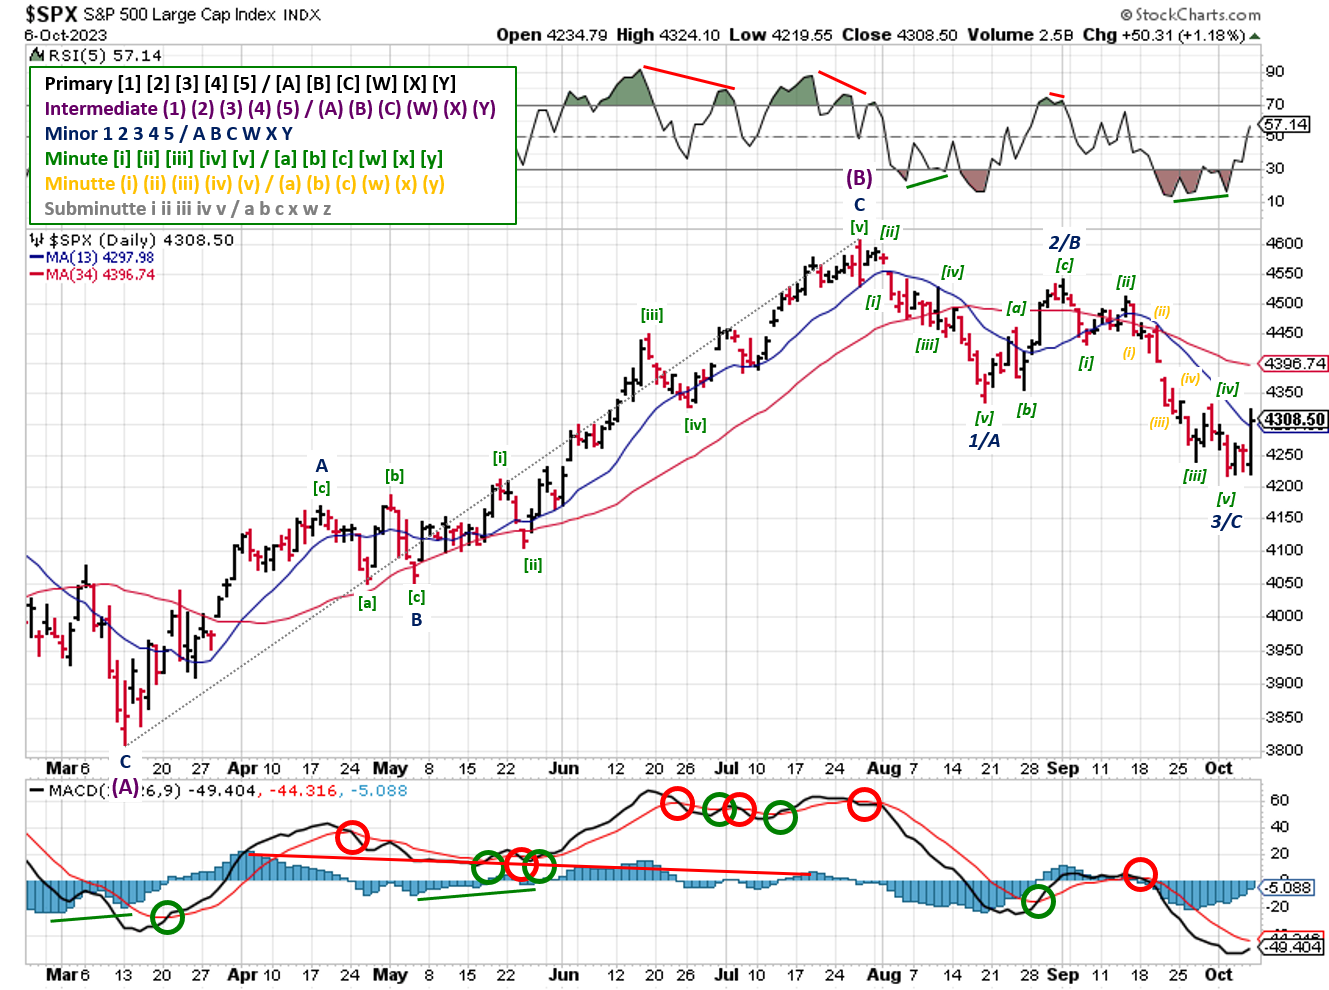
2023-10-08- SPX Elliott Wave Analysis - Daily - Primary Y (Bearish)
As noted above, the index remains below the 50-day moving average. Also, Tuesday's close was lower than the start point of the rally. Both of those data points make the price action favor a an oversold bounce, rather than the start of a new bull market. In either case, watch for follow-on strength or weakness in prices to confirm direction.
No change in Elliott Wave analysis, though the charts suggest the latest, downward wave has completed. However, the SPX's proximity to the August 18th low creates a bit of uncertainty in that statement, so more price action is needed.
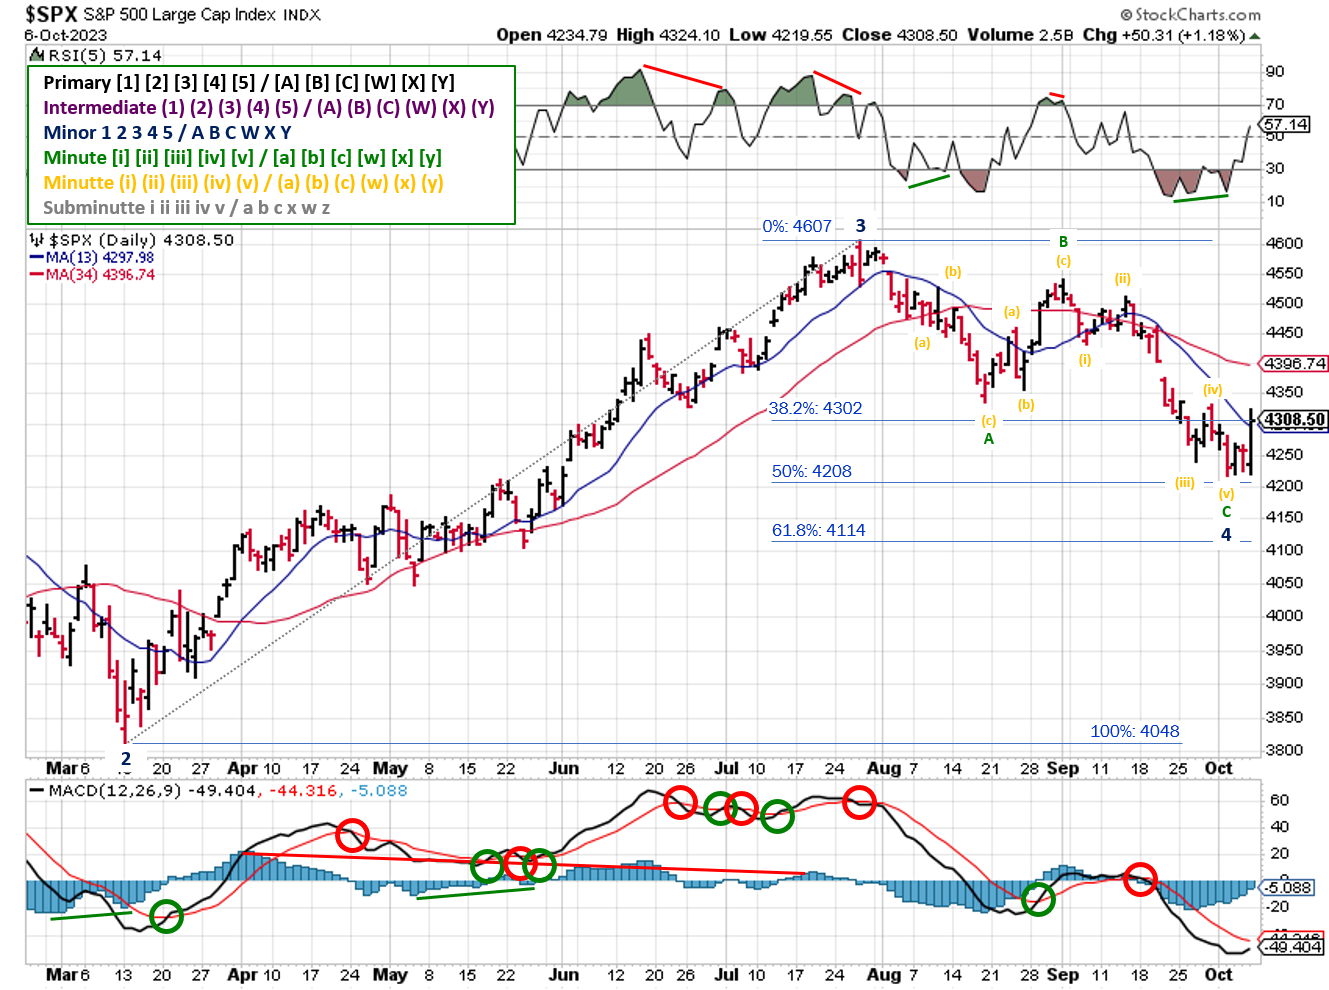
2023-10-08- SPX Elliott Wave Analysis - Daily - Primary 1 (Bullish)
Near-term resistance is the August 18th low (4335), and the support level is last week's low of 4216.
COMMENTARY
Discussing personal finance and investing seems surreal in light of the brutal start of a second ground war, this time in Israel. The geographic scope is limited today, but it's easy to imagine a much larger conflict unfolding, given the alliances within the region, which would impact global markets.
While I'm not an expert on Middle Eastern diplomacy, I am a student of history and geopolitics, with excellent reading comprehension skills. Most of the online commentary takes a page from the current "engage and enrage" playbook now prominent on social media. The loudest "voices" provide political finger pointing; weak attempts to blame political opponents or identify singular/simple causes. Real solutions won't come in the form of short-form soundbites or clever one-liners about whose at fault for what.
Back in the U.S., politicians struggle to find real solutions to simpler problems, with the legislative branch of government snatching defeat from the jaws of victory last week. After passing a stop-gap CR to fund the government for another 45 days, Republicans ousted the Speaker of the House. Passing another budget within 45 days was already a difficult task. Now, the House of Representatives must elect a new speaker AND THEN pass their version of a budget. Odds of that happening are low.
Last week's employment data was mixed heading into Friday's NFP release, with JOLTS showing higher job openings, but ADP showing lower payrolls versus expectations. Friday's Non-Farm Payroll data blew away estimates, which caught equity and bond markets off guard and lead to a very volatile trading session. The latest consumer price index (CPI) and producer price index (PPI) data is set for release this week, and major banks kick off Q3 earnings season.
Best to Your Week!
P.S. If you find this research helpful, please tell a friend.
If you don't, tell an enemy.
Sources: Bloomberg, CNBC, Federal Reserve Bank of St. Louis, Hedgeye, U.S. Bureau of Economic Analysis, U.S. Bureau of Labor Statistics
Share this Post on:

How to Make Money in Stocks: A Winning System in Good Times and Bad.
It's one of my favorites.
I regularly share articles and other news of interest on:
Twitter (@investsafely)
Facebook (@InvestSafely)
LinkedIn (@Invest-Safely)
Instagram (@investsafely)
Invest Safely, LLC is an independent investment research and online financial media company. Use of Invest Safely, LLC and any other products available through invest-safely.com is subject to our Terms of Service and Privacy Policy. Not a recommendation to buy or sell any security.
Charts provided courtesy of stockcharts.com.
For historical Elliott Wave commentary and analysis, go to ELLIOTT WAVE lives on by Tony Caldaro. Current counts can be found at: Pretzel Logic, and 12345ABCDEWXYZ
Once a year, I review the market outlook signals as if they were a mechanical trading system, while pointing out issues and making adjustments. The goal is to give you to give you an example of how to analyze and continuously improve your own systems.
- 2015 Performance - Stock Market Outlook
- 2016 Performance - Stock Market Outlook
- 2017 Performance - Stock Market Outlook
- 2018 Performance - Stock Market Outlook
- 2019 Performance - Stock Market Outlook
- 2020 Performance - Stock Market Outlook
IMPORTANT DISCLOSURE INFORMATION
This material is for general communication and is provided for informational and/or educational purposes only. None of the content should be viewed as a suggestion that you take or refrain from taking any action nor as a recommendation for any specific investment product, strategy, or other such purpose. Certain information contained herein has been obtained from third-party sources believed to be reliable, but we cannot guarantee its accuracy or completeness.
To the extent that a reader has any questions regarding the applicability of any specific issue discussed above to his/her individual situation, he/she is encouraged to consult with the professional advisors of his/her choosing. Invest Safely, LLC is not a law firm, certified public accounting firm, or registered investment advisor and no portion of its content should be construed as legal, accounting, or investment advice.
The material is not to be construed as an offer or a recommendation to buy or sell a security nor is it to be construed as investment advice. Additionally, the material accessible through this website does not constitute a representation that the investments described herein are suitable or appropriate for any person.
Hypothetical Presentations:
Any referenced performance is “as calculated” using the referenced funds and has not been independently verified. This presentation does not discuss, directly or indirectly, the amount of the profits or losses, realized or unrealized, by any reader or contributor, from any specific funds or securities.
The author and/or any reader may have experienced materially different performance based upon various factors during the corresponding time periods. To the extent that any portion of the content reflects hypothetical results that were achieved by means of the retroactive application of a back-tested model, such results have inherent limitations, including:
Model results do not reflect the results of actual trading using assets, but were achieved by means of the retroactive application of the referenced models, certain aspects of which may have been designed with the benefit of hindsight
Back-tested performance may not reflect the impact that any material market or economic factors might have had on the use of a trading model if the model had been used during the period to actually manage assets
Actual investment results during the corresponding time periods may have been materially different from those portrayed in the model
Past performance may not be indicative of future results. Therefore, no one should assume that future performance will be profitable, or equal to any corresponding historical index.
The S&P 500 Composite Total Return Index (the "S&P") is a market capitalization-weighted index of 500 widely held stocks often used as a proxy for the stock market. Standard & Poor's chooses the member companies for the S&P based on market size, liquidity, and industry group representation. Included are the common stocks of industrial, financial, utility, and transportation companies. The S&P is not an index into which an investor can directly invest. The historical S&P performance results (and those of all other indices) are provided exclusively for comparison purposes only, so as to provide general comparative information to assist an individual in determining whether the performance of a specific portfolio or model meets, or continues to meet investment objective(s). The model and indices performance results do not reflect the impact of taxes.
Investing involves risk (even the “safe” kind)! Past performance does not guarantee or indicate future results. Different types of investments involve varying degrees of underlying risk. Therefore, do not assume that future performance of any specific investment or investment strategy be suitable for your portfolio or individual situation, will be profitable, equal any historical performance level(s), or prove successful (including the investments and/or investment strategies describe on this site).
Investing Process Links
Stabilize- Organize your $$$
- Manage your $$$
Plan
- Why You Invest
- Ways to Invest
- Where to Invest
- What to Invest In
Execute
- When to Invest
- How Much to Invest
- Buying & Selling
Monitor
- Track The Market
- Track Your Returns
Reflect & Adjust
- Improve Your Returns
- Adjust your Holdings
Popular Pages
- Jim Cramer- Personal Incomes Statements
- Hyperinflation
- Calculating Beta
- SMART Financial Goals
Blogroll
- Advisor Perspectives- Dividend Growth Investor
- Elliott Wave Lives On
- On My Radar | CMG Wealth
- Sure Dividend
- The Big Picture
- The Fat Pitch
- Thoughts from the Frontline
- Trader Feed
Sponsored Links
Invest Safely provides valuable, time-saving info about personal finance, money management, and investing.


