Stock Market Outlook
For The Week Of May 21st = Uptrend
INDICATORS
-
ADX Directional Indicators: Uptrend
Price & Volume Action: Uptrend
Elliott Wave Analysis: Mixed
The S&P500 ($SPX) ended the week up 1.6%, after reaching a new high for the year at ~4213. Cycle to date (i.e. since the bear market began in January 2022), the index is:
- -13% since the cycle peak (Jan 2022)
- +20% from the cycle low (Oct 2022)
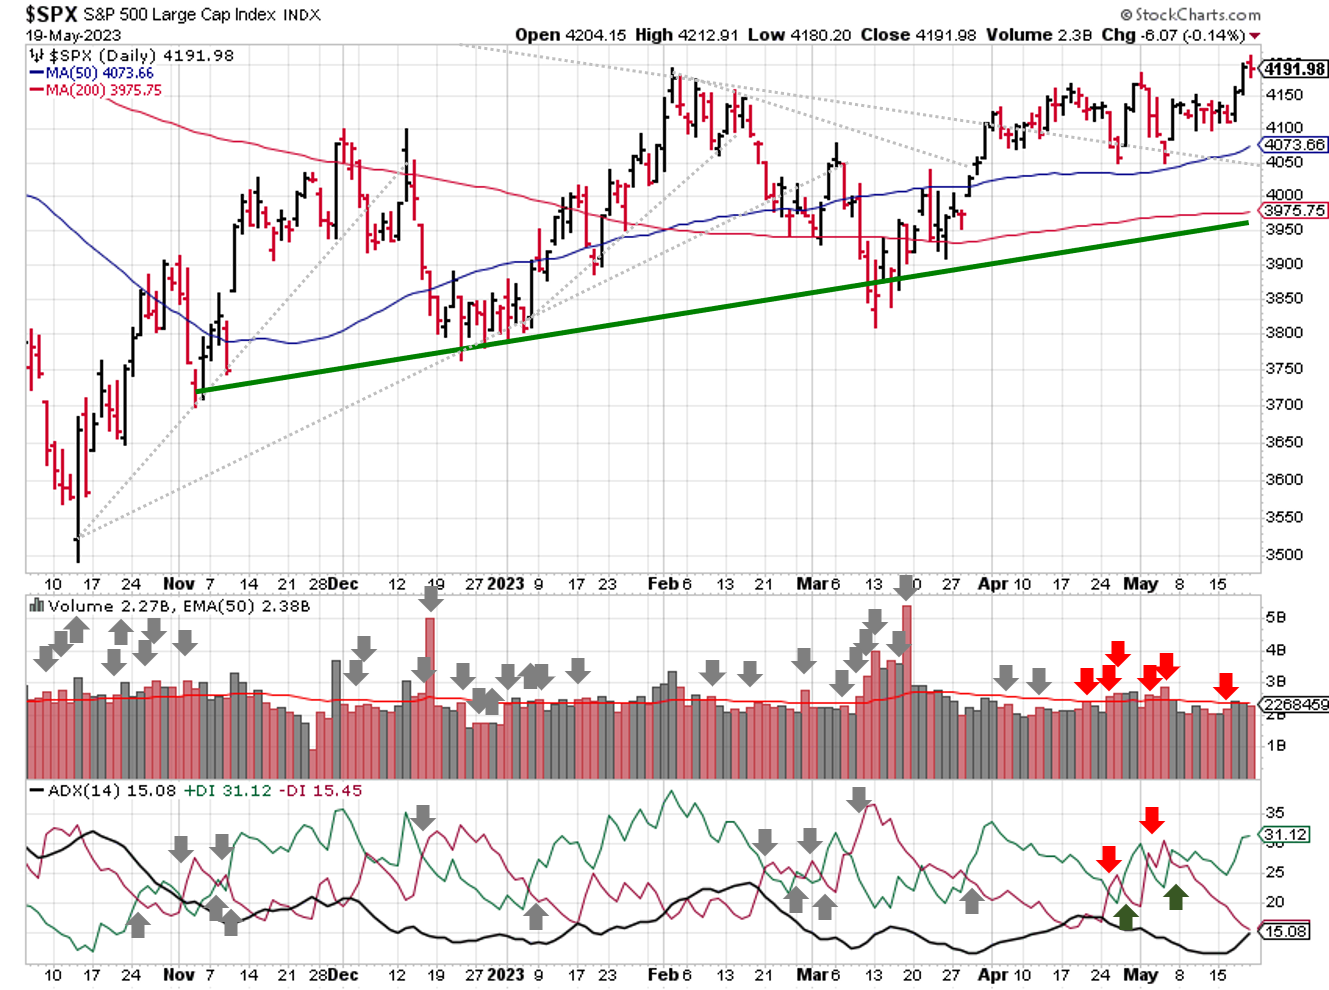
2023-05-21-SPX Trendline Analysis - Daily
The ADX is bullish to start the week, with some signs of strengthening trend from the main indicator. Don't read into that too much, since it's coming off cycle lows, as well as lows for the year, and hasn't surpassed April levels even though the index is higher (negative divergence).
Price/volume shifted to an uptrend thanks to Wednesday’s rally on "above-average" trading volume. The FFTY index continues to lag, struggling to move beyond the 50-day moving average.
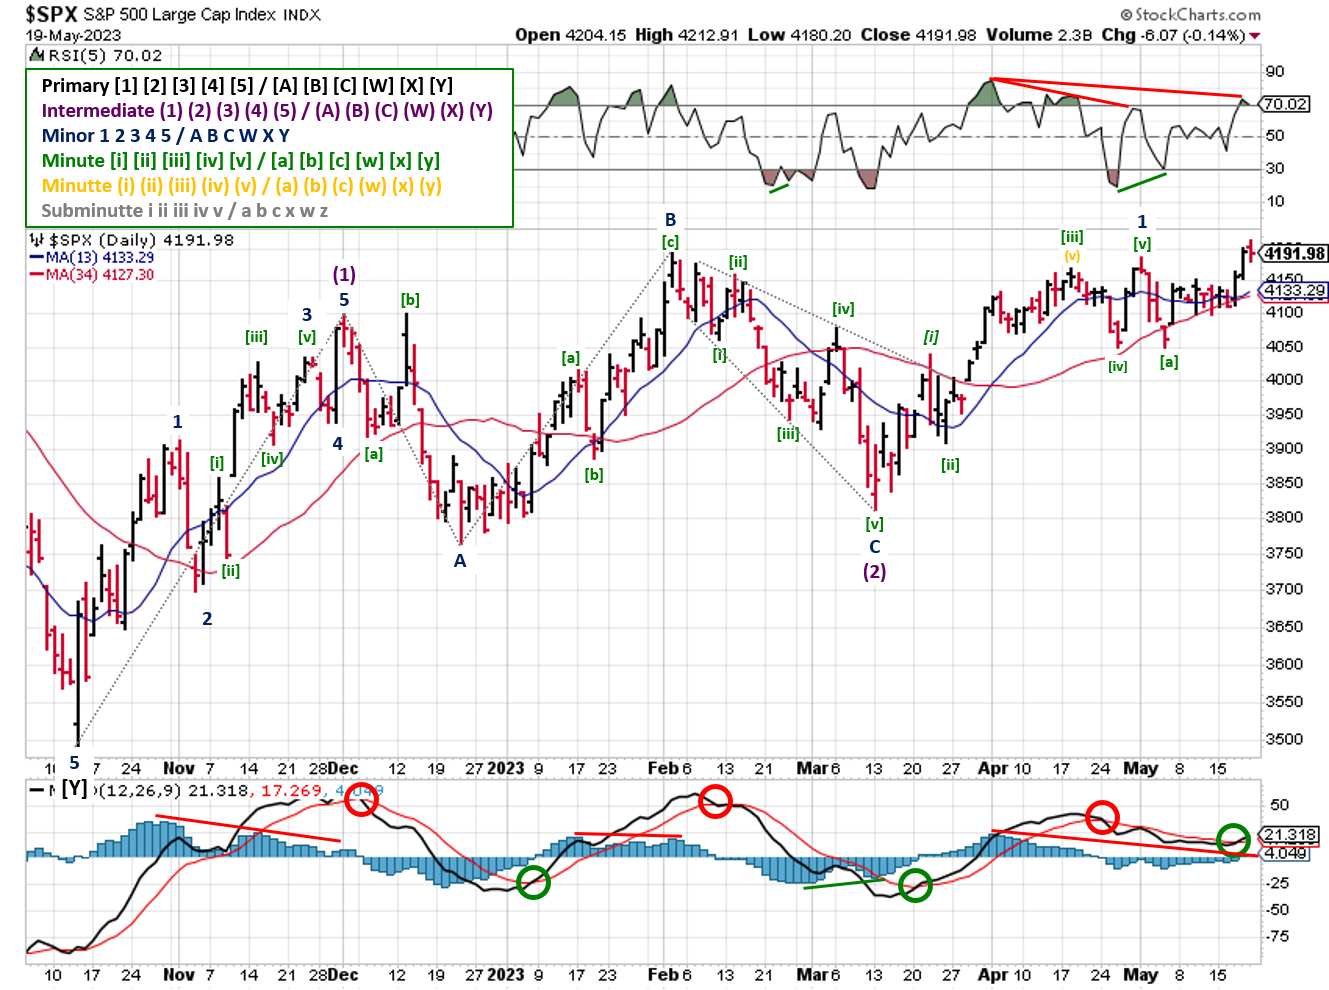
2023-05-21- SPX Elliott Wave Analysis - Daily - Primary 1 (Bullish)
Elliott Wave remains mixed, but not for lack of trading action. The SPX broke the 4196 resistance level by a few points, invalidating the prior bearish count. And the MACD shows a bullish cross-over occurred mid-week. That would typically be enough to shift the signal. However, the recent consolidation / wave extensions forced updates to both the bullish and bearish counts, and neither has an edge. Even without adjustments, there's a potential negative divergence in the MACD histogram despite the bullish cross-over, as well as the RSI(5). So the signal remains mixed.
COMMENTARY
The market signals FINALLY picked a side! Let's see how long it lasts. The biggest concern for the stock market outlook is the index itself; specifically increasing concentration risk (i.e. a few really big companies accounting for all of the price movement).
Looking at the performance of the FFTY index (50 best "innovation"/"growth" companies) reveals that companies leading the market higher aren't the typical "leading" stocks (i.e. small cap companies with cutting edge / innovative technology). This is mirrored in a general sense by the relative underperformance of a small cap index (i.e. Russell 2000) versus a large cap index (i.e. S&P500).
But even within large cap indexes like the S&P500, price action is driven by a handful of stocks, resulting from increasingly lopsided market cap weightings.
For instance, last week's gains were driven by stocks within the Technology ($XLK), Communications ($XLC), and Consumer Discretionary ($XLY) sectors.
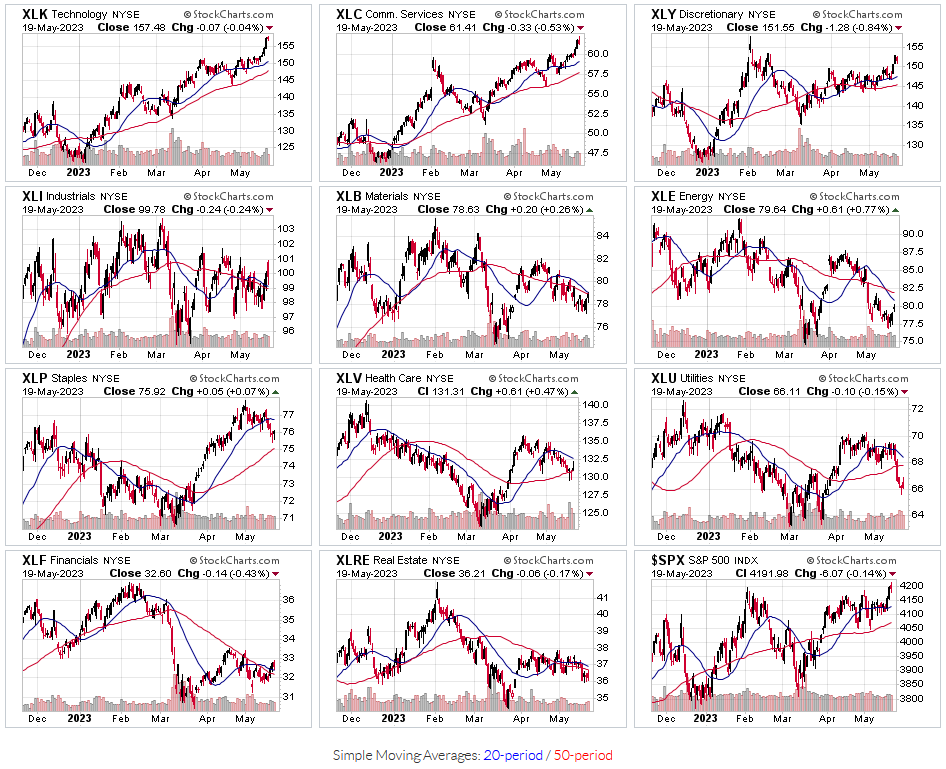
2023-05-21- SPX Sector ETFs
Per Hedgeye, the two largest market cap stocks (Apple & Microsoft) account for 14% of $SPX's weighting. Not to mention that Apple’s market capitalization is now greater than the entire Russell 2000 index!
And which sector is home to Apple and Microsoft? Technology ($XLK)...the best performer. In fact, 8 of the 10 largest companies in the $SPX drive performance in those 3 sectors:
- Technology ($XLK)
- Apple, Microsoft, & Nvidia ($AAPL, $MSFT, $NVDA)
- ~54% of the sector ETF
- Communications ($XLC)
- Google & Meta ($GOOG , $GOOGL, $META)
- ~51% of the sector ETF
- Consumer Discretionary ($XLY)
- Amazon & Tesla ($AMZN, $TSLA)
- ~40% of the sector ETF
Meanwhile the Energy ($XLE) and Industrial ($XLI) sectors have underperformed, price-wise, even though they've generated a majority of the $SPX earnings growth this year. Consumer discretionary is pulling it's own weight so far.
But technology and communications? They're firmly in an earnings contraction, and are where a majority of recent layoffs have been centered. Not exactly the "growth" engine you'd expect for a new bull market...
Best to Your Week!
P.S. If you find this research helpful, please tell a friend.
If you don't, tell an enemy.
Sources: Bloomberg, CNBC, Federal Reserve Bank of St. Louis, Hedgeye, U.S. Bureau of Economic Analysis, U.S. Bureau of Labor Statistics
Share this Post on:

How to Make Money in Stocks: A Winning System in Good Times and Bad.
It's one of my favorites.
I regularly share articles and other news of interest on:
Twitter (@investsafely)
Facebook (@InvestSafely)
LinkedIn (@Invest-Safely)
Instagram (@investsafely)
Invest Safely, LLC is an independent investment research and online financial media company. Use of Invest Safely, LLC and any other products available through invest-safely.com is subject to our Terms of Service and Privacy Policy. Not a recommendation to buy or sell any security.
Charts provided courtesy of stockcharts.com.
For historical Elliott Wave commentary and analysis, go to ELLIOTT WAVE lives on by Tony Caldaro. Current counts can be found at: Pretzel Logic, and 12345ABCDEWXYZ
Once a year, I review the market outlook signals as if they were a mechanical trading system, while pointing out issues and making adjustments. The goal is to give you to give you an example of how to analyze and continuously improve your own systems.
- 2015 Performance - Stock Market Outlook
- 2016 Performance - Stock Market Outlook
- 2017 Performance - Stock Market Outlook
- 2018 Performance - Stock Market Outlook
- 2019 Performance - Stock Market Outlook
- 2020 Performance - Stock Market Outlook
IMPORTANT DISCLOSURE INFORMATION
This material is for general communication and is provided for informational and/or educational purposes only. None of the content should be viewed as a suggestion that you take or refrain from taking any action nor as a recommendation for any specific investment product, strategy, or other such purpose. Certain information contained herein has been obtained from third-party sources believed to be reliable, but we cannot guarantee its accuracy or completeness.
To the extent that a reader has any questions regarding the applicability of any specific issue discussed above to his/her individual situation, he/she is encouraged to consult with the professional advisors of his/her choosing. Invest Safely, LLC is not a law firm, certified public accounting firm, or registered investment advisor and no portion of its content should be construed as legal, accounting, or investment advice.
The material is not to be construed as an offer or a recommendation to buy or sell a security nor is it to be construed as investment advice. Additionally, the material accessible through this website does not constitute a representation that the investments described herein are suitable or appropriate for any person.
Hypothetical Presentations:
Any referenced performance is “as calculated” using the referenced funds and has not been independently verified. This presentation does not discuss, directly or indirectly, the amount of the profits or losses, realized or unrealized, by any reader or contributor, from any specific funds or securities.
The author and/or any reader may have experienced materially different performance based upon various factors during the corresponding time periods. To the extent that any portion of the content reflects hypothetical results that were achieved by means of the retroactive application of a back-tested model, such results have inherent limitations, including:
Model results do not reflect the results of actual trading using assets, but were achieved by means of the retroactive application of the referenced models, certain aspects of which may have been designed with the benefit of hindsight
Back-tested performance may not reflect the impact that any material market or economic factors might have had on the use of a trading model if the model had been used during the period to actually manage assets
Actual investment results during the corresponding time periods may have been materially different from those portrayed in the model
Past performance may not be indicative of future results. Therefore, no one should assume that future performance will be profitable, or equal to any corresponding historical index.
The S&P 500 Composite Total Return Index (the "S&P") is a market capitalization-weighted index of 500 widely held stocks often used as a proxy for the stock market. Standard & Poor's chooses the member companies for the S&P based on market size, liquidity, and industry group representation. Included are the common stocks of industrial, financial, utility, and transportation companies. The S&P is not an index into which an investor can directly invest. The historical S&P performance results (and those of all other indices) are provided exclusively for comparison purposes only, so as to provide general comparative information to assist an individual in determining whether the performance of a specific portfolio or model meets, or continues to meet investment objective(s). The model and indices performance results do not reflect the impact of taxes.
Investing involves risk (even the “safe” kind)! Past performance does not guarantee or indicate future results. Different types of investments involve varying degrees of underlying risk. Therefore, do not assume that future performance of any specific investment or investment strategy be suitable for your portfolio or individual situation, will be profitable, equal any historical performance level(s), or prove successful (including the investments and/or investment strategies describe on this site).
Investing Process Links
Stabilize- Organize your $$$
- Manage your $$$
Plan
- Why You Invest
- Ways to Invest
- Where to Invest
- What to Invest In
Execute
- When to Invest
- How Much to Invest
- Buying & Selling
Monitor
- Track The Market
- Track Your Returns
Reflect & Adjust
- Improve Your Returns
- Adjust your Holdings
Popular Pages
- Jim Cramer- Personal Incomes Statements
- Hyperinflation
- Calculating Beta
- SMART Financial Goals
Blogroll
- Advisor Perspectives- Dividend Growth Investor
- Elliott Wave Lives On
- On My Radar | CMG Wealth
- Sure Dividend
- The Big Picture
- The Fat Pitch
- Thoughts from the Frontline
- Trader Feed
Sponsored Links
Invest Safely provides valuable, time-saving info about personal finance, money management, and investing.


