Stock Market Outlook
For The Week Of April 30th = Downtrend
INDICATORS
-
ADX Directional Indicators: Uptrend
Price & Volume Action: Mixed
Elliott Wave Analysis: Mixed
After some volatile sessions, the S&P500 ($SPX) ended the week with a gain of 0.9%. The index remains above the 50 and 200-day moving averages.
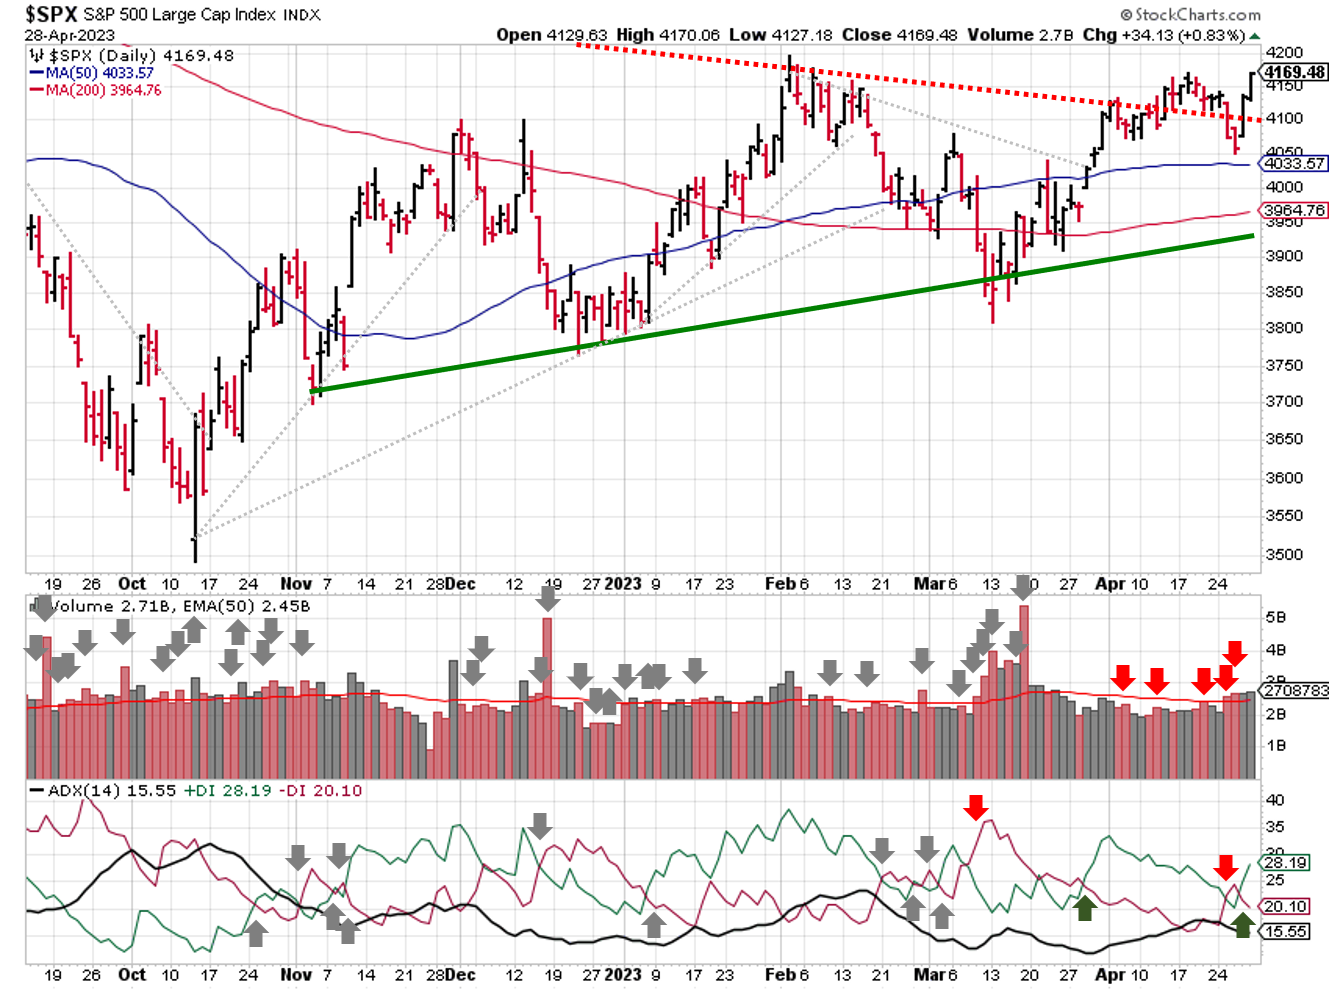
2023-04-30-SPX Trendline Analysis - Daily
ADX shows a bullish trend, although the direction indicators flipped during the week.
Price/volume remains mixed, despite last week's performance. Trading volume was above average last week (finally), showing that institutional traders were active participants. On the bullish side, the index remains above the 50-day moving average, and Thursday's action could be considered a follow-through day. On the bearish side, said rally attempt started back in mid-March, so the market's well outside the 4-10 day window.
When the technicals aren't clear, take a look below the surface at the behavior of innovative growth companies (i.e. “leading stocks”). The $FFTY serves as a proxy for market leadership, and it doesn't support a bullish narrative. That index remains rangebound, and still needs to break resistance at the 50-day moving average.
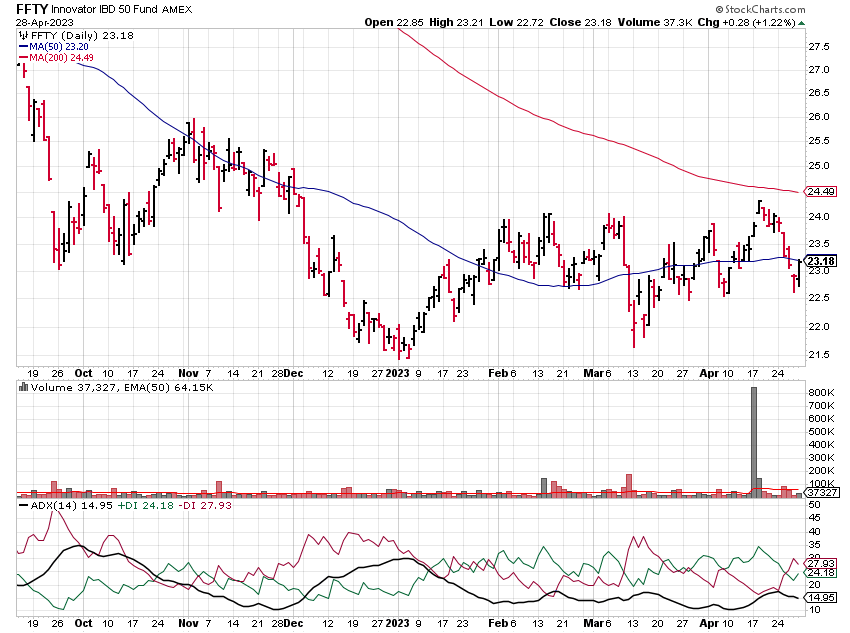
2023-04-30-FFTY Trendline Analysis - Daily
No change in Elliott Wave entering the week either, although the SPX is at an inflection point. Bearish technical indicators solidify the bearish count showing a completed Minor 2 on April 18. And the MACD crossed-over, confirming the RSI(5)’s bearish divergence during early April.
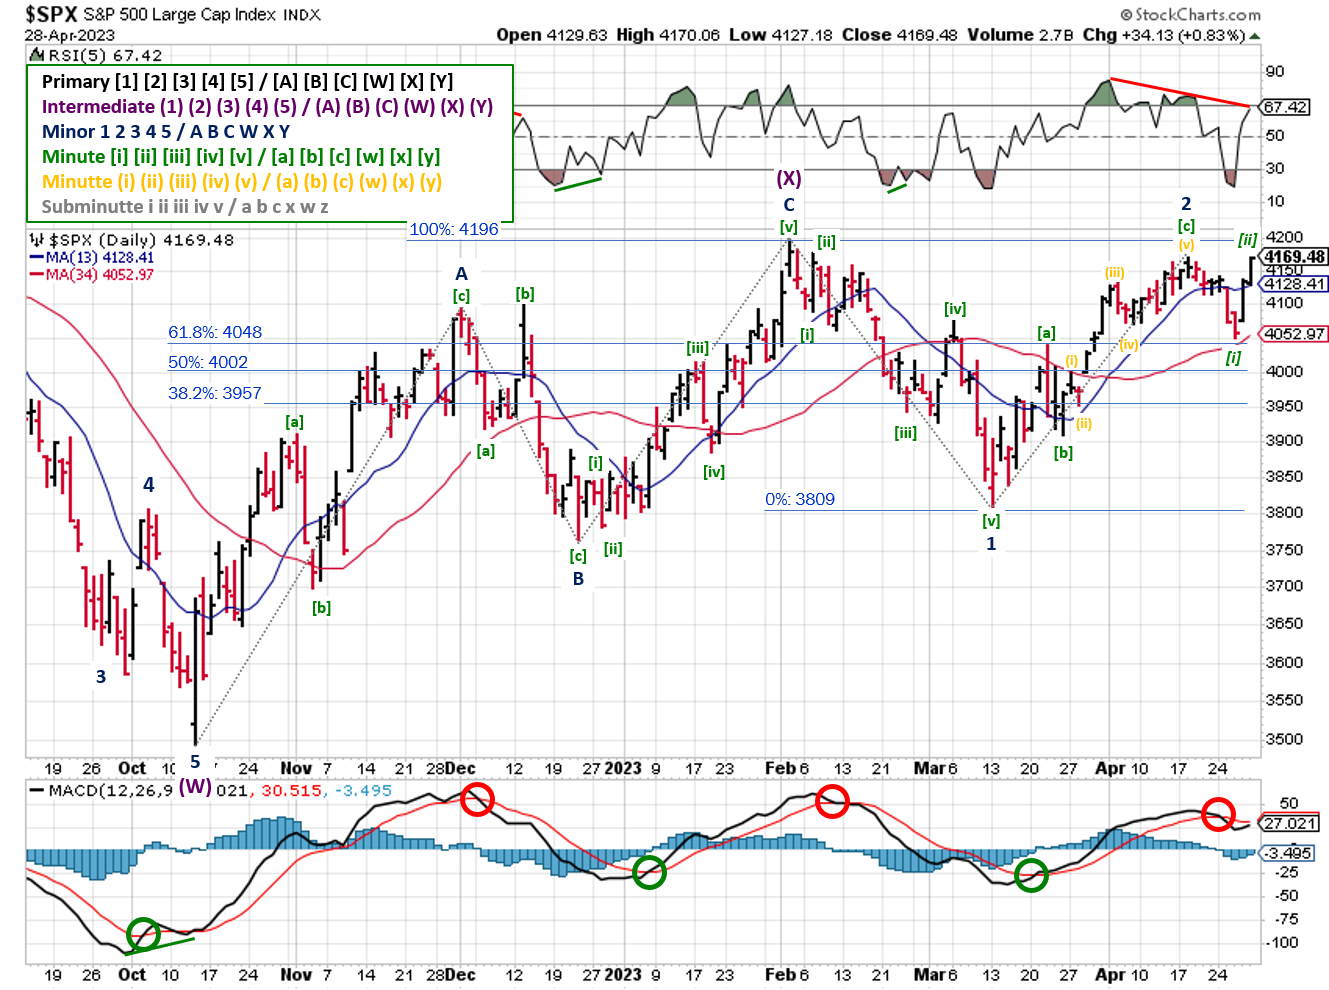
2023-04-30- SPX Elliott Wave Analysis - Daily - Primary Y (Bearish)
As of Friday’s close, the SPX appears to have completed a Minute [ii] wave in the bearish count. The typical retracement for a second wave is 61.8%-100% of the first wave. So for the current Minute [ii], the target was 4123-4169.48. The SPX closed Friday’s session at…*checks chart*…4169.48(!). While this level needs to hold, the count is further strengthened by a second negative divergence in the RSI(5), increases the probability of a completed 2nd wave.
Of course, the fact that the index sits at 100% retracement also makes the bearish count very "fragile", as there's little room to the upside! The bull count isn't invalid just yet, despite the increasingly bearish tone set by the technical indicators. Both counts need to survive a handful of market moving events this week.
COMMENTARY
March PCE data shows that inflation continues to decline from peak levels, but remains high. Headline numbers were higher than expected (+4.2% Y/Y), but was lower than the 5.1% increased in February. Core PCE was up 4.6% Y/Y; down slightly from February.
First quarter GDP showed the U.S. economy is growing, at a slow pace...kind of like inflation. Q1 GPD increased +1.6% Y/Y, versus +0.9% Y/Y in Q4 2022. Interestingly, government spending accounted for 0.81% of the increase. The annualized SAAR, which is the number widely reported by the media, showed an increased of +1.1%, well below the Q4 level of +2.6%.
So far, Q1 earnings have exceeded analyst estimates, although most of those estimates were lowered last quarter so it's not as impressive as it sounds. With just over half the S&P500 companies reporting, revenue growth is up about 5%, while earnings are contracting (-3%). The Energy and Industrial sectors are up 51% and 26% respectively, otherwise the earnings contraction would be much worse (Source: Hedgeye Risk Management).
Mega-cap tech stocks, which account for a large part of the S&P's performance, helped the index rally last week. But this week is all about Apple, which releases earnings on Thursday, May 4th. The company accounts for almost 7% of the S&P500's total market cap!
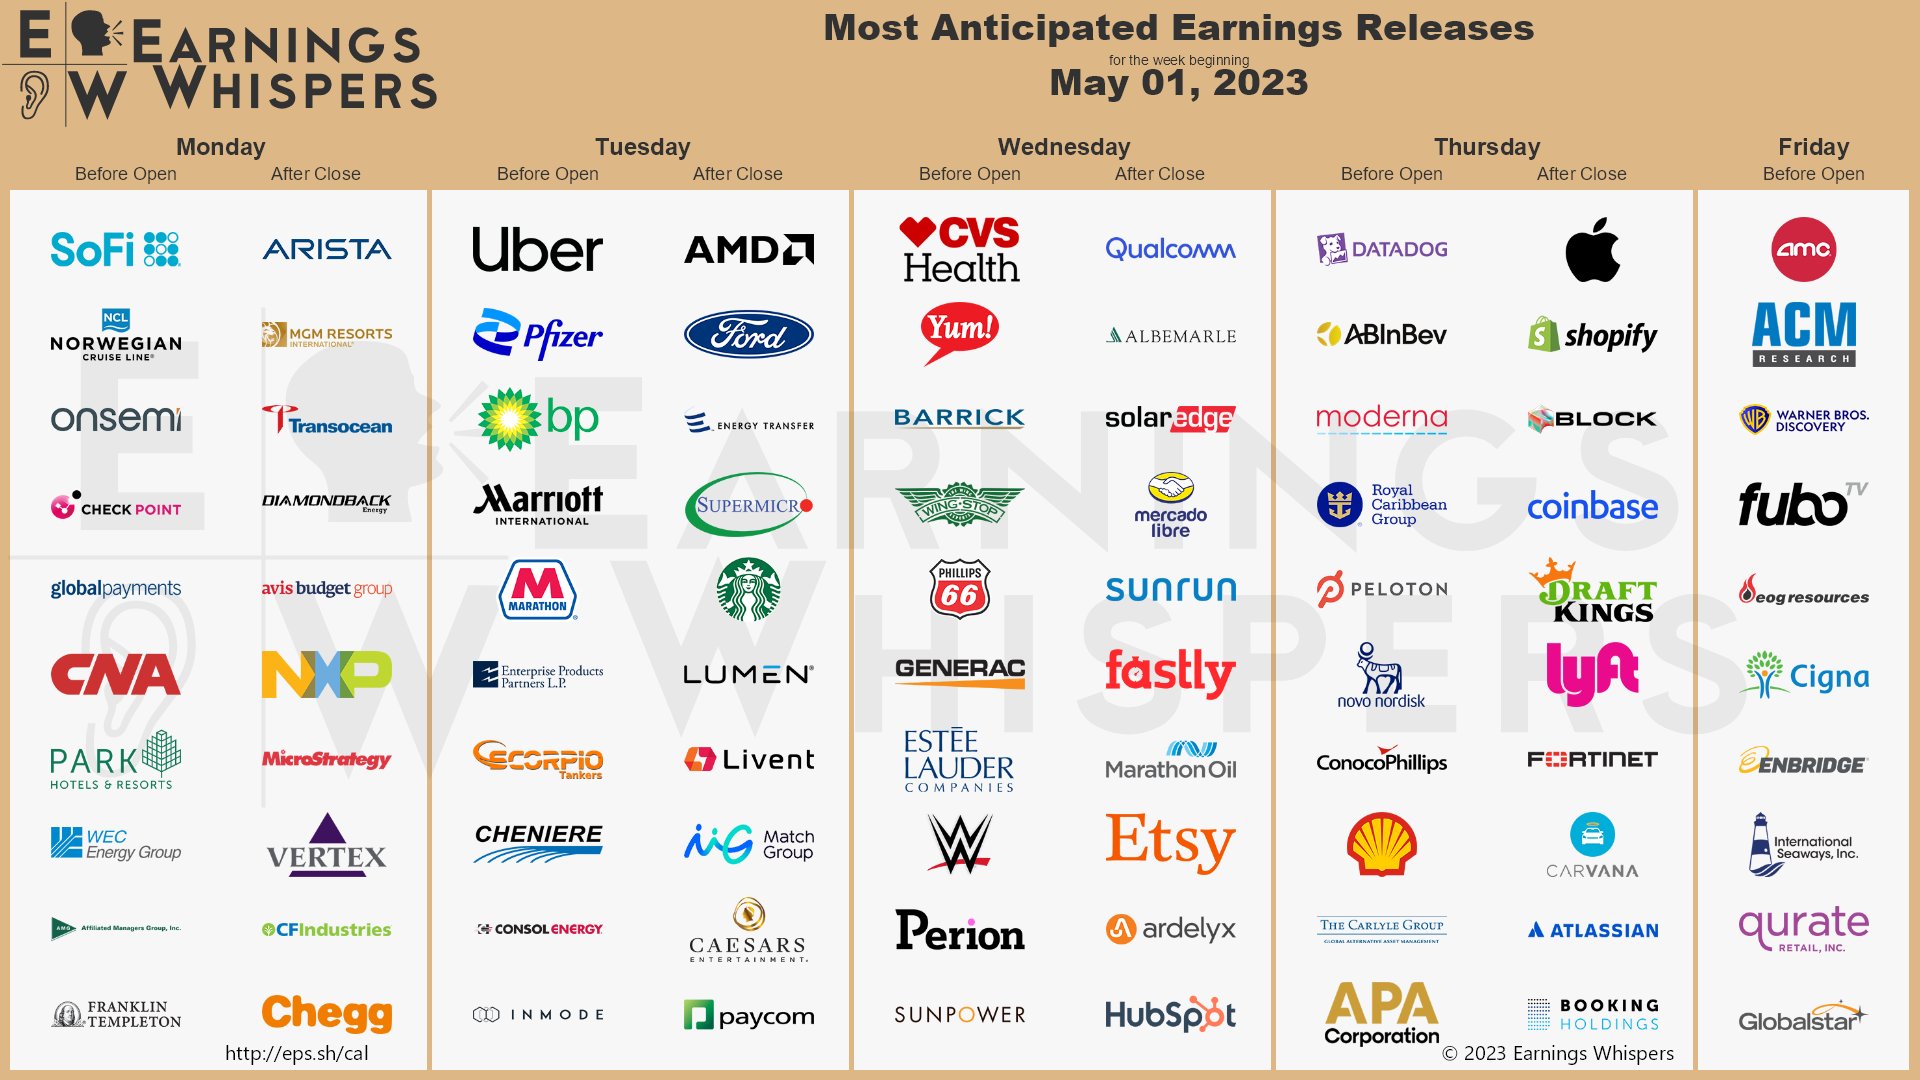
https://twitter.com/eWhispers/status/1652029676443803662?s=20
They'll be a lot of economic data released this week as well. ISM Manufacturing & Services indexes come out on Monday and Wednesday, respectively. JOLTS data is released on Tuesday. On Wednesday, the Fed's latest rate decision is announced. Non-farm payrolls come out on Friday.
But first, the market needs to absorb another bank failure. After market close on Friday, Reuters broke the news that the U.S. Federal Deposit Insurance Corporation (FDIC) was preparing to put First Republic Bank ($FRC) into receivership.
Best To Your Week!
P.S. If you find this research helpful, please tell a friend.
If you don't, tell an enemy.
Sources: Bloomberg, CNBC, Federal Reserve Bank of St. Louis, Hedgeye, U.S. Bureau of Economic Analysis, U.S. Bureau of Labor Statistics
Share this Post on:

How to Make Money in Stocks: A Winning System in Good Times and Bad.
It's one of my favorites.
I regularly share articles and other news of interest on:
Twitter (@investsafely)
Facebook (@InvestSafely)
LinkedIn (@Invest-Safely)
Instagram (@investsafely)
Invest Safely, LLC is an independent investment research and online financial media company. Use of Invest Safely, LLC and any other products available through invest-safely.com is subject to our Terms of Service and Privacy Policy. Not a recommendation to buy or sell any security.
Charts provided courtesy of stockcharts.com.
For historical Elliott Wave commentary and analysis, go to ELLIOTT WAVE lives on by Tony Caldaro. Current counts can be found at: Pretzel Logic, and 12345ABCDEWXYZ
Once a year, I review the market outlook signals as if they were a mechanical trading system, while pointing out issues and making adjustments. The goal is to give you to give you an example of how to analyze and continuously improve your own systems.
- 2015 Performance - Stock Market Outlook
- 2016 Performance - Stock Market Outlook
- 2017 Performance - Stock Market Outlook
- 2018 Performance - Stock Market Outlook
- 2019 Performance - Stock Market Outlook
- 2020 Performance - Stock Market Outlook
IMPORTANT DISCLOSURE INFORMATION
This material is for general communication and is provided for informational and/or educational purposes only. None of the content should be viewed as a suggestion that you take or refrain from taking any action nor as a recommendation for any specific investment product, strategy, or other such purpose. Certain information contained herein has been obtained from third-party sources believed to be reliable, but we cannot guarantee its accuracy or completeness.
To the extent that a reader has any questions regarding the applicability of any specific issue discussed above to his/her individual situation, he/she is encouraged to consult with the professional advisors of his/her choosing. Invest Safely, LLC is not a law firm, certified public accounting firm, or registered investment advisor and no portion of its content should be construed as legal, accounting, or investment advice.
The material is not to be construed as an offer or a recommendation to buy or sell a security nor is it to be construed as investment advice. Additionally, the material accessible through this website does not constitute a representation that the investments described herein are suitable or appropriate for any person.
Hypothetical Presentations:
Any referenced performance is “as calculated” using the referenced funds and has not been independently verified. This presentation does not discuss, directly or indirectly, the amount of the profits or losses, realized or unrealized, by any reader or contributor, from any specific funds or securities.
The author and/or any reader may have experienced materially different performance based upon various factors during the corresponding time periods. To the extent that any portion of the content reflects hypothetical results that were achieved by means of the retroactive application of a back-tested model, such results have inherent limitations, including:
Model results do not reflect the results of actual trading using assets, but were achieved by means of the retroactive application of the referenced models, certain aspects of which may have been designed with the benefit of hindsight
Back-tested performance may not reflect the impact that any material market or economic factors might have had on the use of a trading model if the model had been used during the period to actually manage assets
Actual investment results during the corresponding time periods may have been materially different from those portrayed in the model
Past performance may not be indicative of future results. Therefore, no one should assume that future performance will be profitable, or equal to any corresponding historical index.
The S&P 500 Composite Total Return Index (the "S&P") is a market capitalization-weighted index of 500 widely held stocks often used as a proxy for the stock market. Standard & Poor's chooses the member companies for the S&P based on market size, liquidity, and industry group representation. Included are the common stocks of industrial, financial, utility, and transportation companies. The S&P is not an index into which an investor can directly invest. The historical S&P performance results (and those of all other indices) are provided exclusively for comparison purposes only, so as to provide general comparative information to assist an individual in determining whether the performance of a specific portfolio or model meets, or continues to meet investment objective(s). The model and indices performance results do not reflect the impact of taxes.
Investing involves risk (even the “safe” kind)! Past performance does not guarantee or indicate future results. Different types of investments involve varying degrees of underlying risk. Therefore, do not assume that future performance of any specific investment or investment strategy be suitable for your portfolio or individual situation, will be profitable, equal any historical performance level(s), or prove successful (including the investments and/or investment strategies describe on this site).
Investing Process Links
Stabilize- Organize your $$$
- Manage your $$$
Plan
- Why You Invest
- Ways to Invest
- Where to Invest
- What to Invest In
Execute
- When to Invest
- How Much to Invest
- Buying & Selling
Monitor
- Track The Market
- Track Your Returns
Reflect & Adjust
- Improve Your Returns
- Adjust your Holdings
Popular Pages
- Jim Cramer- Personal Incomes Statements
- Hyperinflation
- Calculating Beta
- SMART Financial Goals
Blogroll
- Advisor Perspectives- Dividend Growth Investor
- Elliott Wave Lives On
- On My Radar | CMG Wealth
- Sure Dividend
- The Big Picture
- The Fat Pitch
- Thoughts from the Frontline
- Trader Feed
Sponsored Links
Invest Safely provides valuable, time-saving info about personal finance, money management, and investing.


