Stock Market Outlook
For The Week Of March 19th = Downtrend
INDICATORS
-
ADX Directional Indicators: Downtrend
Price & Volume Action: Downtrend
Elliott Wave Analysis: Mixed
The S&P500 ($SPX) rose 1.4% last week. The index found support near the trendline of lower-highs from November-December, and currently sits just below the 200-day moving average after briefly reclaiming that level.
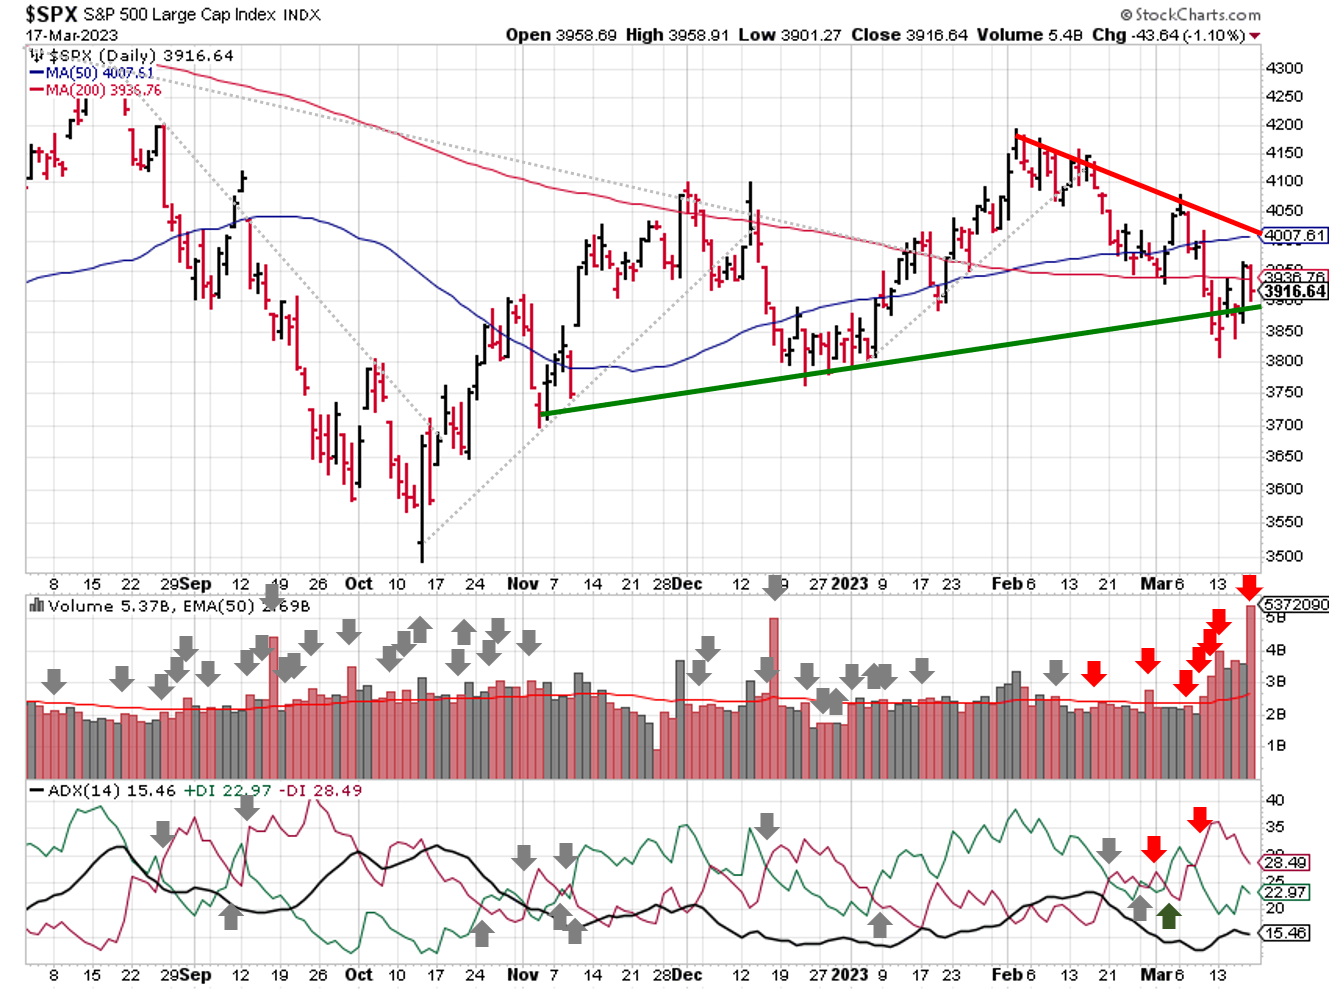
2023-03-19-SPX Trendline Analysis - Daily
The ADX and price volume remain bearish. The index experienced more institutional selling, with Friday's volume skewed by options expiration and index rebalancing.
Elliott Wave remains mixed; key levels are 3765 and 4196.
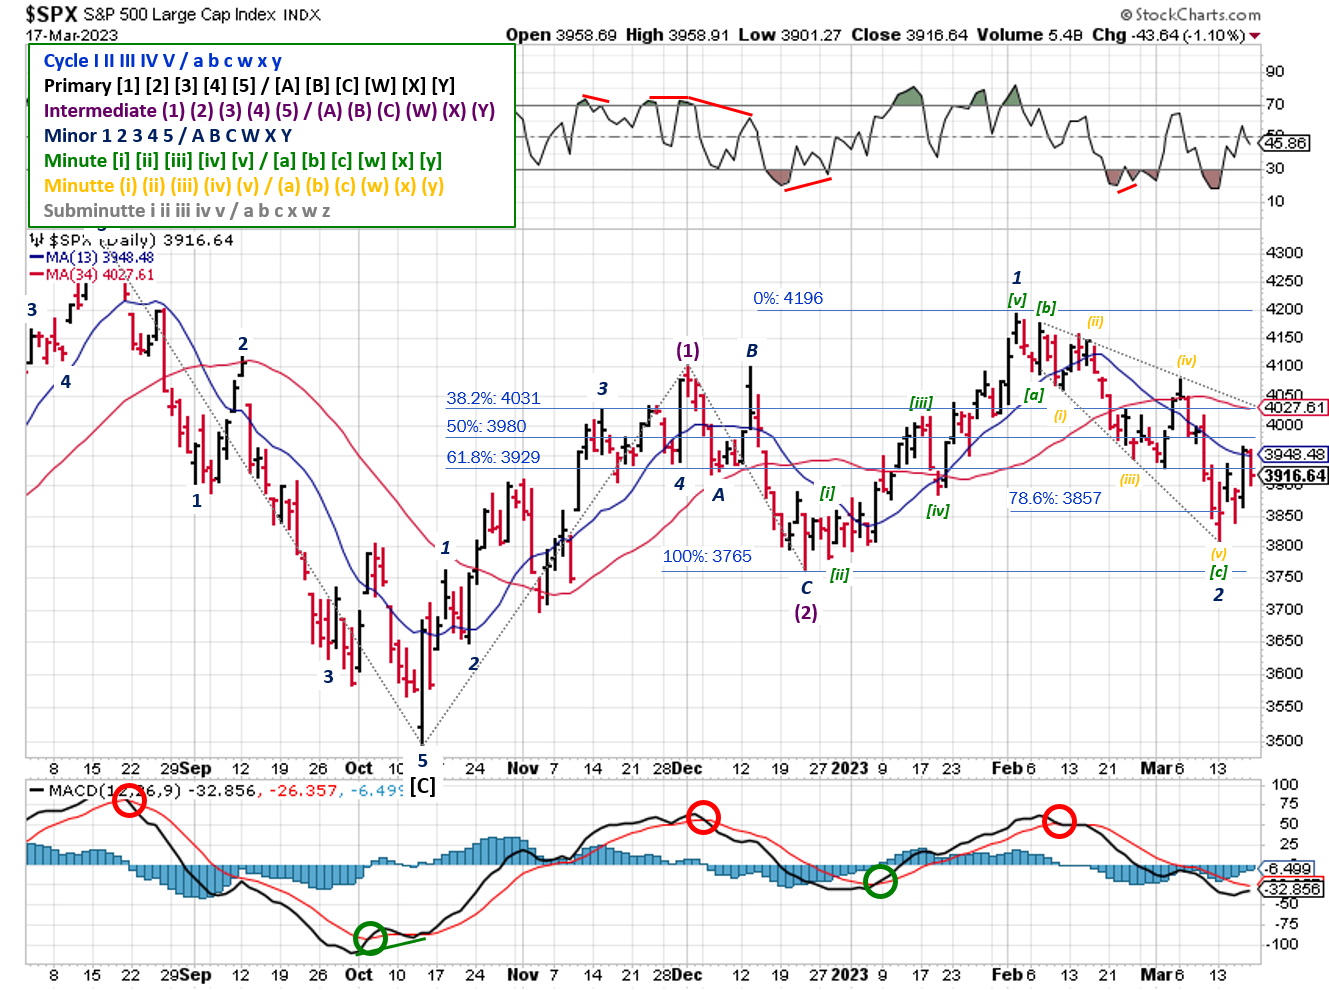
2023-03-19 - SPX Elliott Wave Analysis - Daily - Primary 1 (Bullish)
COMMENTARY
This week was a long month. Based on all the hyperventilating, you'd expect the U.S. stock market to have crashed. Not so. Instead, the S&P 500 was up modestly for the week. The NASDAQ was up 4.4%! Liquidity issues and bank failures mean buy tech stocks. Who knew?
After mentioning further surprises in the last post, the banking sector delivered with First Republic Bank ($FRC) stepping into the spotlight. Credit Suisse ($CS) made a push late in the week, but that bank has struggled for a while now (credit issues as far back as October 2), so it's not really a surprise. As of Sunday, UBS will won't will be acquiring them.
Lost in the hyperventilating were February consumer price index and producer price index data.
February CPI data was inline with estimates and declined from January.
- CPI
- +6.0% vs. +6.0% est. (y/y),
- (0.4%) from January's +6.4% reading
- Core CPI
- +5.5% vs. +5.5% est.
- (0.1%) from January's +5.6% reading
February CPI +6.0% y/y vs. +6.0% est. & +6.4% in prior month; core CPI +5.5% vs. +5.5% est. & +5.6% prior pic.twitter.com/5yM69SC6kl
— Liz Ann Sonders (@LizAnnSonders) March 14, 2023
February PPI data was lower than estimates and declined from January.
- PPI
- +4.6% vs. +5.4% est (y/y)
- (1.1%) from January's revised 5.7% reading
- Core PPI
- +4.4% vs +5.2% est (y/y)
- (0.6%) from January's revised 5.0% reading
February PPI +4.6 y/y vs +5.4% est & 5.7% prior (rev down from +6.0%); core PPI +4.4% vs +5.2% est & 5.0% prior (rev down from +5.4%) pic.twitter.com/rxax2Saq3S
— Liz Ann Sonders (@LizAnnSonders) March 15, 2023
This week, all eyes are on U.S. interest rates, with the Fed's latest policy hitting the wires Wednesday. Last week, the ECB raised rates 0.5%, in spite of any potential liquidity issues, with some pundits calling the move a trial balloon for the Fed.
So...what to do.
First, breathe.
Second, remember rule #1: No one cares more about your money than you. Not Jim Cramer, not CNBC, not the people railing on Facebook, or the sensational "sky is falling" tweets rising to the top of Twitter's new algos.
Third, remember rule #2: Always protect against losses. If you don't keep the money you have already, compounding is impossible. One way to do that is only trade when the probability of success is in your favor. And right now, that's not the case for most of us. More specifically to the weekend outlook, the SPX at a point where none of the signals are convincing in either direction. The outlook shows a downtrend in place. The SPX sits on the 200-day moving average and a trendline of higher lows. For every bearish signal, you can find a bullish counterpoint.
Finally, review your personal finances. Check your balance sheet and make sure your account sizes are within the FDIC / SIPC limits. If not, take action! Check your investment portfolios and make sure your positions are sized appropriately (i.e. one investment can't destroy the value of your nest egg). If not, take action! For example, you could reduce the size of each position so the maximum loss in any single investment is less than 2% of the total portfolio.
Markets are complex systems. Complex systems are difficult to model due to the interactions between their parts, the system as a whole, and the environment. These interactions create nonlinearity, emergent properties, feedback loops, etc...all of which reduce or remove your edge.
There are a lot of moving parts in the global financial system right now...everything, everywhere, all at once, if you will. No one knows what Powell will do this week, let alone how market prices respond, so we've got no edge. Capital preservation is best choice until our edge returns.
Remember, if you think you know what's going on right now, you're not paying attention.
Best To Your Week!
P.S. If you find this research helpful, please tell a friend.
If you don't, tell an enemy.
Sources: Bloomberg, CNBC, Federal Reserve Bank of St. Louis, Hedgeye, U.S. Bureau of Economic Analysis, U.S. Bureau of Labor Statistics
Share this Post on:

How to Make Money in Stocks: A Winning System in Good Times and Bad.
It's one of my favorites.
I regularly share articles and other news of interest on:
Twitter (@investsafely)
Facebook (@InvestSafely)
LinkedIn (@Invest-Safely)
Instagram (@investsafely)
Invest Safely, LLC is an independent investment research and online financial media company. Use of Invest Safely, LLC and any other products available through invest-safely.com is subject to our Terms of Service and Privacy Policy. Not a recommendation to buy or sell any security.
Charts provided courtesy of stockcharts.com.
For historical Elliott Wave commentary and analysis, go to ELLIOTT WAVE lives on by Tony Caldaro. Current counts can be found at: Pretzel Logic, and 12345ABCDEWXYZ
Once a year, I review the market outlook signals as if they were a mechanical trading system, while pointing out issues and making adjustments. The goal is to give you to give you an example of how to analyze and continuously improve your own systems.
- 2015 Performance - Stock Market Outlook
- 2016 Performance - Stock Market Outlook
- 2017 Performance - Stock Market Outlook
- 2018 Performance - Stock Market Outlook
- 2019 Performance - Stock Market Outlook
- 2020 Performance - Stock Market Outlook
IMPORTANT DISCLOSURE INFORMATION
This material is for general communication and is provided for informational and/or educational purposes only. None of the content should be viewed as a suggestion that you take or refrain from taking any action nor as a recommendation for any specific investment product, strategy, or other such purpose. Certain information contained herein has been obtained from third-party sources believed to be reliable, but we cannot guarantee its accuracy or completeness.
To the extent that a reader has any questions regarding the applicability of any specific issue discussed above to his/her individual situation, he/she is encouraged to consult with the professional advisors of his/her choosing. Invest Safely, LLC is not a law firm, certified public accounting firm, or registered investment advisor and no portion of its content should be construed as legal, accounting, or investment advice.
The material is not to be construed as an offer or a recommendation to buy or sell a security nor is it to be construed as investment advice. Additionally, the material accessible through this website does not constitute a representation that the investments described herein are suitable or appropriate for any person.
Hypothetical Presentations:
Any referenced performance is “as calculated” using the referenced funds and has not been independently verified. This presentation does not discuss, directly or indirectly, the amount of the profits or losses, realized or unrealized, by any reader or contributor, from any specific funds or securities.
The author and/or any reader may have experienced materially different performance based upon various factors during the corresponding time periods. To the extent that any portion of the content reflects hypothetical results that were achieved by means of the retroactive application of a back-tested model, such results have inherent limitations, including:
Model results do not reflect the results of actual trading using assets, but were achieved by means of the retroactive application of the referenced models, certain aspects of which may have been designed with the benefit of hindsight
Back-tested performance may not reflect the impact that any material market or economic factors might have had on the use of a trading model if the model had been used during the period to actually manage assets
Actual investment results during the corresponding time periods may have been materially different from those portrayed in the model
Past performance may not be indicative of future results. Therefore, no one should assume that future performance will be profitable, or equal to any corresponding historical index.
The S&P 500 Composite Total Return Index (the "S&P") is a market capitalization-weighted index of 500 widely held stocks often used as a proxy for the stock market. Standard & Poor's chooses the member companies for the S&P based on market size, liquidity, and industry group representation. Included are the common stocks of industrial, financial, utility, and transportation companies. The S&P is not an index into which an investor can directly invest. The historical S&P performance results (and those of all other indices) are provided exclusively for comparison purposes only, so as to provide general comparative information to assist an individual in determining whether the performance of a specific portfolio or model meets, or continues to meet investment objective(s). The model and indices performance results do not reflect the impact of taxes.
Investing involves risk (even the “safe” kind)! Past performance does not guarantee or indicate future results. Different types of investments involve varying degrees of underlying risk. Therefore, do not assume that future performance of any specific investment or investment strategy be suitable for your portfolio or individual situation, will be profitable, equal any historical performance level(s), or prove successful (including the investments and/or investment strategies describe on this site).
Investing Process Links
Stabilize- Organize your $$$
- Manage your $$$
Plan
- Why You Invest
- Ways to Invest
- Where to Invest
- What to Invest In
Execute
- When to Invest
- How Much to Invest
- Buying & Selling
Monitor
- Track The Market
- Track Your Returns
Reflect & Adjust
- Improve Your Returns
- Adjust your Holdings
Popular Pages
- Jim Cramer- Personal Incomes Statements
- Hyperinflation
- Calculating Beta
- SMART Financial Goals
Blogroll
- Advisor Perspectives- Dividend Growth Investor
- Elliott Wave Lives On
- On My Radar | CMG Wealth
- Sure Dividend
- The Big Picture
- The Fat Pitch
- Thoughts from the Frontline
- Trader Feed
Sponsored Links
Invest Safely provides valuable, time-saving info about personal finance, money management, and investing.


