Stock Market Outlook
For The Week Of March 12th = Downtrend
INDICATORS
-
ADX Directional Indicators: Downtrend
Price & Volume Action: Downtrend
Elliott Wave Analysis: Mixed
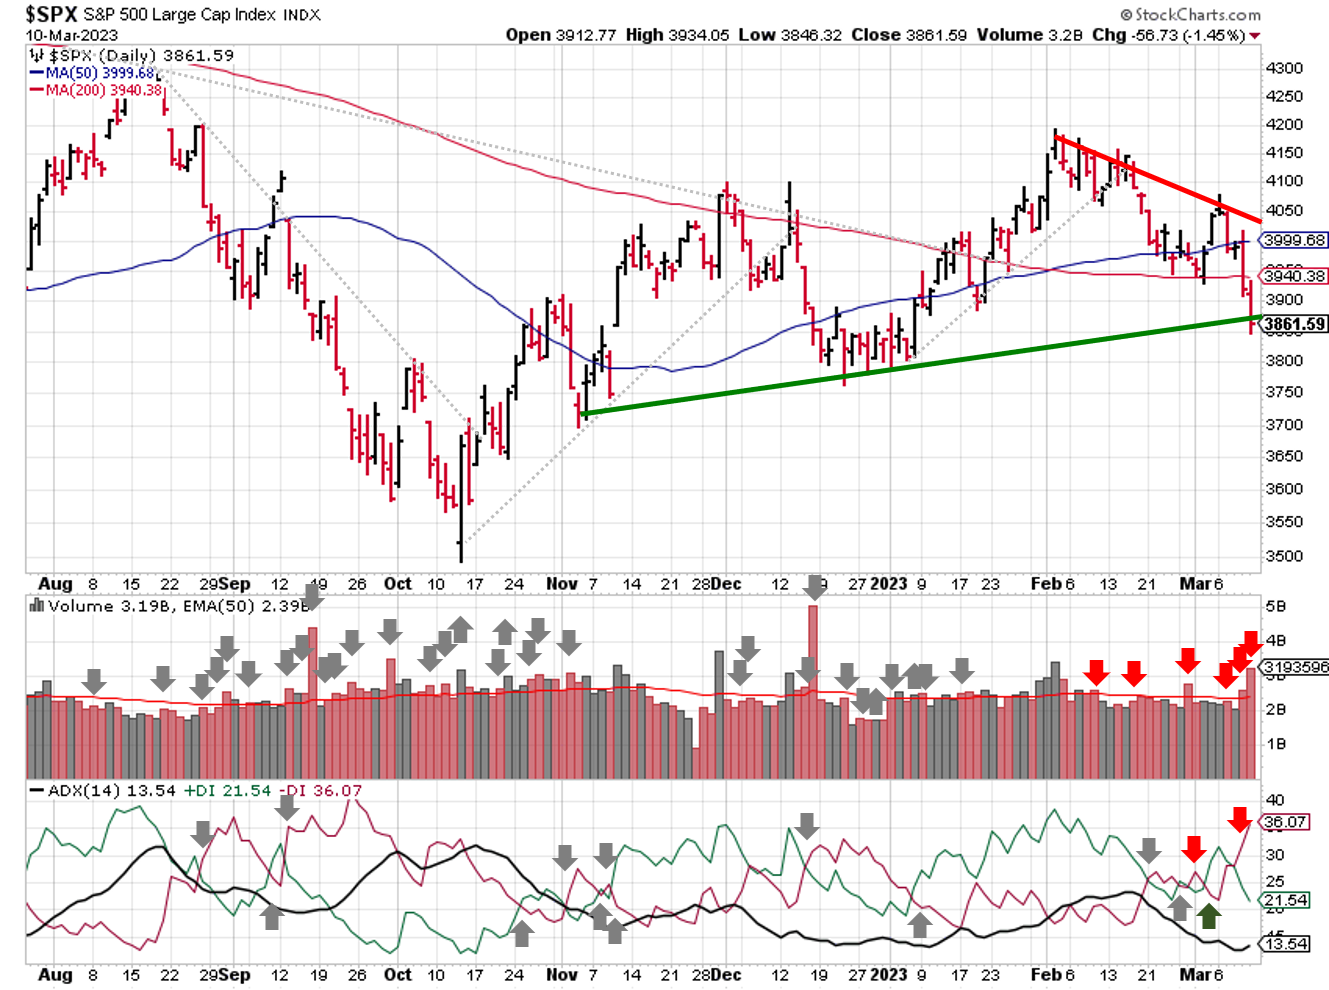
2023-03-12-SPX Trendline Analysis - Daily
The S&P500 ($SPX) fell 4.5% last week. The index ran into resistance at the trendline of "lower highs" on Monday, and found support at the trendline of "higher lows" on Friday.
The ADX moved to bearish on Thursday, as did the price and volume signal. During that session, the index sliced through the 50 and 200 day moving averages on higher than average trading volume.
Elliott Wave remains mixed, although probabilities now favor the bearish count. No change in key levels from last week (3765 and 4196).
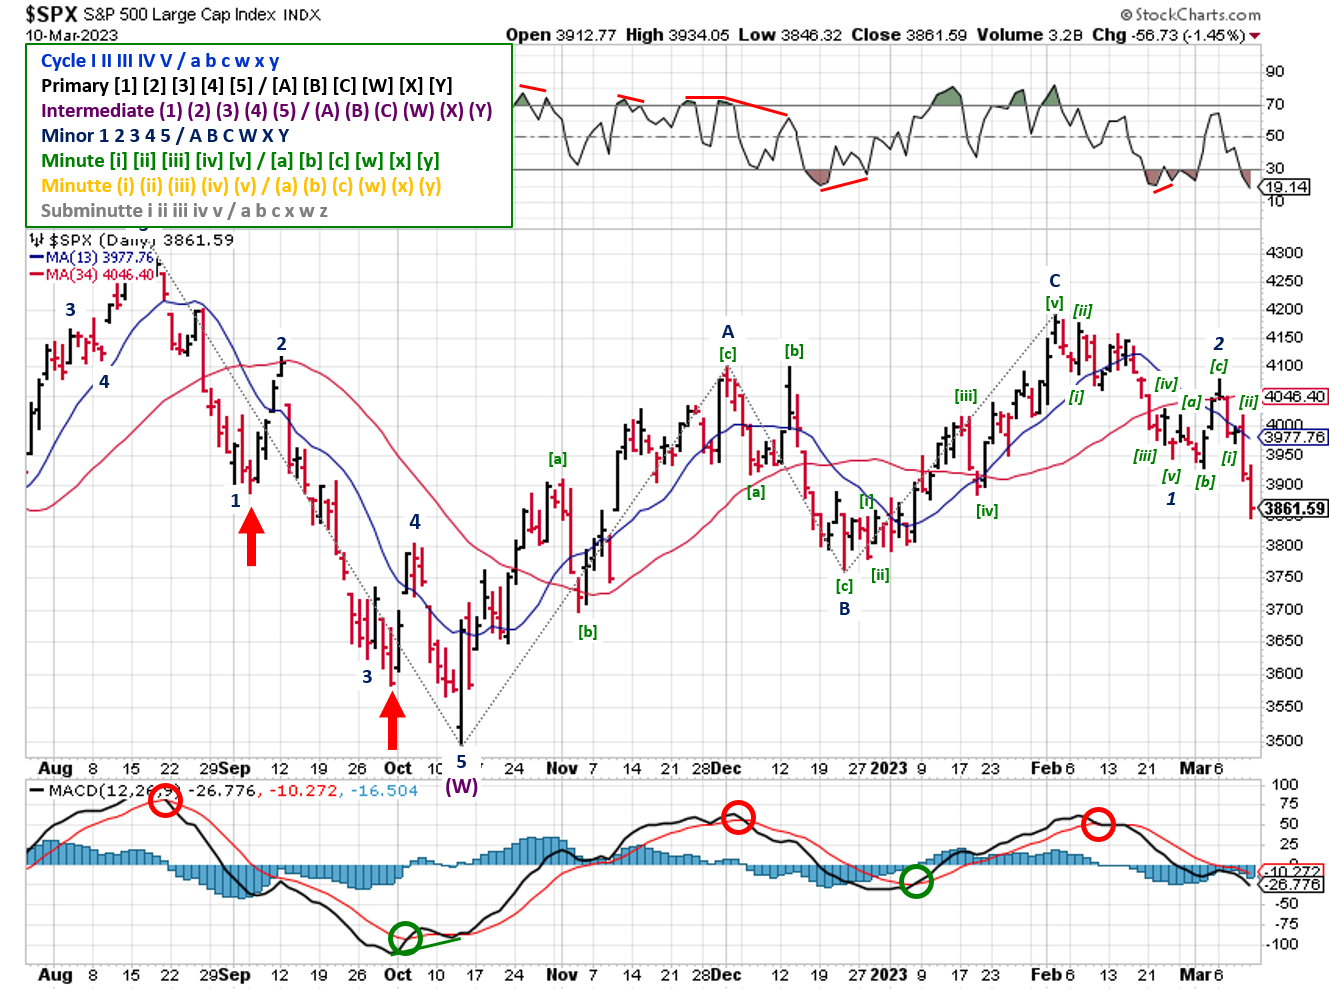
2023-03-12 - SPX Elliott Wave Analysis - Daily - Primary Y (Bearish)
Looking at the bearish count, the Minor 2 correction (i.e. rally) ended on Monday, after retracing a bit more than 50% of Minor 1. The Minute waves received a slight adjustment to match prior corrective waves (i.e. Minor 2 & 4 had b-waves that undercut the end of impulse Waves 1 & 3)
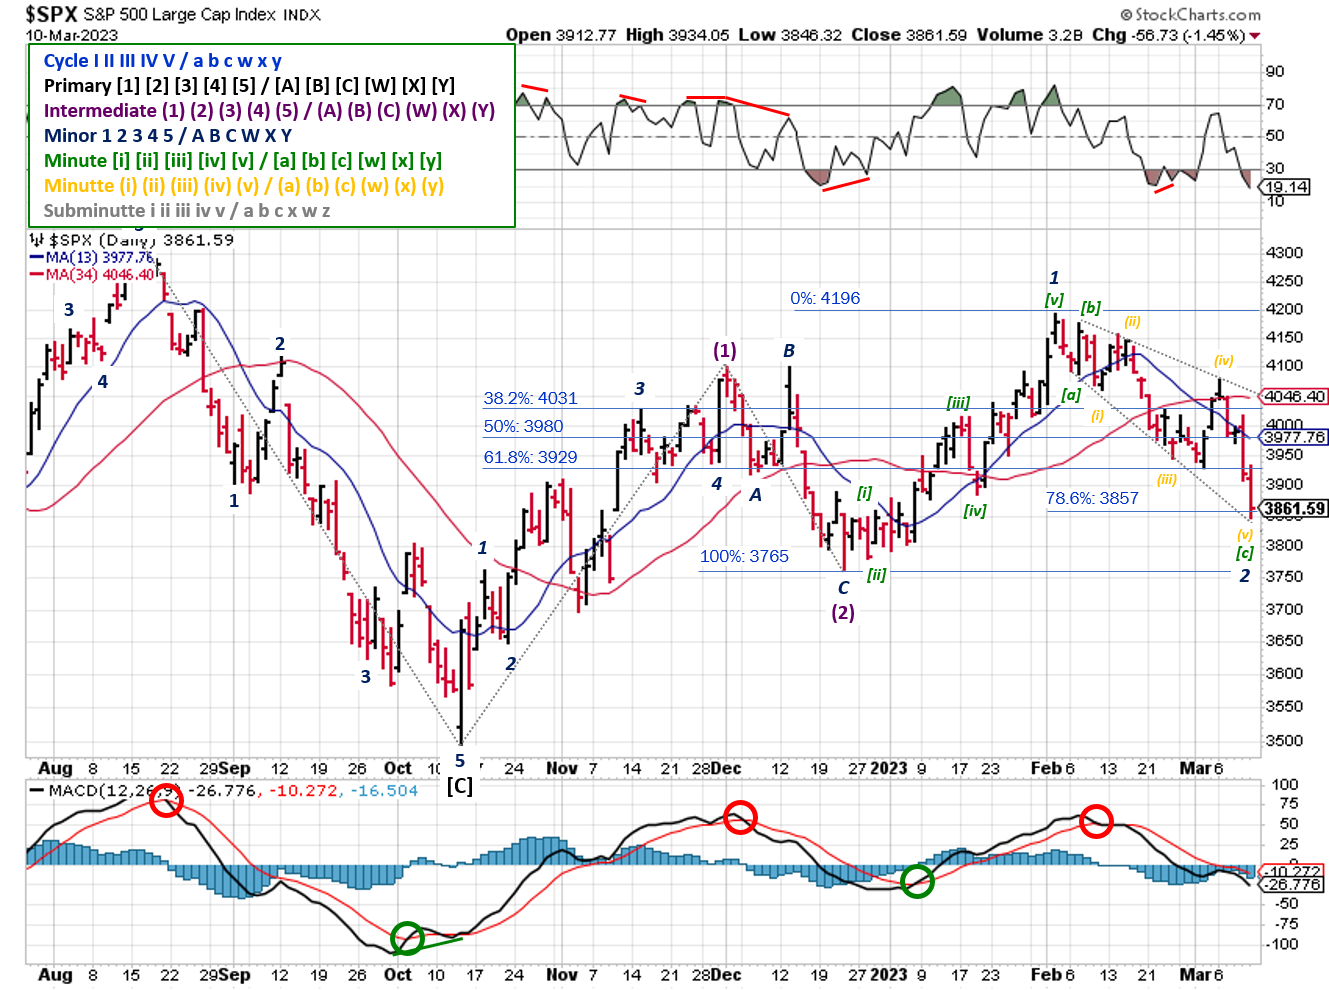
2023-03-12 - SPX Elliott Wave Analysis - Daily - Primary 1 (Bullish)
Last week’s sell-off didn’t help the bullish viewpoint, which now requires a very rare pattern: the ending-expanding diagonal. It’s so rare, some practitioners don’t believe it exists! Even so, the SPX sits at the 78.6% retracement of the Minor 1 wave, which would be a good spot for a bullish rally to find support. Otherwise, the 3765 low is the last line of defense.
COMMENTARY
No one expects the inquisition! Except the Spanish, of course. That seems to be the case in the markets as well, with a seemingly no one expecting liquidity issues, except the people watching liquidity. After all, the Fed's rate hike program wasn't called "Operation Break S&!t" for nothing.
For those that don't know, issues in the financial sector sparked last week's sell-off. There are A LOT of passionate "why", "how", and "what now" opinions on social media. A lot. Some are well reasoned...others not so much. I'll try my best to summarize:
First, and less widely reported, Silvergate Bank ($SI) entered voluntary liquidation. This announcement came after inquiries from bank regulators and the Department of Justice on their role in the FTX blow-up. The company also delayed filing its annual 10-K report due to questions from its independent auditors and accounting firm over its figures. Silvergate was not on the FDIC's "failed bank" list, because it voluntarily liquidated in order to make full repayment of all deposits, rather than going into an FDIC receivership.
On the other hand, Silicon Valley Bank ($SIVB) began experiencing liquidity issues on Wednesday, and by Friday was in receivership, meaning the company couldn't meet financial obligations (i.e. insolvent) and is now being wound down by the FDIC.
A majority of SIVB's clients are start-ups and local businesses, not personal checking/savings accounts. These businesses used the bank for things like payroll accounts, expense accounts, etc.; accounts that are much larger than FDIC insurance levels, by the way. Those companies are impacted by higher costs and lower profit margins just like everyone else, resulting in more withdrawals than deposits. The bank reached a tipping point on Thursday, after a small number of large withdrawals in a matter of hours. Even after they sold a substantial amount of assets, they couldn't recover.
Going forward, the FDIC will make SIVBs depositors whole within the limits of the FDIC program. That's the reason for the program. The amounts over and above FDIC levels are uninsured and a point of contention. As stated by Ellen Chang of TheStreet:
"Uninsured depositors will receive a receivership certificate for the remaining amount of their uninsured funds," the agency said. "As the FDIC sells the assets of Silicon Valley Bank, future dividend payments may be made to uninsured depositors."However the FDIC resolves those excess amounts, there's a high probability of financial stress and a scramble for cash over the next few days (like 2008), in a very small section of the economy (not like 2008).
Does all that mean there won't be another "surprise" corporate bankruptcy, credit event, or bank failure going forward? No! Those events happen in rate hiking cycles and/or recessions, and the U.S. economy is about to experience both at the same time, if we're not there already. Bed Bath and Beyond ($BBBY) is already on the verge of bankruptcy and winding down operations to conserve cash.
It DOES mean you can prepare yourself and your portfolio by re-evaluating risk/reward. For example, taking on more volatility for higher returns (i.e. "reaching for yield") is higher risk now that money market funds and U.S. treasuries providing more than 4% yield. Or you can make sure that all your accounts are within FDIC or SIPC limits (not advice, just for discussion).
Back to our regularly scheduled programming, the economic data released last week was mixed. January job openings (JOLTS) fell slightly compared to December, but were still better than expected. A similar story for the Non-Farm Payroll data released on Friday; February figures were higher than expected, but unemployment rose slightly (0.2%) and wages increased less than expected.
This week's economic data includes the February's Consumer Price Index (CPI) on Tuesday and Producer Price Index (PPI) on Wednesday.
Best To Your Week!
P.S. If you find this research helpful, please tell a friend.
If you don't, tell an enemy.
Sources: Bloomberg, CNBC, Federal Reserve Bank of St. Louis, Hedgeye, U.S. Bureau of Economic Analysis, U.S. Bureau of Labor Statistics
Share this Post on:

How to Make Money in Stocks: A Winning System in Good Times and Bad.
It's one of my favorites.
I regularly share articles and other news of interest on:
Twitter (@investsafely)
Facebook (@InvestSafely)
LinkedIn (@Invest-Safely)
Instagram (@investsafely)
Invest Safely, LLC is an independent investment research and online financial media company. Use of Invest Safely, LLC and any other products available through invest-safely.com is subject to our Terms of Service and Privacy Policy. Not a recommendation to buy or sell any security.
Charts provided courtesy of stockcharts.com.
For historical Elliott Wave commentary and analysis, go to ELLIOTT WAVE lives on by Tony Caldaro. Current counts can be found at: Pretzel Logic, and 12345ABCDEWXYZ
Once a year, I review the market outlook signals as if they were a mechanical trading system, while pointing out issues and making adjustments. The goal is to give you to give you an example of how to analyze and continuously improve your own systems.
- 2015 Performance - Stock Market Outlook
- 2016 Performance - Stock Market Outlook
- 2017 Performance - Stock Market Outlook
- 2018 Performance - Stock Market Outlook
- 2019 Performance - Stock Market Outlook
- 2020 Performance - Stock Market Outlook
IMPORTANT DISCLOSURE INFORMATION
This material is for general communication and is provided for informational and/or educational purposes only. None of the content should be viewed as a suggestion that you take or refrain from taking any action nor as a recommendation for any specific investment product, strategy, or other such purpose. Certain information contained herein has been obtained from third-party sources believed to be reliable, but we cannot guarantee its accuracy or completeness.
To the extent that a reader has any questions regarding the applicability of any specific issue discussed above to his/her individual situation, he/she is encouraged to consult with the professional advisors of his/her choosing. Invest Safely, LLC is not a law firm, certified public accounting firm, or registered investment advisor and no portion of its content should be construed as legal, accounting, or investment advice.
The material is not to be construed as an offer or a recommendation to buy or sell a security nor is it to be construed as investment advice. Additionally, the material accessible through this website does not constitute a representation that the investments described herein are suitable or appropriate for any person.
Hypothetical Presentations:
Any referenced performance is “as calculated” using the referenced funds and has not been independently verified. This presentation does not discuss, directly or indirectly, the amount of the profits or losses, realized or unrealized, by any reader or contributor, from any specific funds or securities.
The author and/or any reader may have experienced materially different performance based upon various factors during the corresponding time periods. To the extent that any portion of the content reflects hypothetical results that were achieved by means of the retroactive application of a back-tested model, such results have inherent limitations, including:
Model results do not reflect the results of actual trading using assets, but were achieved by means of the retroactive application of the referenced models, certain aspects of which may have been designed with the benefit of hindsight
Back-tested performance may not reflect the impact that any material market or economic factors might have had on the use of a trading model if the model had been used during the period to actually manage assets
Actual investment results during the corresponding time periods may have been materially different from those portrayed in the model
Past performance may not be indicative of future results. Therefore, no one should assume that future performance will be profitable, or equal to any corresponding historical index.
The S&P 500 Composite Total Return Index (the "S&P") is a market capitalization-weighted index of 500 widely held stocks often used as a proxy for the stock market. Standard & Poor's chooses the member companies for the S&P based on market size, liquidity, and industry group representation. Included are the common stocks of industrial, financial, utility, and transportation companies. The S&P is not an index into which an investor can directly invest. The historical S&P performance results (and those of all other indices) are provided exclusively for comparison purposes only, so as to provide general comparative information to assist an individual in determining whether the performance of a specific portfolio or model meets, or continues to meet investment objective(s). The model and indices performance results do not reflect the impact of taxes.
Investing involves risk (even the “safe” kind)! Past performance does not guarantee or indicate future results. Different types of investments involve varying degrees of underlying risk. Therefore, do not assume that future performance of any specific investment or investment strategy be suitable for your portfolio or individual situation, will be profitable, equal any historical performance level(s), or prove successful (including the investments and/or investment strategies describe on this site).
Investing Process Links
Stabilize- Organize your $$$
- Manage your $$$
Plan
- Why You Invest
- Ways to Invest
- Where to Invest
- What to Invest In
Execute
- When to Invest
- How Much to Invest
- Buying & Selling
Monitor
- Track The Market
- Track Your Returns
Reflect & Adjust
- Improve Your Returns
- Adjust your Holdings
Popular Pages
- Jim Cramer- Personal Incomes Statements
- Hyperinflation
- Calculating Beta
- SMART Financial Goals
Blogroll
- Advisor Perspectives- Dividend Growth Investor
- Elliott Wave Lives On
- On My Radar | CMG Wealth
- Sure Dividend
- The Big Picture
- The Fat Pitch
- Thoughts from the Frontline
- Trader Feed
Sponsored Links
Invest Safely provides valuable, time-saving info about personal finance, money management, and investing.


