Stock Market Outlook
For The Week Of February 26th = Uptrend
INDICATORS
-
ADX Directional Indicators: Downtrend
Price & Volume Action: Mixed
Elliott Wave Analysis: Mixed
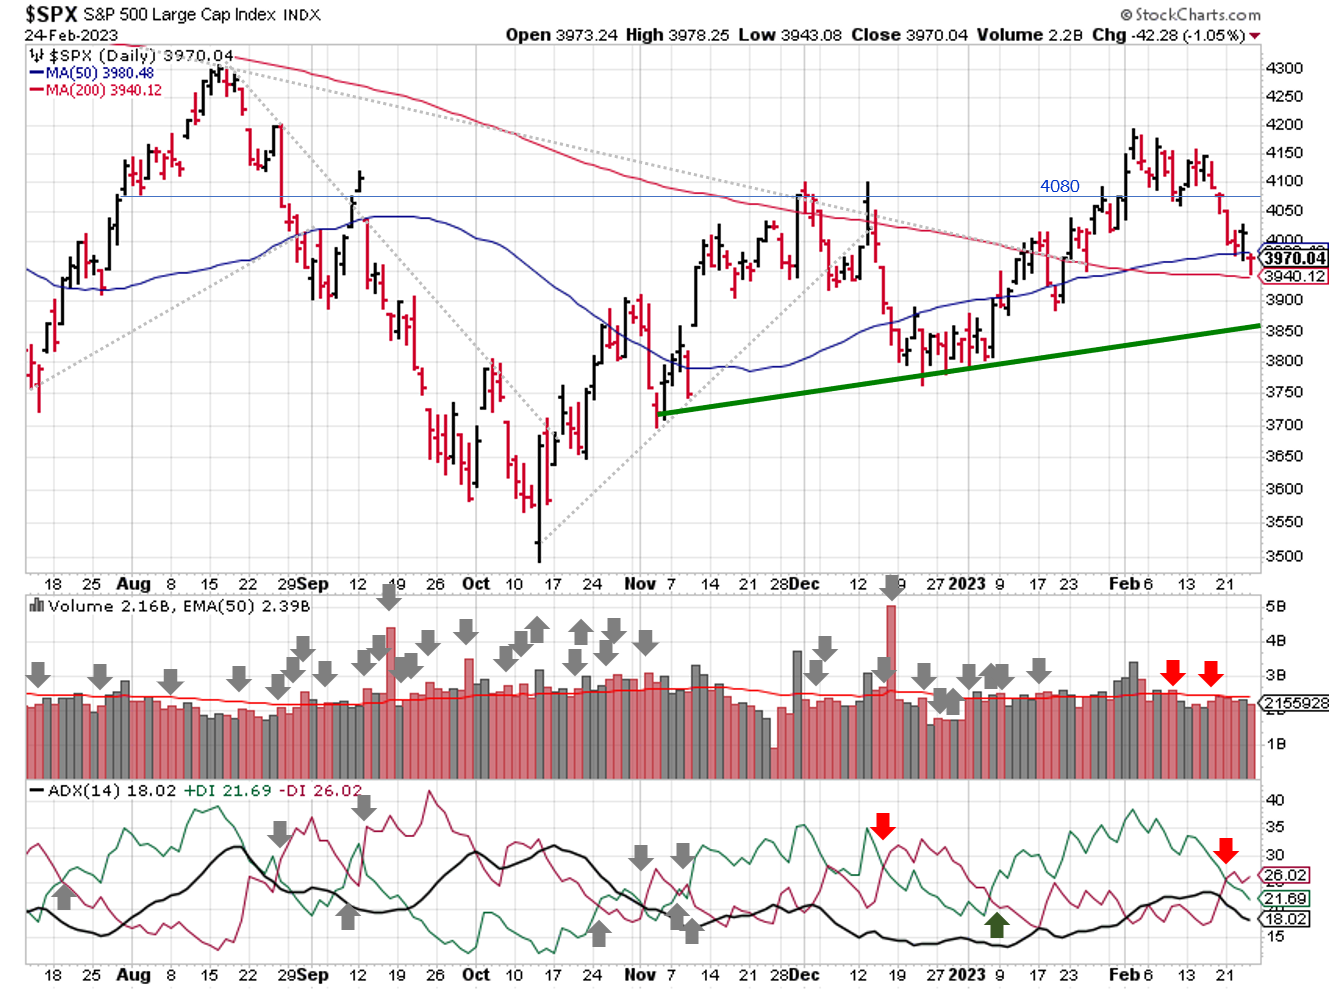
The S&P500 ($SPX) fell 2.7%, with most of the damage done on Tuesday. With the index unable to maintain 4080, the 50-day moving average provided support on Wednesday and Thursday, with help from the 200 day moving average on Friday.
2023-02-26-SPX Trendline Analysis - Daily
The ADX flipped to a bearish reading on Tuesday's down draft, while price/volume shifted to mixed. Tuesday's trading volume was slightly below the prior session, so it isn't technically a distribution day. That said, the session wasn't bullish either. With price sitting below the 50-day the signal shifts to mixed, rather than a downtrend, thanks to the lack of distribution days.
Elliott Wave remains mixed; no change in key levels from last week (3765 and 4196/4325).
The ADX and price/volume action remains bullish, with only a couple of distribution days in the past 5 weeks.
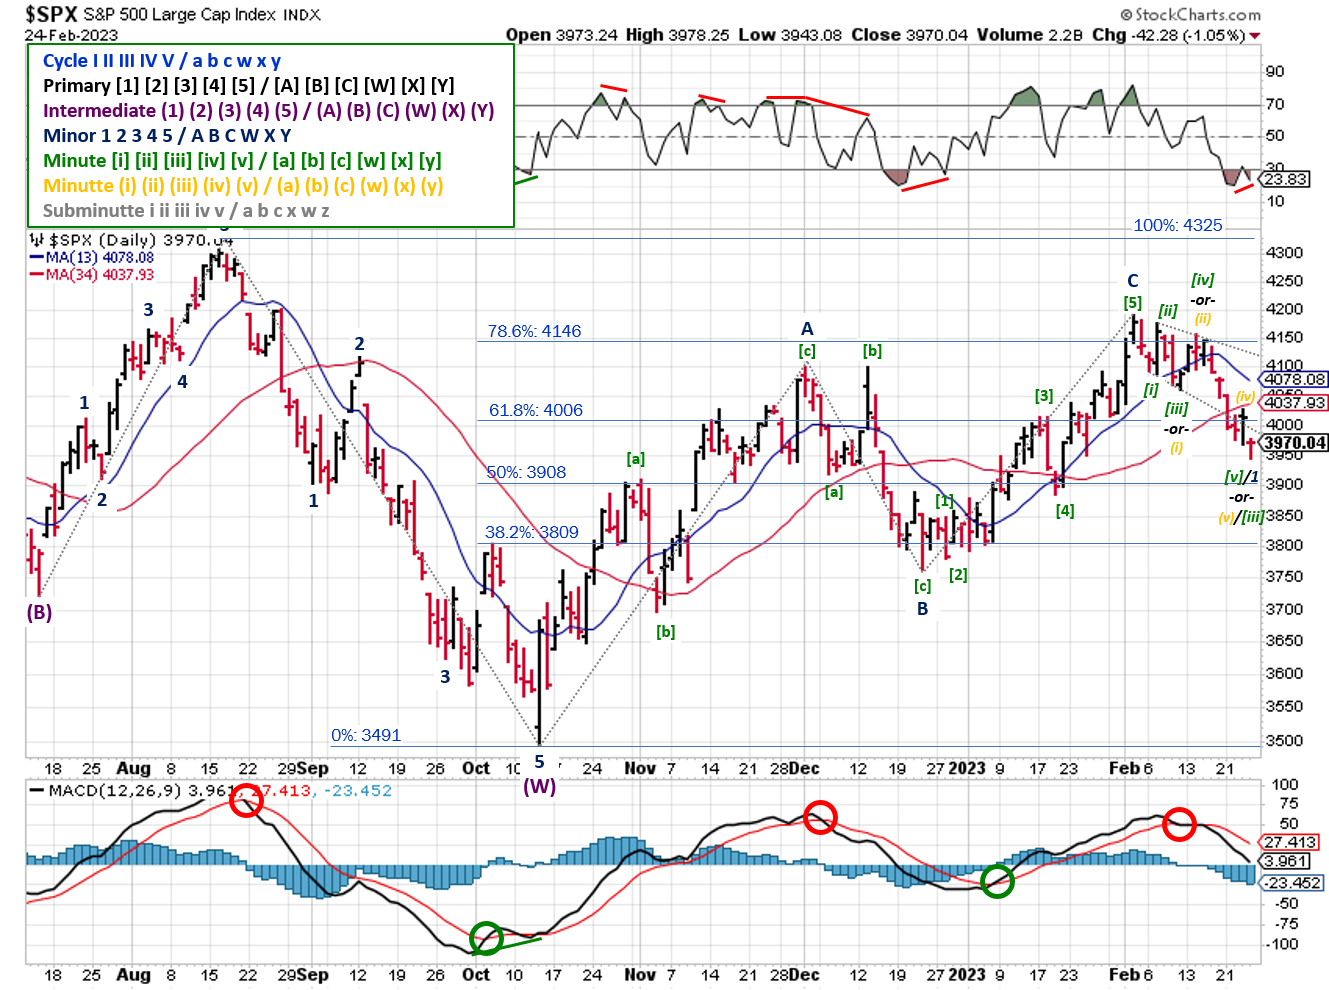
2023-02-26- SPX Elliott Wave Analysis - Daily - Primary Y
The bearish diagonal count from last week was revised one level higher, with the market in the Minute [v] wave of Minor 1. It’s also possible that the Minute [iii] subdivided, which would put the market in Minutte [v] . This count shows a bounce to 4088 (the Minutte [i] low) is likely, before the market heads lower.
The RSI divergence correlates to completed 5th waves, so the Minor 1 count is most likely. For both bearish counts, 4196 is the max for Minor 2.
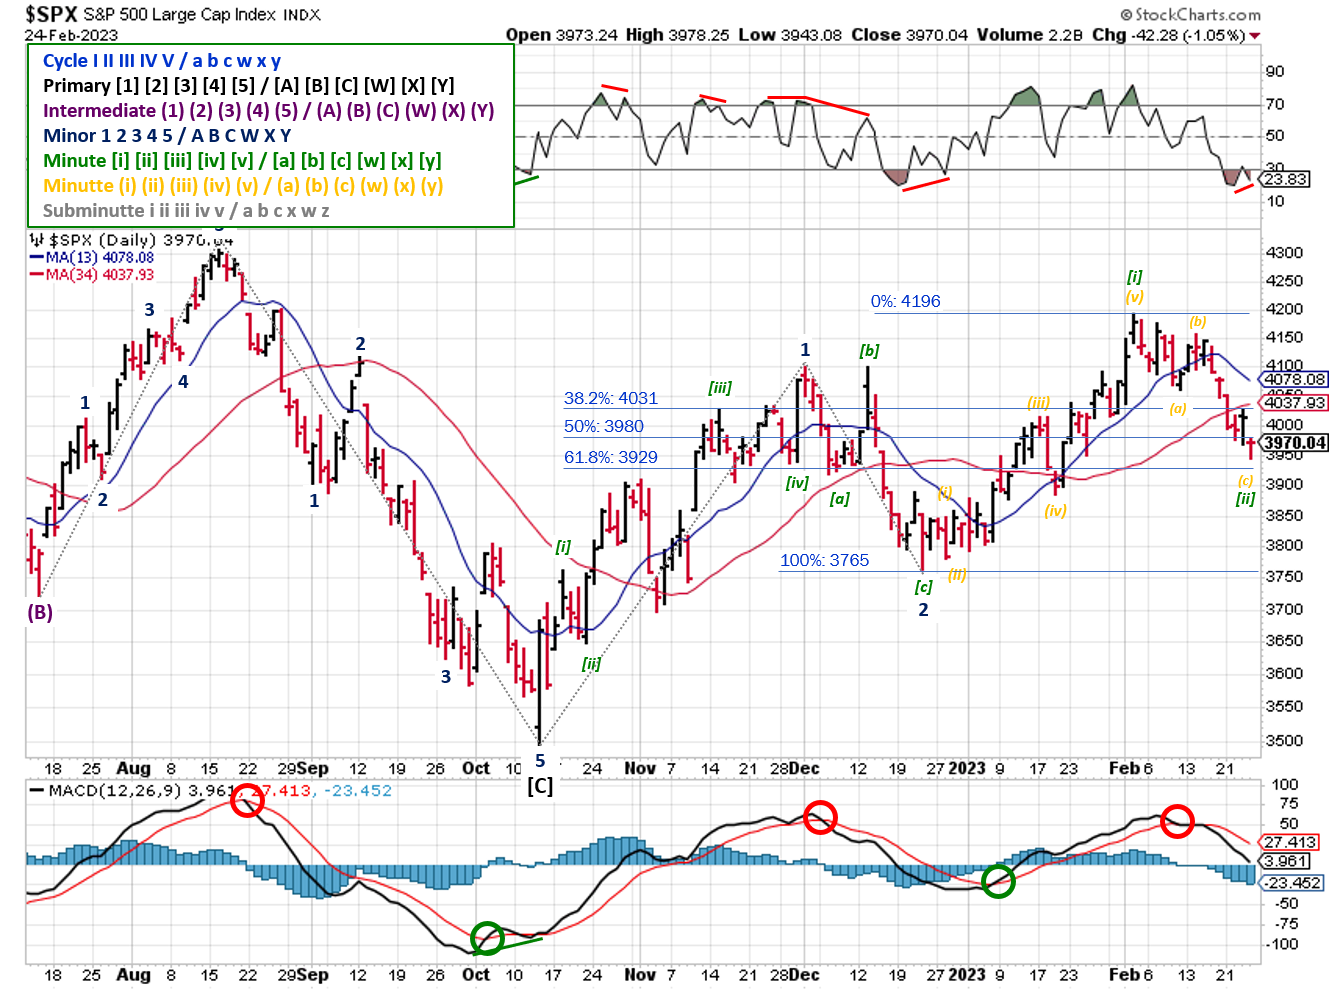
2023-02-26- SPX Elliott Wave Analysis - Daily - Primary 1
For the bullish count, the Minute [ii] wave reached typical Fibonacci levels. As mentioned above, an RSI divergence correlates to completed 5th waves, so a Minute [3] rally could start at any time.
In either case, remember that corrective waves are typically large and short, in terms of price movement and timeframe. So if you’re bearish, the next wave (Minor 2) will move like the Minor 2 last September. If you’re bullish, the Minute [iii] will move like the Minute [iii] from late October-early November.
COMMENTARY
The high level economic data released last week was bearish, showing lower GDP growth and higher inflation.
Revised Q4 GDP came out on Thursday, lowering data by 0.2% (+2.7% versus the initial estimate of +2.9%, on an annualized). On a year over year basis, Q4 GDP growth was revised lower as well (from 1.0% to 0.9%).
January PCE data was higher than expected (hawkish), with headline data increasing 5.4% year over year vs. expectations of 5%. Core figures came in at 4.7% y/y vs 4.3% expected.
Adding to last week's releases, there's a bunch of economic data coming out this week, including durable goods, pending home sales and price indexes, Consumer Confidence, ISM manufacturing and services data to name a few. More that enough to muddy the waters even more.
More earnings on the way:
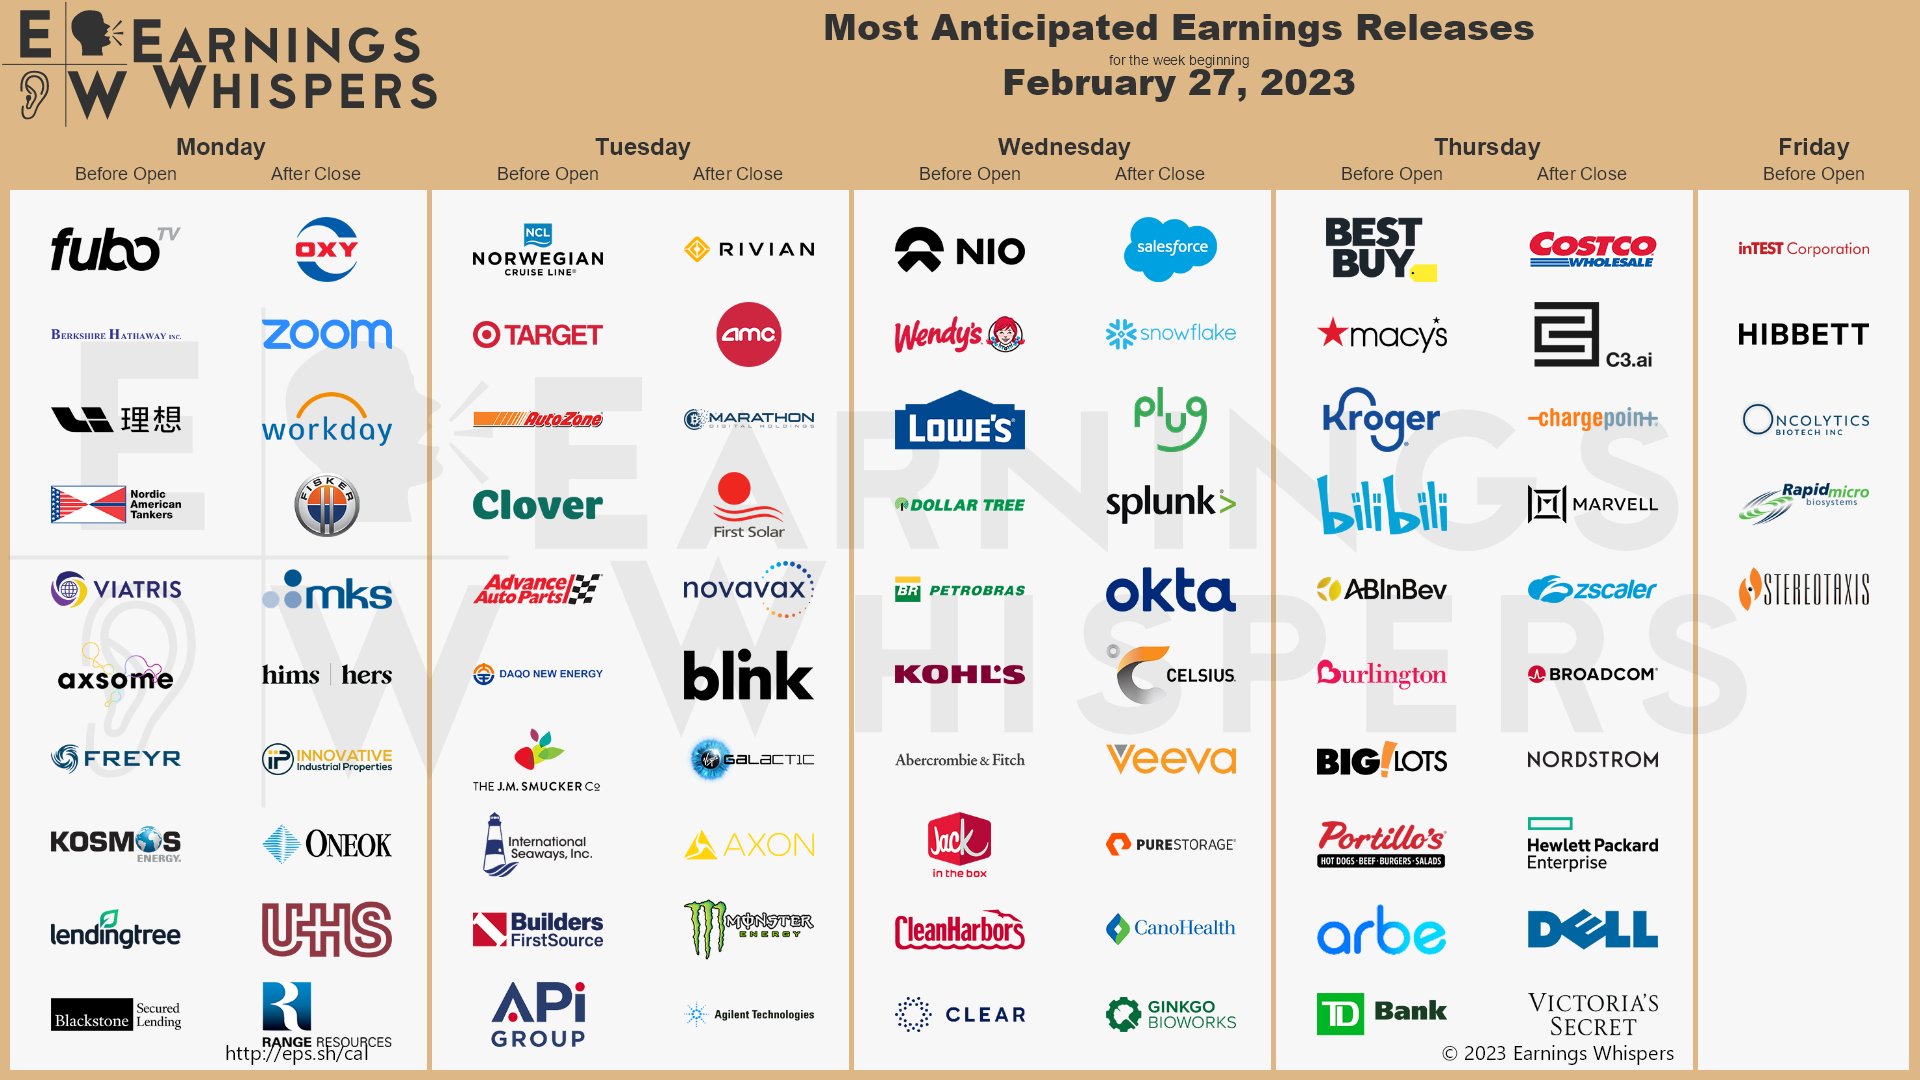
Source: https://pbs.twimg.com/media/Fpwe9mCXEAEZxnn
P.S. Here's a potential contrarian and totally unofficial indicator for you: blog traffic. Typically, site traffic peaks when people are extremely bearish. Right now, traffic is barely a trickle, with some days registering zero activity, which is indicative of extreme bullishness.
Best To Your Week!
P.S. If you find this research helpful, please tell a friend.
If you don't, tell an enemy.
Sources: Bloomberg, CNBC, Federal Reserve Bank of St. Louis, Hedgeye, U.S. Bureau of Economic Analysis, U.S. Bureau of Labor Statistics
Share this Post on:

How to Make Money in Stocks: A Winning System in Good Times and Bad.
It's one of my favorites.
I regularly share articles and other news of interest on:
Twitter (@investsafely)
Facebook (@InvestSafely)
LinkedIn (@Invest-Safely)
Instagram (@investsafely)
Invest Safely, LLC is an independent investment research and online financial media company. Use of Invest Safely, LLC and any other products available through invest-safely.com is subject to our Terms of Service and Privacy Policy. Not a recommendation to buy or sell any security.
Charts provided courtesy of stockcharts.com.
For historical Elliott Wave commentary and analysis, go to ELLIOTT WAVE lives on by Tony Caldaro. Current counts can be found at: Pretzel Logic, and 12345ABCDEWXYZ
Once a year, I review the market outlook signals as if they were a mechanical trading system, while pointing out issues and making adjustments. The goal is to give you to give you an example of how to analyze and continuously improve your own systems.
- 2015 Performance - Stock Market Outlook
- 2016 Performance - Stock Market Outlook
- 2017 Performance - Stock Market Outlook
- 2018 Performance - Stock Market Outlook
- 2019 Performance - Stock Market Outlook
- 2020 Performance - Stock Market Outlook
IMPORTANT DISCLOSURE INFORMATION
This material is for general communication and is provided for informational and/or educational purposes only. None of the content should be viewed as a suggestion that you take or refrain from taking any action nor as a recommendation for any specific investment product, strategy, or other such purpose. Certain information contained herein has been obtained from third-party sources believed to be reliable, but we cannot guarantee its accuracy or completeness.
To the extent that a reader has any questions regarding the applicability of any specific issue discussed above to his/her individual situation, he/she is encouraged to consult with the professional advisors of his/her choosing. Invest Safely, LLC is not a law firm, certified public accounting firm, or registered investment advisor and no portion of its content should be construed as legal, accounting, or investment advice.
The material is not to be construed as an offer or a recommendation to buy or sell a security nor is it to be construed as investment advice. Additionally, the material accessible through this website does not constitute a representation that the investments described herein are suitable or appropriate for any person.
Hypothetical Presentations:
Any referenced performance is “as calculated” using the referenced funds and has not been independently verified. This presentation does not discuss, directly or indirectly, the amount of the profits or losses, realized or unrealized, by any reader or contributor, from any specific funds or securities.
The author and/or any reader may have experienced materially different performance based upon various factors during the corresponding time periods. To the extent that any portion of the content reflects hypothetical results that were achieved by means of the retroactive application of a back-tested model, such results have inherent limitations, including:
Model results do not reflect the results of actual trading using assets, but were achieved by means of the retroactive application of the referenced models, certain aspects of which may have been designed with the benefit of hindsight
Back-tested performance may not reflect the impact that any material market or economic factors might have had on the use of a trading model if the model had been used during the period to actually manage assets
Actual investment results during the corresponding time periods may have been materially different from those portrayed in the model
Past performance may not be indicative of future results. Therefore, no one should assume that future performance will be profitable, or equal to any corresponding historical index.
The S&P 500 Composite Total Return Index (the "S&P") is a market capitalization-weighted index of 500 widely held stocks often used as a proxy for the stock market. Standard & Poor's chooses the member companies for the S&P based on market size, liquidity, and industry group representation. Included are the common stocks of industrial, financial, utility, and transportation companies. The S&P is not an index into which an investor can directly invest. The historical S&P performance results (and those of all other indices) are provided exclusively for comparison purposes only, so as to provide general comparative information to assist an individual in determining whether the performance of a specific portfolio or model meets, or continues to meet investment objective(s). The model and indices performance results do not reflect the impact of taxes.
Investing involves risk (even the “safe” kind)! Past performance does not guarantee or indicate future results. Different types of investments involve varying degrees of underlying risk. Therefore, do not assume that future performance of any specific investment or investment strategy be suitable for your portfolio or individual situation, will be profitable, equal any historical performance level(s), or prove successful (including the investments and/or investment strategies describe on this site).
Investing Process Links
Stabilize- Organize your $$$
- Manage your $$$
Plan
- Why You Invest
- Ways to Invest
- Where to Invest
- What to Invest In
Execute
- When to Invest
- How Much to Invest
- Buying & Selling
Monitor
- Track The Market
- Track Your Returns
Reflect & Adjust
- Improve Your Returns
- Adjust your Holdings
Popular Pages
- Jim Cramer- Personal Incomes Statements
- Hyperinflation
- Calculating Beta
- SMART Financial Goals
Blogroll
- Advisor Perspectives- Dividend Growth Investor
- Elliott Wave Lives On
- On My Radar | CMG Wealth
- Sure Dividend
- The Big Picture
- The Fat Pitch
- Thoughts from the Frontline
- Trader Feed
Sponsored Links
Invest Safely provides valuable, time-saving info about personal finance, money management, and investing.


