Stock Market Outlook
For The Week Of February 5th = Uptrend
INDICATORS
-
ADX Directional Indicators: Uptrend
Price & Volume Action: Uptrend
Elliott Wave Analysis: Mixed
The S&P500 ($SPX) rose 1.6% for the week. The index sits 4.5% above the 50-day and 4.7% above the 200-day, with those moving averages putting in a golden-cross midweek.
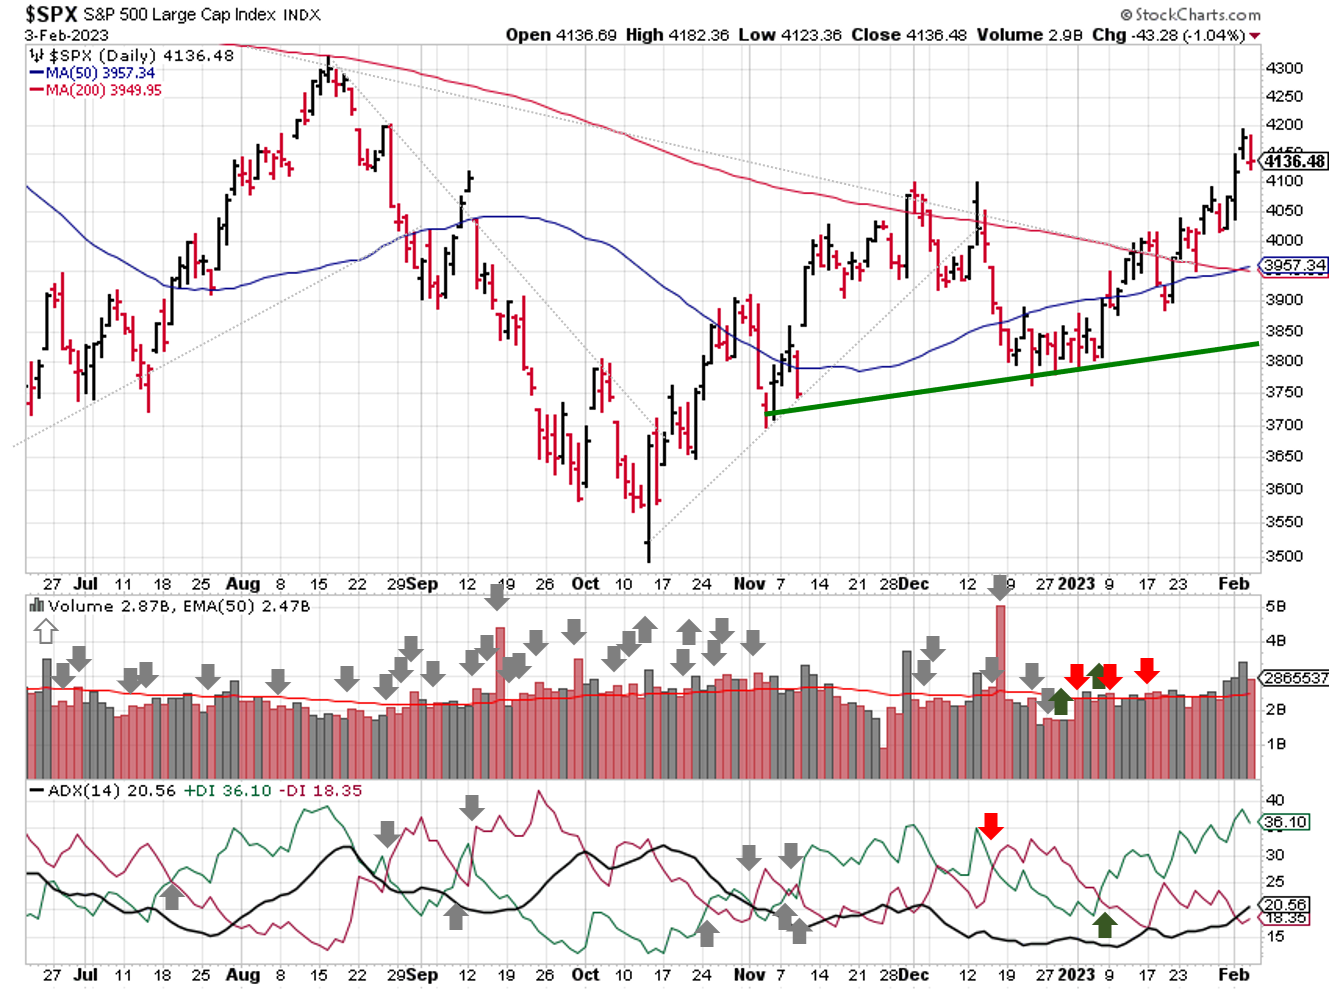
2023-02-05-SPX Trendline Analysis - Daily
The ADX shows a strengthening bullish trend, and price/volume action indicates a high level of institutional buying last week. The Elliott Wave signal moves to mixed, after the SPX rallied above 4100 and invalidated the prior, bearish wave count. The two alternative counts from last week (one bearish, one bullish) are now the primary candidates.
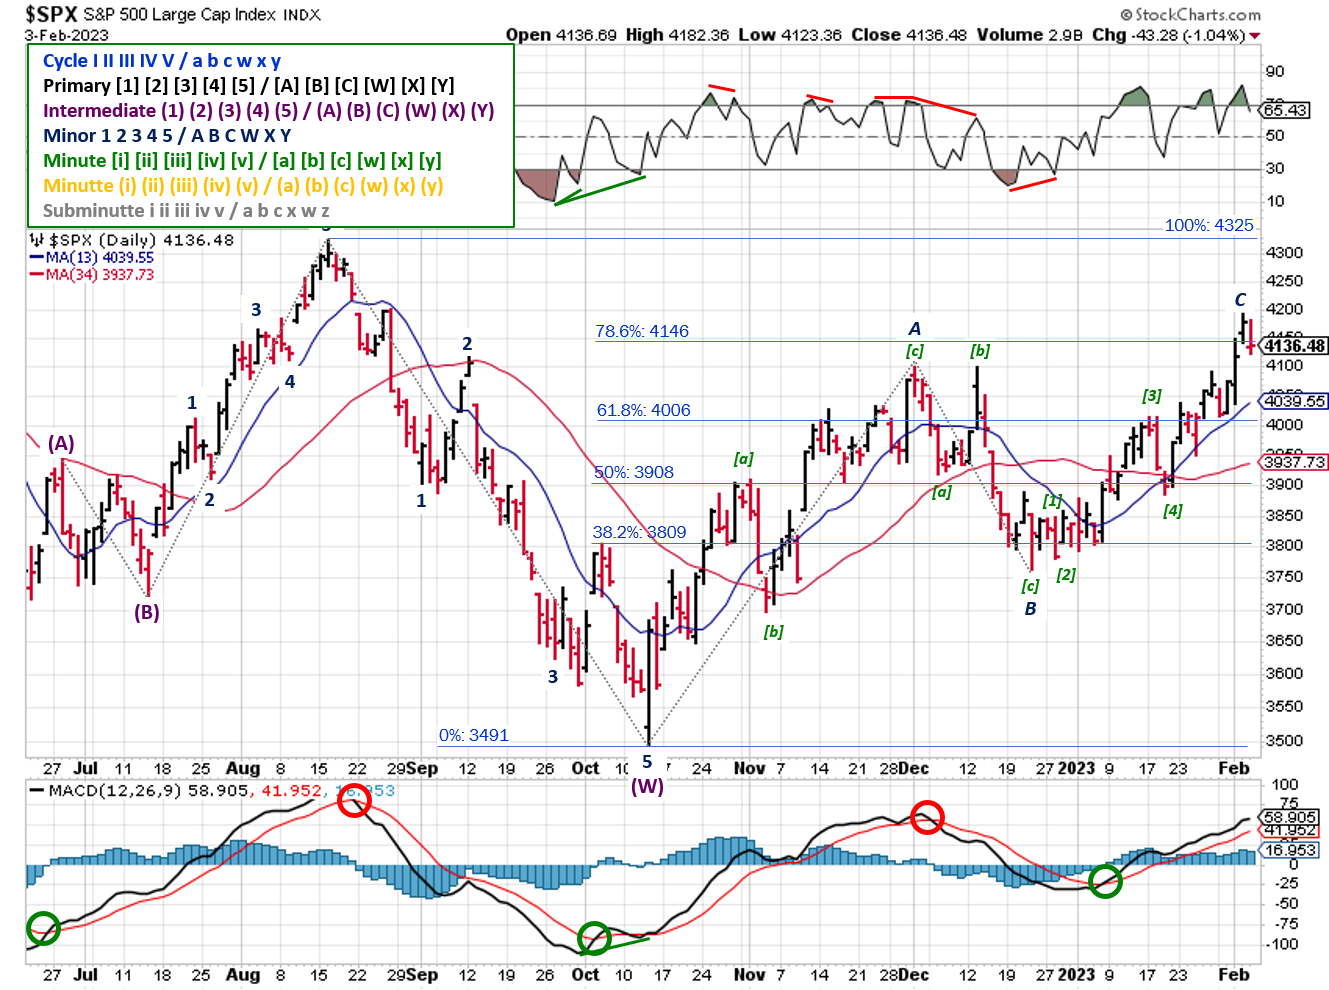
2023-02-05- SPX Elliott Wave Analysis - Daily - Primary Y
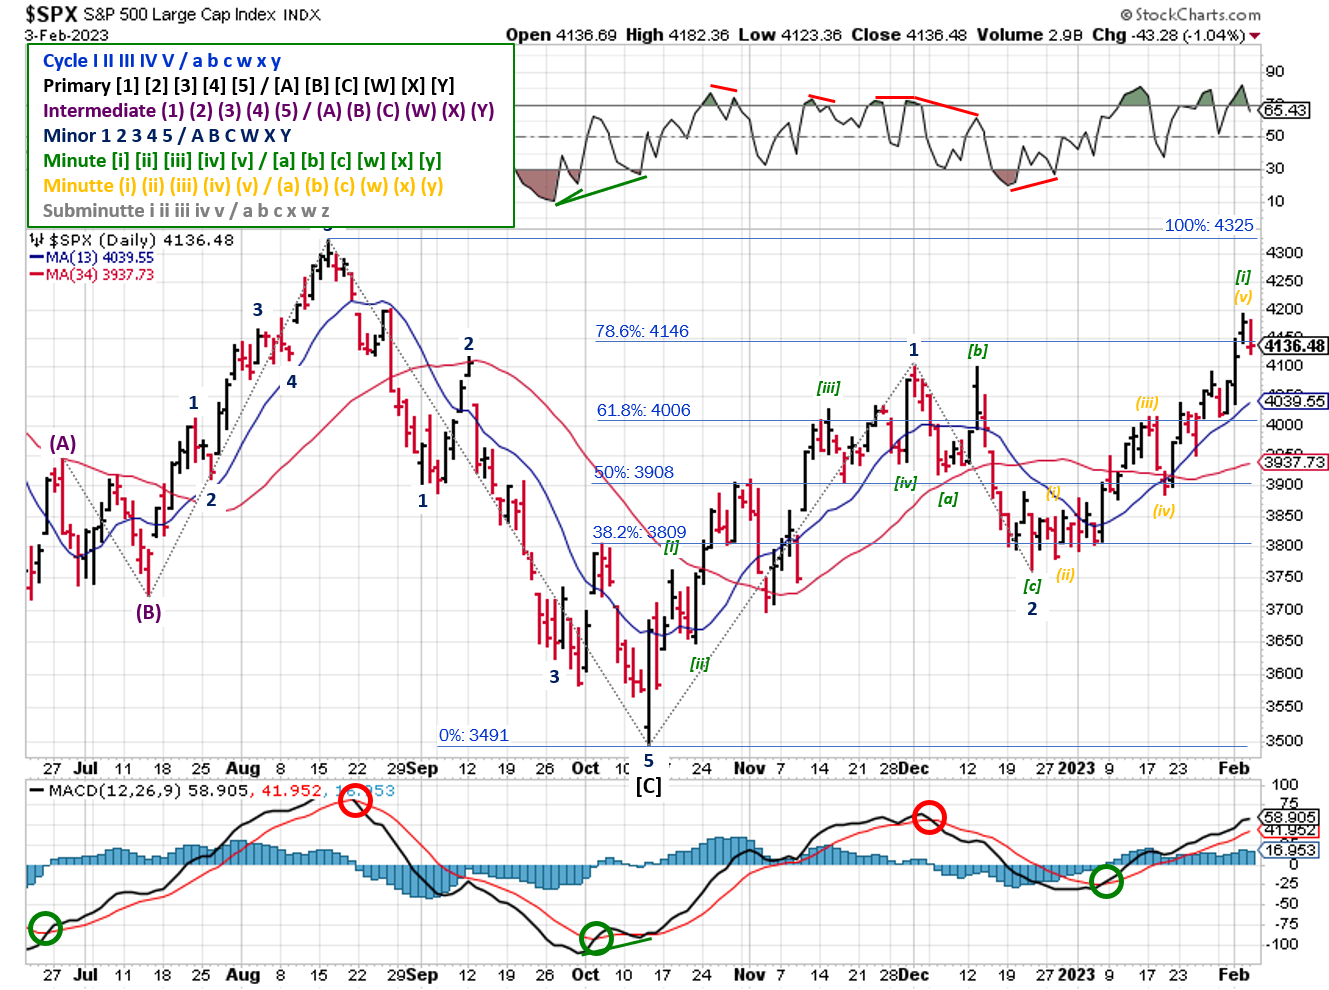
2023-02-05- SPX Elliott Wave Analysis - Daily - Primary 1
Clearly a bullish trend since October, but no confirmation of a new bull market or a continuing bear-market bounce. Within the criteria of the example process for these blog posts, Elliott Wave isn't providing much guidance...and serves as another of why multiple signals/duration are beneficial. Looking ahead, a drop below 3765 is needed to invalidate the bullish Minor 3 and validate the bearish count. Conversely, rising above 4325 invalidates the bearish Minor C.
COMMENTARY
Tuesday's 0.25% rate hike and FOMC press conference had something for doves and hawks, bulls and bears. The bears and hawks heard "higher for longer" and the potential for future increases. But U.S. stocks responded to Powell's dovish statement that "financial conditions had tightened considerably", and prices rallied on a bullish view that statement corresponded to future easing of interest rates and qualitative tightening.
Powell has another chance to manage his message this Tuesday, when he sits down for a discussion David Rubenstein at the Economic Club of Washington, D.C. (12:40pm)
Friday's non-farm payrolls report surprised everyone to the upside; +517K jobs versus estimates of +185k. Unemployment fell to the lowest level since 1969 (3.4%)! Media used the numbers as proof the labor market is strong and we're headed for a soft-landing and/or no recession. They neglected to mention all of the adjustments that were made to the NFP data, including: the annual benchmarking process, the NAICS 2022 conversion, the updating of seasonal adjustment factors, and updated population estimates.
Underneath the economic data, market participants witnessed another record level of trading in equity options. Thursday's trading session, in particular, was the highest volume EVER. As in never seen before...not during the tech bubble, not during the great recession...that kind of ever!
Without getting too technical, in the past, option activity hasn't influenced short-term market pricing in a major way. As liquidity is withdrawn from the financial system, institutional investors must compensate in order to maintain the same level of ROI. So they use leverage.
Currently, they're exploiting a loophole in brokerage rules, via zero-days-til-expiration (0DTE) options to add leverage to their strategies (and options are already leveraged instruments).
The added leverage forces dealers to buy and sell an abnormally large amount of the underlying stocks and indexes, thereby abnormally influencing market volumes and pricing. T1 Alpha has been all over the 0DTE phenomenon since October-November of 2022, and their free daily newsletter the source material for the above summary.
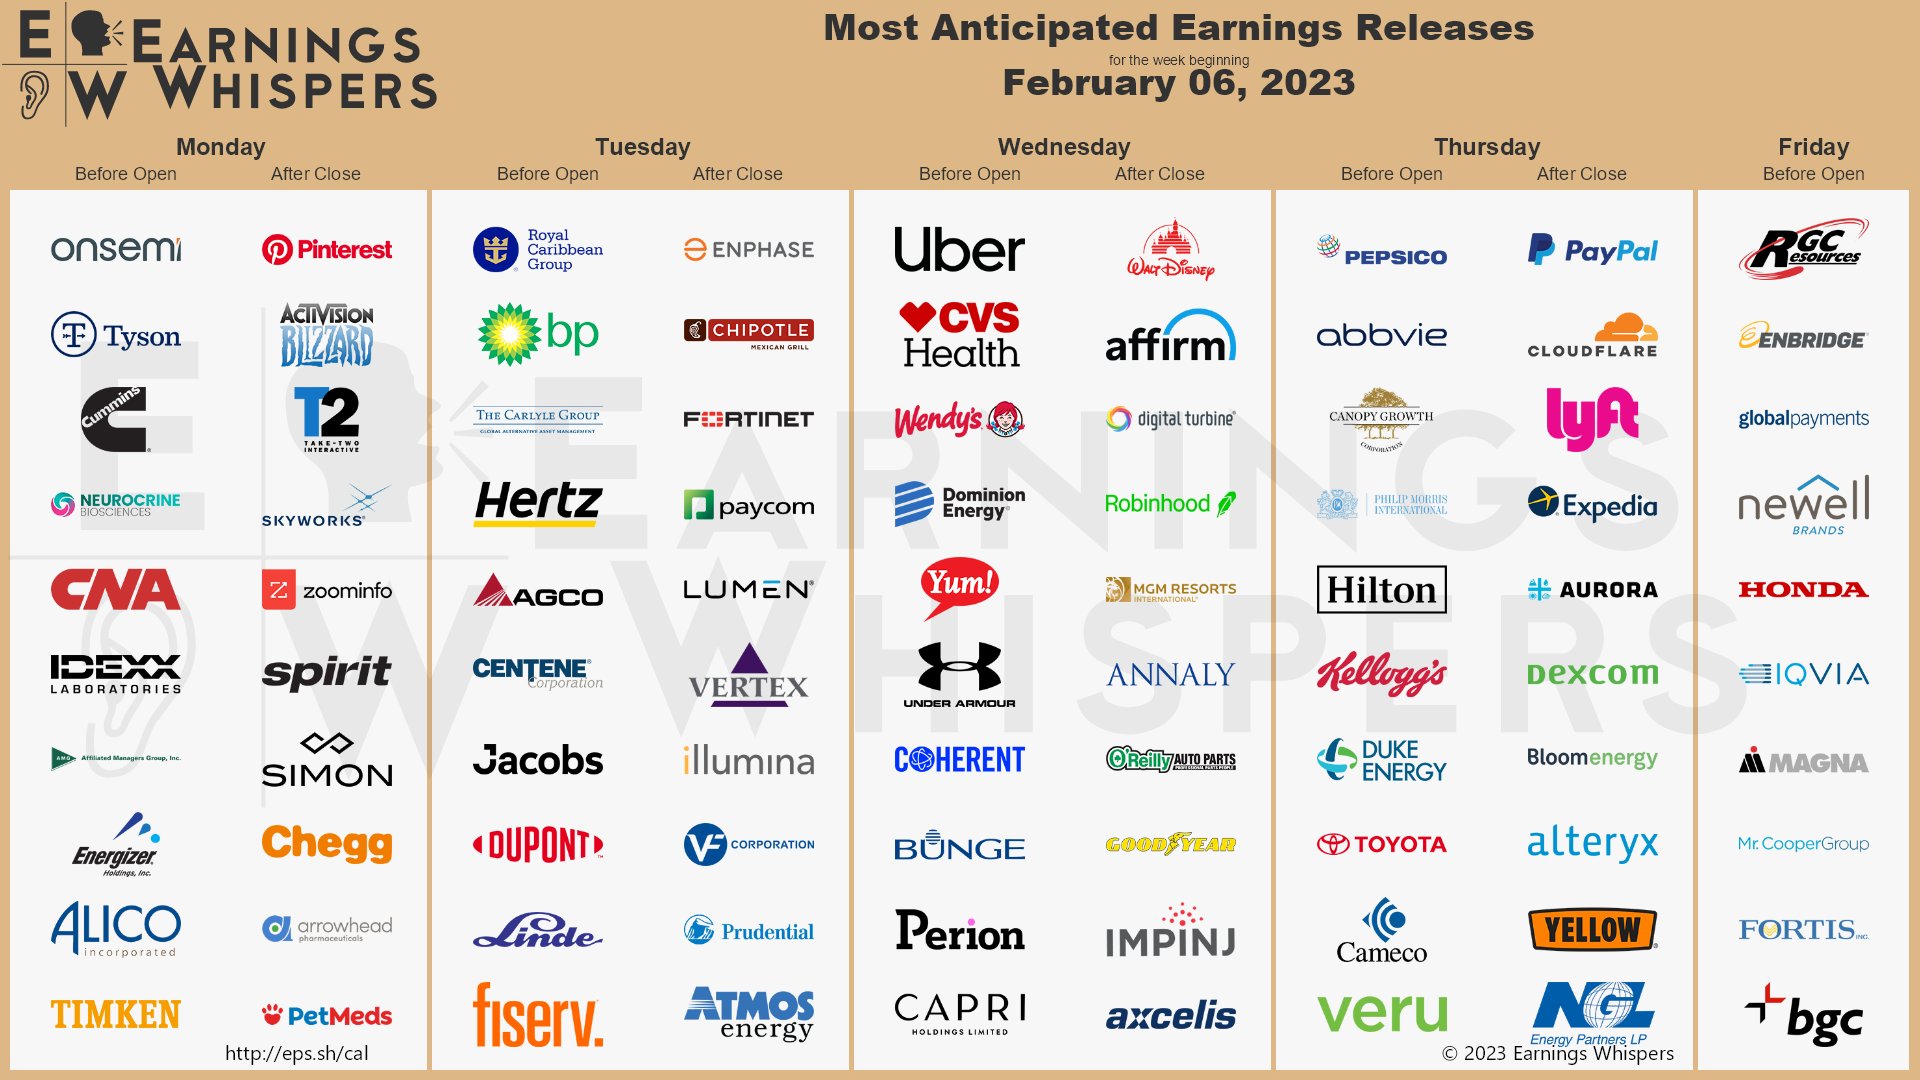
Meta/Facebook earnings were the star of the show last week, while Apple and Alphabet underperformed. A similar divergence occurred in the automotive space, with GM crushing estimates and Ford missing the mark. More earnings are on the way this week, including:
Best To Your Week!
P.S. If you find this research helpful, please tell a friend.
If you don't, tell an enemy.
Sources: Bloomberg, CNBC, Federal Reserve Bank of St. Louis, Hedgeye, U.S. Bureau of Economic Analysis, U.S. Bureau of Labor Statistics
Share this Post on:

How to Make Money in Stocks: A Winning System in Good Times and Bad.
It's one of my favorites.
I regularly share articles and other news of interest on:
Twitter (@investsafely)
Facebook (@InvestSafely)
LinkedIn (@Invest-Safely)
Instagram (@investsafely)
Invest Safely, LLC is an independent investment research and online financial media company. Use of Invest Safely, LLC and any other products available through invest-safely.com is subject to our Terms of Service and Privacy Policy. Not a recommendation to buy or sell any security.
Charts provided courtesy of stockcharts.com.
For historical Elliott Wave commentary and analysis, go to ELLIOTT WAVE lives on by Tony Caldaro. Current counts can be found at: Pretzel Logic, and 12345ABCDEWXYZ
Once a year, I review the market outlook signals as if they were a mechanical trading system, while pointing out issues and making adjustments. The goal is to give you to give you an example of how to analyze and continuously improve your own systems.
- 2015 Performance - Stock Market Outlook
- 2016 Performance - Stock Market Outlook
- 2017 Performance - Stock Market Outlook
- 2018 Performance - Stock Market Outlook
- 2019 Performance - Stock Market Outlook
- 2020 Performance - Stock Market Outlook
IMPORTANT DISCLOSURE INFORMATION
This material is for general communication and is provided for informational and/or educational purposes only. None of the content should be viewed as a suggestion that you take or refrain from taking any action nor as a recommendation for any specific investment product, strategy, or other such purpose. Certain information contained herein has been obtained from third-party sources believed to be reliable, but we cannot guarantee its accuracy or completeness.
To the extent that a reader has any questions regarding the applicability of any specific issue discussed above to his/her individual situation, he/she is encouraged to consult with the professional advisors of his/her choosing. Invest Safely, LLC is not a law firm, certified public accounting firm, or registered investment advisor and no portion of its content should be construed as legal, accounting, or investment advice.
The material is not to be construed as an offer or a recommendation to buy or sell a security nor is it to be construed as investment advice. Additionally, the material accessible through this website does not constitute a representation that the investments described herein are suitable or appropriate for any person.
Hypothetical Presentations:
Any referenced performance is “as calculated” using the referenced funds and has not been independently verified. This presentation does not discuss, directly or indirectly, the amount of the profits or losses, realized or unrealized, by any reader or contributor, from any specific funds or securities.
The author and/or any reader may have experienced materially different performance based upon various factors during the corresponding time periods. To the extent that any portion of the content reflects hypothetical results that were achieved by means of the retroactive application of a back-tested model, such results have inherent limitations, including:
Model results do not reflect the results of actual trading using assets, but were achieved by means of the retroactive application of the referenced models, certain aspects of which may have been designed with the benefit of hindsight
Back-tested performance may not reflect the impact that any material market or economic factors might have had on the use of a trading model if the model had been used during the period to actually manage assets
Actual investment results during the corresponding time periods may have been materially different from those portrayed in the model
Past performance may not be indicative of future results. Therefore, no one should assume that future performance will be profitable, or equal to any corresponding historical index.
The S&P 500 Composite Total Return Index (the "S&P") is a market capitalization-weighted index of 500 widely held stocks often used as a proxy for the stock market. Standard & Poor's chooses the member companies for the S&P based on market size, liquidity, and industry group representation. Included are the common stocks of industrial, financial, utility, and transportation companies. The S&P is not an index into which an investor can directly invest. The historical S&P performance results (and those of all other indices) are provided exclusively for comparison purposes only, so as to provide general comparative information to assist an individual in determining whether the performance of a specific portfolio or model meets, or continues to meet investment objective(s). The model and indices performance results do not reflect the impact of taxes.
Investing involves risk (even the “safe” kind)! Past performance does not guarantee or indicate future results. Different types of investments involve varying degrees of underlying risk. Therefore, do not assume that future performance of any specific investment or investment strategy be suitable for your portfolio or individual situation, will be profitable, equal any historical performance level(s), or prove successful (including the investments and/or investment strategies describe on this site).
Investing Process Links
Stabilize- Organize your $$$
- Manage your $$$
Plan
- Why You Invest
- Ways to Invest
- Where to Invest
- What to Invest In
Execute
- When to Invest
- How Much to Invest
- Buying & Selling
Monitor
- Track The Market
- Track Your Returns
Reflect & Adjust
- Improve Your Returns
- Adjust your Holdings
Popular Pages
- Jim Cramer- Personal Incomes Statements
- Hyperinflation
- Calculating Beta
- SMART Financial Goals
Blogroll
- Advisor Perspectives- Dividend Growth Investor
- Elliott Wave Lives On
- On My Radar | CMG Wealth
- Sure Dividend
- The Big Picture
- The Fat Pitch
- Thoughts from the Frontline
- Trader Feed
Sponsored Links
Invest Safely provides valuable, time-saving info about personal finance, money management, and investing.


