Stock Market Outlook
For The Week Of January 29th = Uptrend
INDICATORS
-
ADX Directional Indicators: Uptrend
Price & Volume Action: Uptrend
Elliott Wave Analysis: Downtrend
The S&P500 ($SPX) rose 2.5%, and broke above the long-term trendline that's acted as resistance since January 2022 (~16% decline). The index is up 6% for the month/year, with 2 trading days left in January. The NASDAQ was up 4.3% for the week, and sites 11% higher this month.
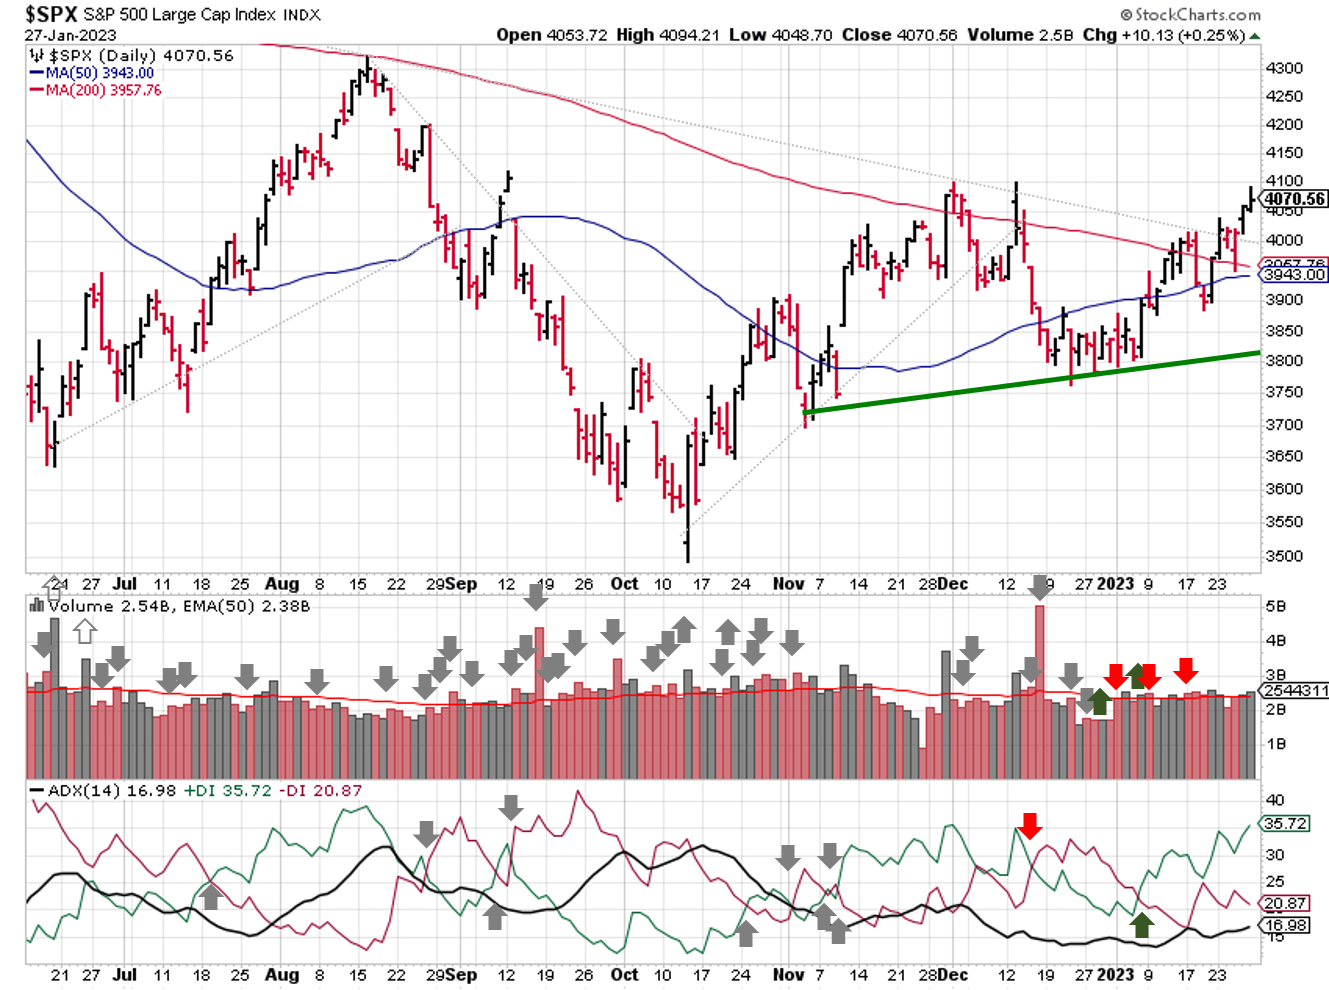
2023-01-29-SPX Trendline Analysis - Daily
The index found support at both the 50 and 200 day moving averages last week. The ADX and price volume signals continue to show bullish trends, and we're seeing a low level of institutional selling (only 3 distribution days over the past 5 weeks).
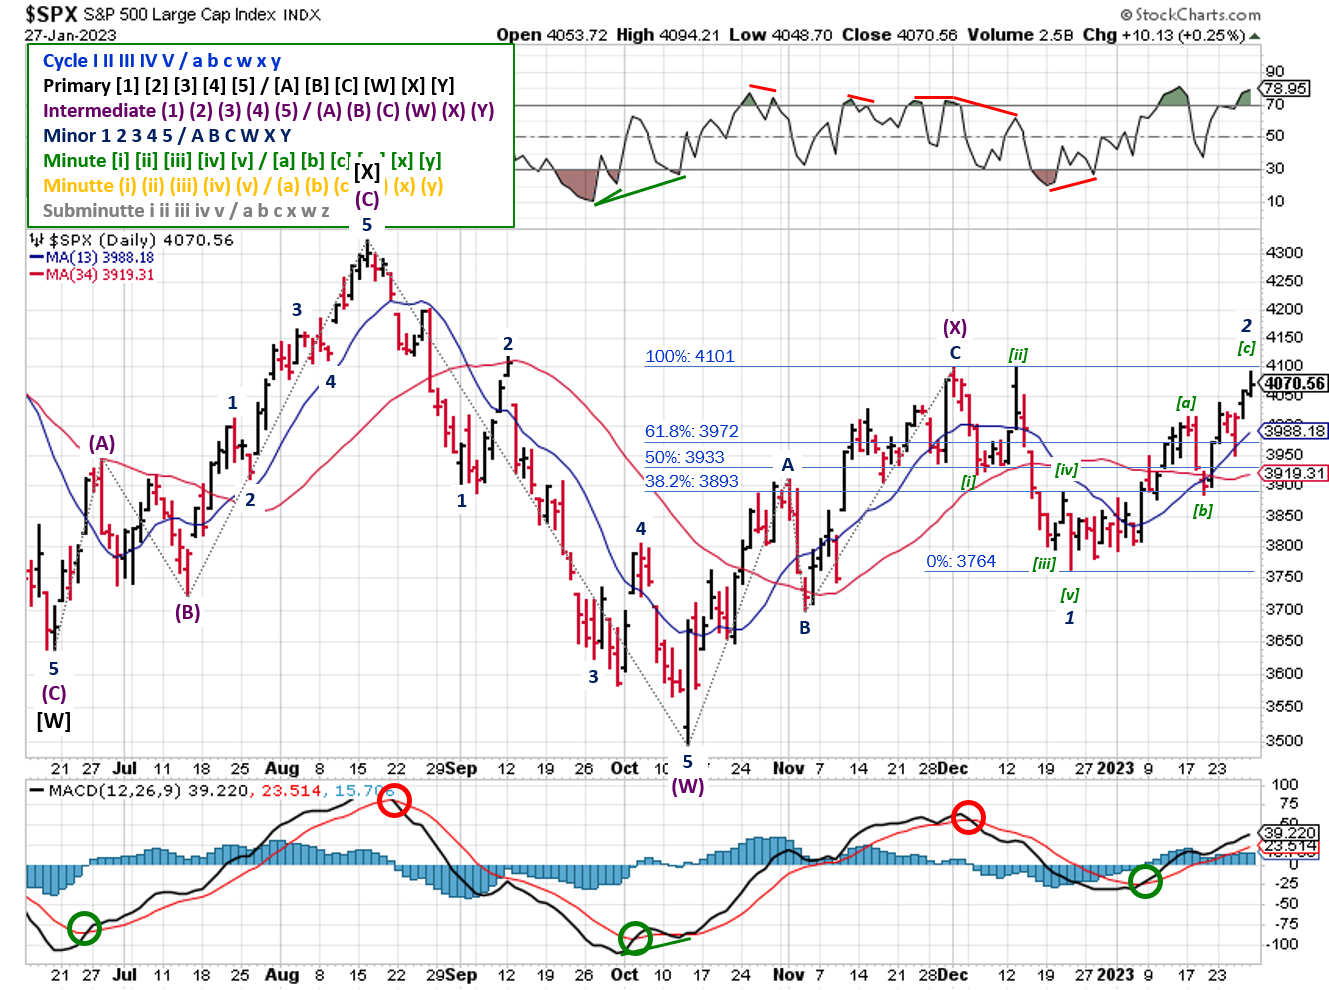
2023-01-29- SPX Elliott Wave Analysis - Daily - Primary Y
The Elliott Wave signal remains bearish; though rising above 4100 invalidates the current Minor 2 wave count. The SPX wasn't quite ready to head back toward the October low, putting in a head-fake 2 weeks ago and heading higher. A second wave can retrace 100% of a Wave 1 advance, so no relabeling of the waves just yet. Instead, two alternative counts (one bearish, one bullish) are presented at the end of the post for consideration.
COMMENTARY
So...GAME OVER bears? Sure feels that way...but feelings have no place in your investing process. So let's look at the data.
2022 Q4 GDP showed an annualized increase of 2.9% (BEA''s "advanced" estimate). On a year-over-year basis, GDP rose +1.0% vs. 2021 Q4, which is the smallest Y/Y increase this year.
December data for Consumption Expenditures (PCE) "dropped" to +5.0% Y/Y (vs. +5.5% in November). Core PCE came in at +4.4% Y/Y, down from +4.7% in November. For some perspective, 1989 was the last time Core PCE was at these levels. Care to guess how high the interest rates were? The Fed Funds Rate averaged 9.2% in 1989 (HT Hedgeye).
So U.S. economic data releases were middle of the road; nothing REALLY good or bad. Market participants took this as a sign that the Fed will be dovish at their meeting this week, in terms of their interest rate policy, and the broader indexes rallied.
That said, a ridiculous amount of option volume didn't hurt either; a quick look at U.S. Equity Options Volumes (NYSE), Friday's session saw the third highest trading volume since late 2019...regardless of type (weekly, monthly, quarterly). I suspect that the ranking applies even further back, but the data isn't immediately available. 0DTE index options played an oversized role (again). The takeaway is that leverage, via options, supports the recent rally, rather than underlying fundamental or economic changes.
Another big earnings week coming up. So far, ~25% of the S&P500 has reported Q4 earnings; Sales growth is up ~5%, earnings growth is down ~3%.
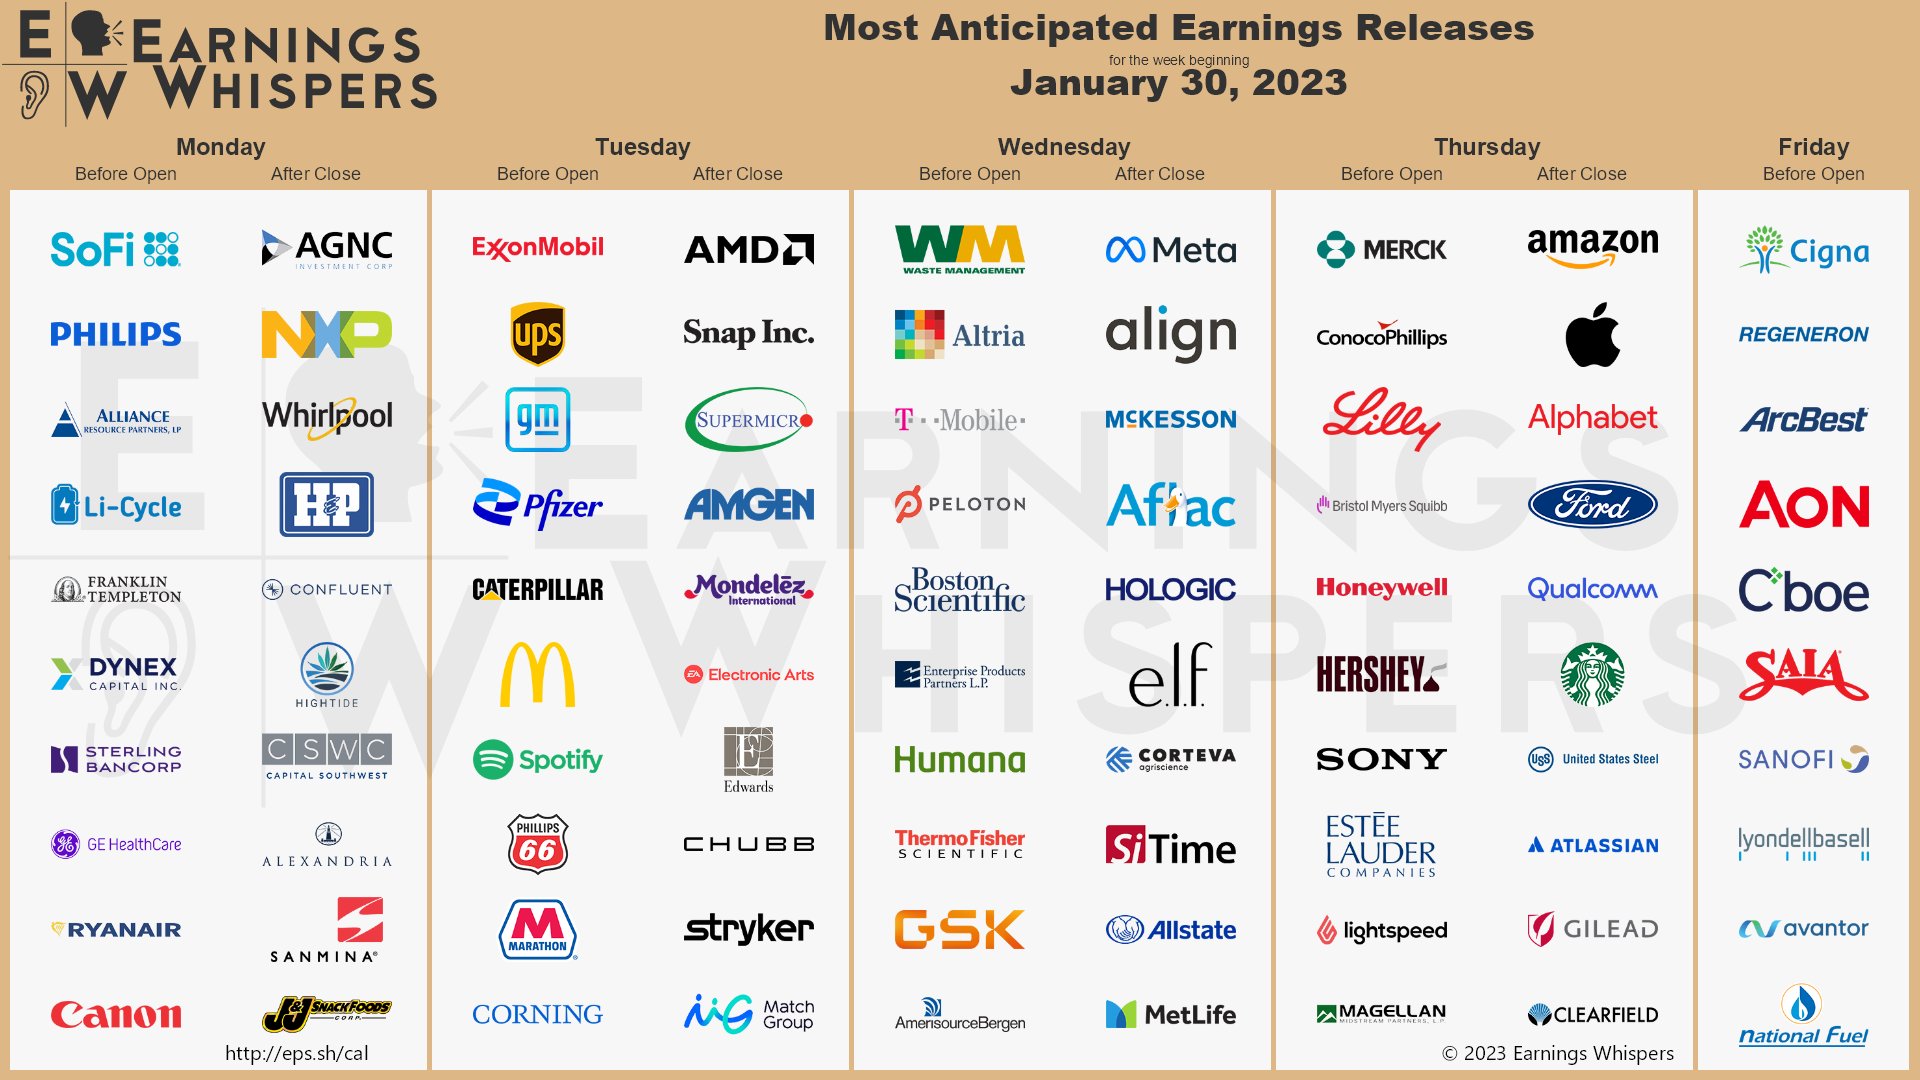
More importantly, at least from a market perspective, is the FOMC meeting this week (Tuesday) and subsequent interest rate announcement and news conference (Wednesday).
-
Earnings don't move the overall market; it's the Federal Reserve Board... focus on the central banks, and focus on the movement of liquidity... most people in the market are looking for earnings and conventional measures. It's liquidity that moves markets.
--Stanley Druckenmiller
In my opinion, the bear market isn't over; it's hibernating. But as Ed Seykota said, “The trend is your friend...until the end when it bends." So far, the data from January says the trend is up.
Best To Your Week!

Extended Intermediate (X) Wave (Bearish Alternative)
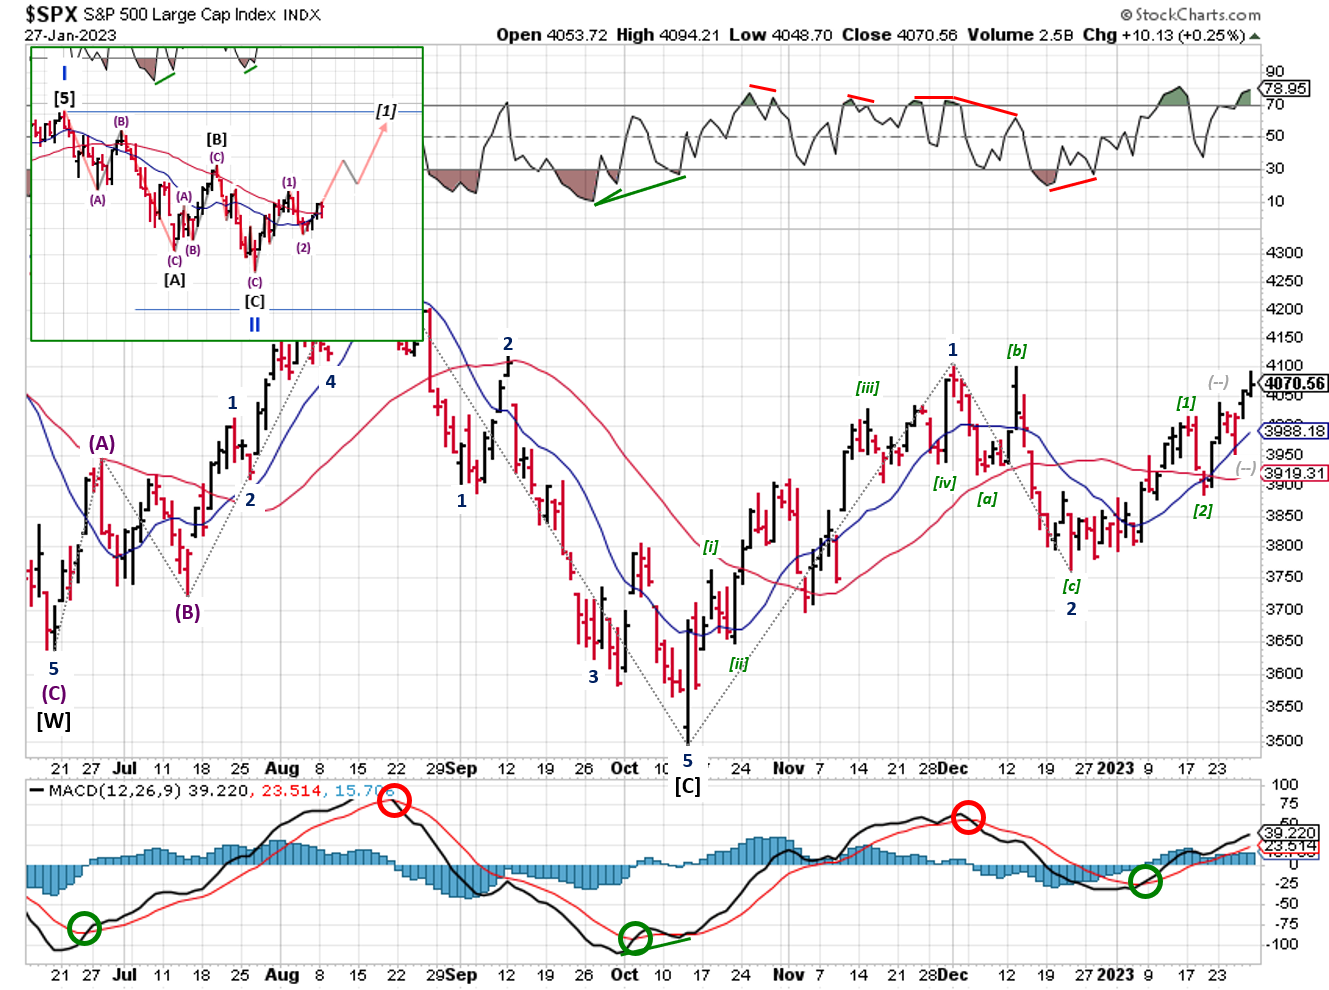
Primary [1] In Progress (Bullish Alternative)
P.S. If you find this research helpful, please tell a friend.
If you don't, tell an enemy.
Sources: Bloomberg, CNBC, Federal Reserve Bank of St. Louis, Hedgeye, U.S. Bureau of Economic Analysis, U.S. Bureau of Labor Statistics
Share this Post on:

How to Make Money in Stocks: A Winning System in Good Times and Bad.
It's one of my favorites.
I regularly share articles and other news of interest on:
Twitter (@investsafely)
Facebook (@InvestSafely)
LinkedIn (@Invest-Safely)
Instagram (@investsafely)
Invest Safely, LLC is an independent investment research and online financial media company. Use of Invest Safely, LLC and any other products available through invest-safely.com is subject to our Terms of Service and Privacy Policy. Not a recommendation to buy or sell any security.
Charts provided courtesy of stockcharts.com.
For historical Elliott Wave commentary and analysis, go to ELLIOTT WAVE lives on by Tony Caldaro. Current counts can be found at: Pretzel Logic, and 12345ABCDEWXYZ
Once a year, I review the market outlook signals as if they were a mechanical trading system, while pointing out issues and making adjustments. The goal is to give you to give you an example of how to analyze and continuously improve your own systems.
- 2015 Performance - Stock Market Outlook
- 2016 Performance - Stock Market Outlook
- 2017 Performance - Stock Market Outlook
- 2018 Performance - Stock Market Outlook
- 2019 Performance - Stock Market Outlook
- 2020 Performance - Stock Market Outlook
IMPORTANT DISCLOSURE INFORMATION
This material is for general communication and is provided for informational and/or educational purposes only. None of the content should be viewed as a suggestion that you take or refrain from taking any action nor as a recommendation for any specific investment product, strategy, or other such purpose. Certain information contained herein has been obtained from third-party sources believed to be reliable, but we cannot guarantee its accuracy or completeness.
To the extent that a reader has any questions regarding the applicability of any specific issue discussed above to his/her individual situation, he/she is encouraged to consult with the professional advisors of his/her choosing. Invest Safely, LLC is not a law firm, certified public accounting firm, or registered investment advisor and no portion of its content should be construed as legal, accounting, or investment advice.
The material is not to be construed as an offer or a recommendation to buy or sell a security nor is it to be construed as investment advice. Additionally, the material accessible through this website does not constitute a representation that the investments described herein are suitable or appropriate for any person.
Hypothetical Presentations:
Any referenced performance is “as calculated” using the referenced funds and has not been independently verified. This presentation does not discuss, directly or indirectly, the amount of the profits or losses, realized or unrealized, by any reader or contributor, from any specific funds or securities.
The author and/or any reader may have experienced materially different performance based upon various factors during the corresponding time periods. To the extent that any portion of the content reflects hypothetical results that were achieved by means of the retroactive application of a back-tested model, such results have inherent limitations, including:
Model results do not reflect the results of actual trading using assets, but were achieved by means of the retroactive application of the referenced models, certain aspects of which may have been designed with the benefit of hindsight
Back-tested performance may not reflect the impact that any material market or economic factors might have had on the use of a trading model if the model had been used during the period to actually manage assets
Actual investment results during the corresponding time periods may have been materially different from those portrayed in the model
Past performance may not be indicative of future results. Therefore, no one should assume that future performance will be profitable, or equal to any corresponding historical index.
The S&P 500 Composite Total Return Index (the "S&P") is a market capitalization-weighted index of 500 widely held stocks often used as a proxy for the stock market. Standard & Poor's chooses the member companies for the S&P based on market size, liquidity, and industry group representation. Included are the common stocks of industrial, financial, utility, and transportation companies. The S&P is not an index into which an investor can directly invest. The historical S&P performance results (and those of all other indices) are provided exclusively for comparison purposes only, so as to provide general comparative information to assist an individual in determining whether the performance of a specific portfolio or model meets, or continues to meet investment objective(s). The model and indices performance results do not reflect the impact of taxes.
Investing involves risk (even the “safe” kind)! Past performance does not guarantee or indicate future results. Different types of investments involve varying degrees of underlying risk. Therefore, do not assume that future performance of any specific investment or investment strategy be suitable for your portfolio or individual situation, will be profitable, equal any historical performance level(s), or prove successful (including the investments and/or investment strategies describe on this site).
Investing Process Links
Stabilize- Organize your $$$
- Manage your $$$
Plan
- Why You Invest
- Ways to Invest
- Where to Invest
- What to Invest In
Execute
- When to Invest
- How Much to Invest
- Buying & Selling
Monitor
- Track The Market
- Track Your Returns
Reflect & Adjust
- Improve Your Returns
- Adjust your Holdings
Popular Pages
- Jim Cramer- Personal Incomes Statements
- Hyperinflation
- Calculating Beta
- SMART Financial Goals
Blogroll
- Advisor Perspectives- Dividend Growth Investor
- Elliott Wave Lives On
- On My Radar | CMG Wealth
- Sure Dividend
- The Big Picture
- The Fat Pitch
- Thoughts from the Frontline
- Trader Feed
Sponsored Links
Invest Safely provides valuable, time-saving info about personal finance, money management, and investing.


