Stock Market Outlook
For The Week Of November 20th = Uptrend
INDICATORS
-
ADX Directional Indicators: Uptrend
Price & Volume Action: Uptrend
Elliott Wave Analysis: Downtrend
The S&P500 ($SPX) fell 0.7% for the week, with trading volume well below average. The index currently sits ~4.5% above the 50-day and ~2.5% below the 200 day moving average.
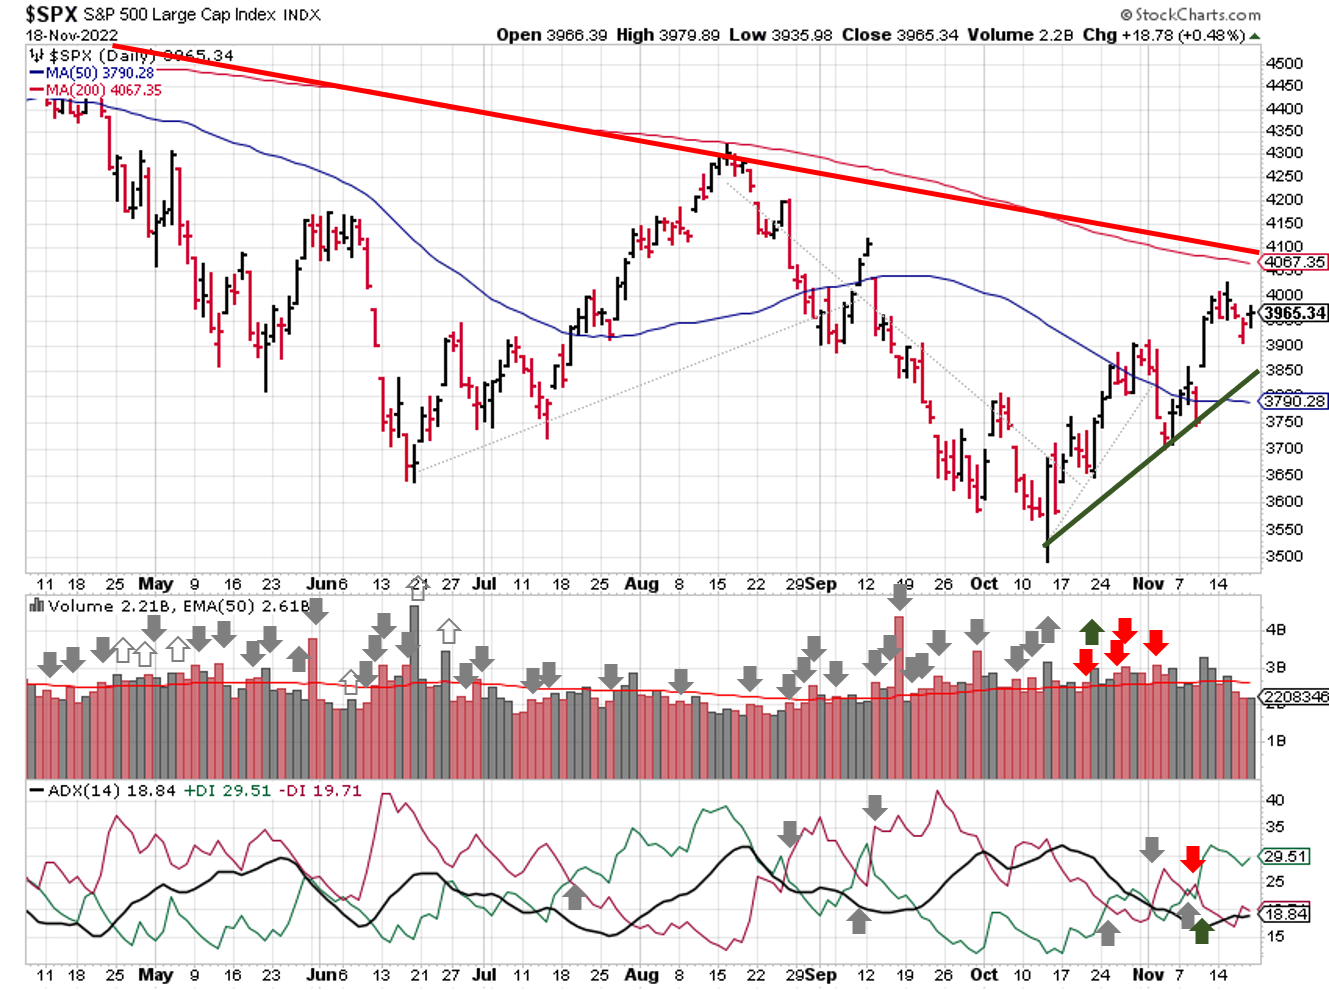
2022-11-20-SPX Trendline Analysis - Daily
The ADX signal stayed in bullish territory all week, as did price & volume. Elliott Wave analysis shows the SPX bouncing between the 50% and 61.8% Fibonacci levels of the Intermediate (W) wave, as the index enters the final stage of the counter-trend Minor C wave.
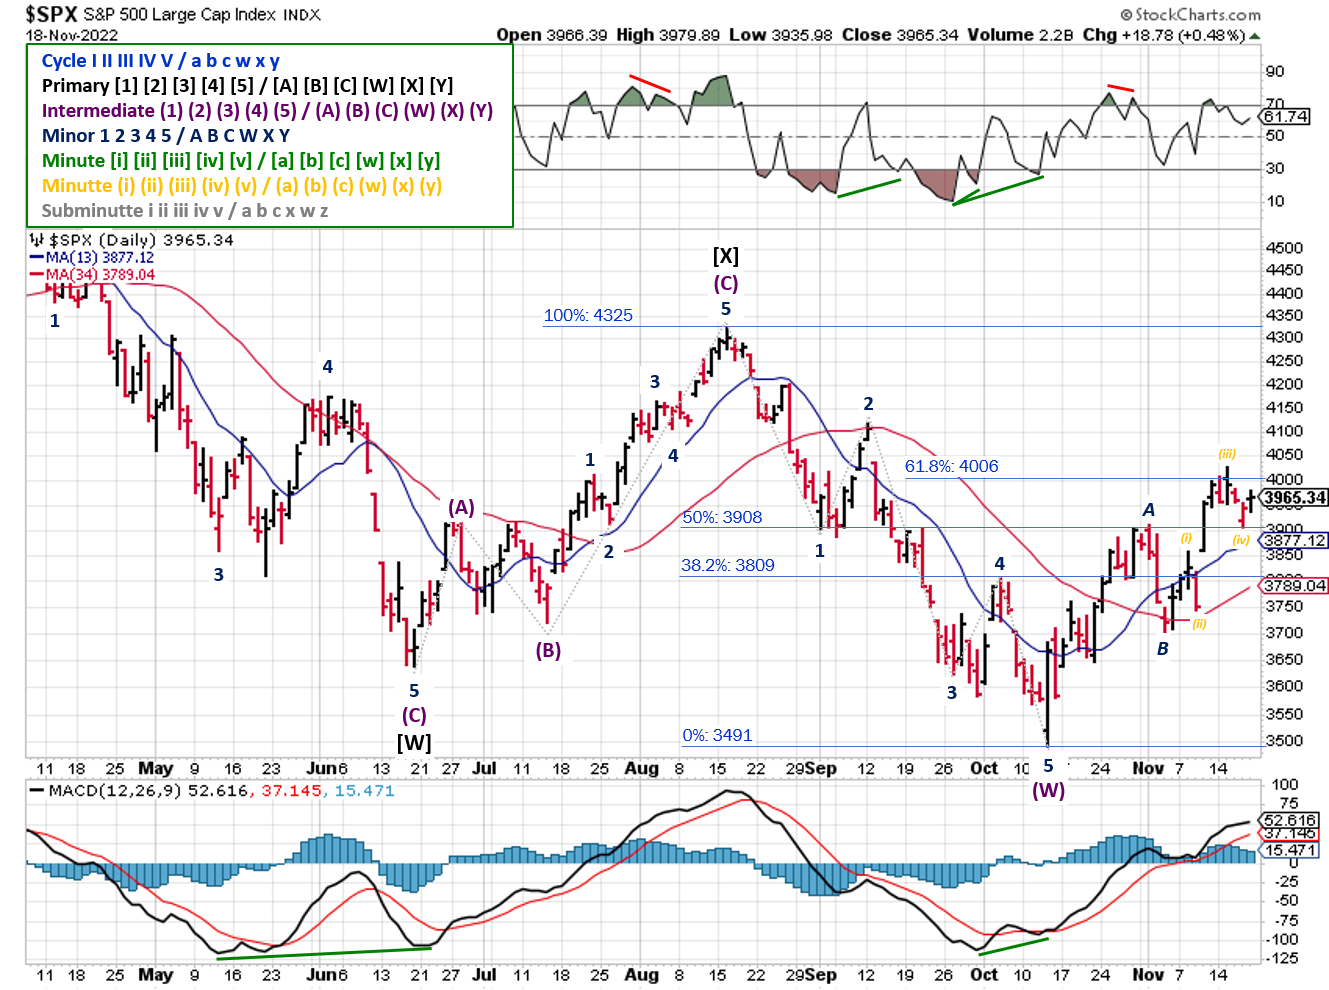
2022-11-20- SPX Elliott Wave Analysis - Daily - Primary Y
Looking at the longer-term, weekly view, shows the SPX just below the 34-week moving average, which has been a reliable place to capture profits since the downtrend began in January.
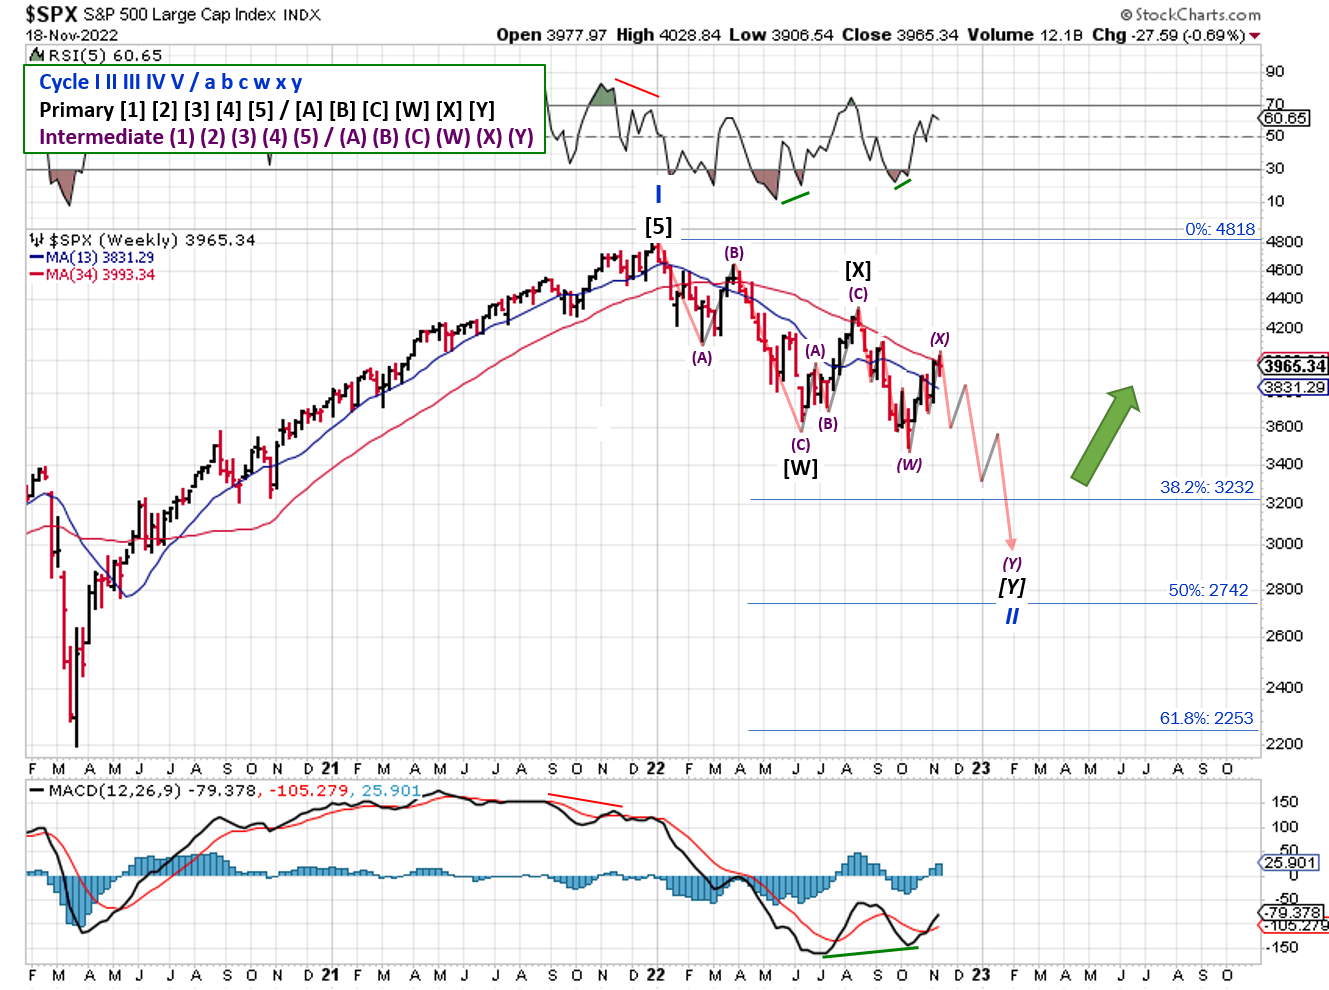
2022-11-20- SPX Elliott Wave Analysis - Weekly - Primary Y
COMMENTARY
Q3 earnings season is winding down, with 476 companies in the S&P500 reporting as of Friday morning.
On average, revenue (sales) grew ~12% year over year, slightly lower than last quarter (14%). The minor decrease shows that higher prices haven't completely crushed demand just yet. But consumer credit data shows that we're using more debt to sustain those purchases.
Average earnings only grew ~3% year over year, falling from ~8% last quarter, and shows the impact of inflation on the cost of doing business (i.e. increases in salaries, raw material, etc.).
In both quarters, the energy sector skewed average performance significantly. Sales were up 77% and 50%, while earnings increased 305% and 150% (Q2 & Q3 respectively).
The overall narrative is that earnings weren't as bad as feared. I'm not sure that tech stock investors would agree, but in general it's true. Unfortunately, a good deal of the recent market rally is likely the result of US dollar weakness.
In fact, the negative correlation of the SPX to USD has been more -90% over the past 30 days! That's A LOT.

Looking forward doesn't improve the picture, because the U.S. yield curve is inverted and continues to signal "recession is coming". Here are the rates across the curve as of Friday:
- 3 Month = 4.34
- 2 Year = 4.51
- 5 Year = 3.99
- 10 Year = 3.82
- 30 Year = 3.92
Those rates put the inversion of the 10-year treasuries and 2-year treasuries (10s & 2s) at -0.69. That's the biggest inversion since 1981; bigger than 1989, 2000, 2007, and 2019.

https://fred.stlouisfed.org/series/T10Y2Y
The 10/2 spread from Dec 1976 to Dec 1978 looks very similar to our current run from the March 2021 peak. It's an important callout, because we know that the current Federal Reserve thinks the 1980s Fed stopped raising rates "too soon" because of recession fears. So this time around, we may see a recession before we get interest rate relief.
A light week coming up, with U.S. markets closed on Thursday and closing early on Friday for the Thanksgiving holiday.
Best To Your Week and Have a Happy Thanksgiving!
Best To Your Week!
P.S. If you find this research helpful, please tell a friend.
If you don't, tell an enemy.
Sources: Bloomberg, CNBC, Federal Reserve Bank of St. Louis, Hedgeye, U.S. Bureau of Economic Analysis, U.S. Bureau of Economic Analysis
Share this Post on:

How to Make Money in Stocks: A Winning System in Good Times and Bad.
It's one of my favorites.
I regularly share articles and other news of interest on:
Twitter (@investsafely)
Facebook (@InvestSafely)
LinkedIn (@Invest-Safely)
Instagram (@investsafely)
Invest Safely, LLC is an independent investment research and online financial media company. Use of Invest Safely, LLC and any other products available through invest-safely.com is subject to our Terms of Service and Privacy Policy. Not a recommendation to buy or sell any security.
Charts provided courtesy of stockcharts.com.
For historical Elliott Wave commentary and analysis, go to ELLIOTT WAVE lives on by Tony Caldaro. Current counts can be found at: Pretzel Logic, and 12345ABCDEWXYZ
Once a year, I review the market outlook signals as if they were a mechanical trading system, while pointing out issues and making adjustments. The goal is to give you to give you an example of how to analyze and continuously improve your own systems.
- 2015 Performance - Stock Market Outlook
- 2016 Performance - Stock Market Outlook
- 2017 Performance - Stock Market Outlook
- 2018 Performance - Stock Market Outlook
- 2019 Performance - Stock Market Outlook
- 2020 Performance - Stock Market Outlook
IMPORTANT DISCLOSURE INFORMATION
This material is for general communication and is provided for informational and/or educational purposes only. None of the content should be viewed as a suggestion that you take or refrain from taking any action nor as a recommendation for any specific investment product, strategy, or other such purpose. Certain information contained herein has been obtained from third-party sources believed to be reliable, but we cannot guarantee its accuracy or completeness.
To the extent that a reader has any questions regarding the applicability of any specific issue discussed above to his/her individual situation, he/she is encouraged to consult with the professional advisors of his/her choosing. Invest Safely, LLC is not a law firm, certified public accounting firm, or registered investment advisor and no portion of its content should be construed as legal, accounting, or investment advice.
The material is not to be construed as an offer or a recommendation to buy or sell a security nor is it to be construed as investment advice. Additionally, the material accessible through this website does not constitute a representation that the investments described herein are suitable or appropriate for any person.
Hypothetical Presentations:
Any referenced performance is “as calculated” using the referenced funds and has not been independently verified. This presentation does not discuss, directly or indirectly, the amount of the profits or losses, realized or unrealized, by any reader or contributor, from any specific funds or securities.
The author and/or any reader may have experienced materially different performance based upon various factors during the corresponding time periods. To the extent that any portion of the content reflects hypothetical results that were achieved by means of the retroactive application of a back-tested model, such results have inherent limitations, including:
Model results do not reflect the results of actual trading using assets, but were achieved by means of the retroactive application of the referenced models, certain aspects of which may have been designed with the benefit of hindsight
Back-tested performance may not reflect the impact that any material market or economic factors might have had on the use of a trading model if the model had been used during the period to actually manage assets
Actual investment results during the corresponding time periods may have been materially different from those portrayed in the model
Past performance may not be indicative of future results. Therefore, no one should assume that future performance will be profitable, or equal to any corresponding historical index.
The S&P 500 Composite Total Return Index (the "S&P") is a market capitalization-weighted index of 500 widely held stocks often used as a proxy for the stock market. Standard & Poor's chooses the member companies for the S&P based on market size, liquidity, and industry group representation. Included are the common stocks of industrial, financial, utility, and transportation companies. The S&P is not an index into which an investor can directly invest. The historical S&P performance results (and those of all other indices) are provided exclusively for comparison purposes only, so as to provide general comparative information to assist an individual in determining whether the performance of a specific portfolio or model meets, or continues to meet investment objective(s). The model and indices performance results do not reflect the impact of taxes.
Investing involves risk (even the “safe” kind)! Past performance does not guarantee or indicate future results. Different types of investments involve varying degrees of underlying risk. Therefore, do not assume that future performance of any specific investment or investment strategy be suitable for your portfolio or individual situation, will be profitable, equal any historical performance level(s), or prove successful (including the investments and/or investment strategies describe on this site).
Investing Process Links
Stabilize- Organize your $$$
- Manage your $$$
Plan
- Why You Invest
- Ways to Invest
- Where to Invest
- What to Invest In
Execute
- When to Invest
- How Much to Invest
- Buying & Selling
Monitor
- Track The Market
- Track Your Returns
Reflect & Adjust
- Improve Your Returns
- Adjust your Holdings
Popular Pages
- Jim Cramer- Personal Incomes Statements
- Hyperinflation
- Calculating Beta
- SMART Financial Goals
Blogroll
- Advisor Perspectives- Dividend Growth Investor
- Elliott Wave Lives On
- On My Radar | CMG Wealth
- Sure Dividend
- The Big Picture
- The Fat Pitch
- Thoughts from the Frontline
- Trader Feed
Sponsored Links
Invest Safely provides valuable, time-saving info about personal finance, money management, and investing.


