Stock Market Outlook
For The Week Of October 16th = Downtrend
INDICATORS
-
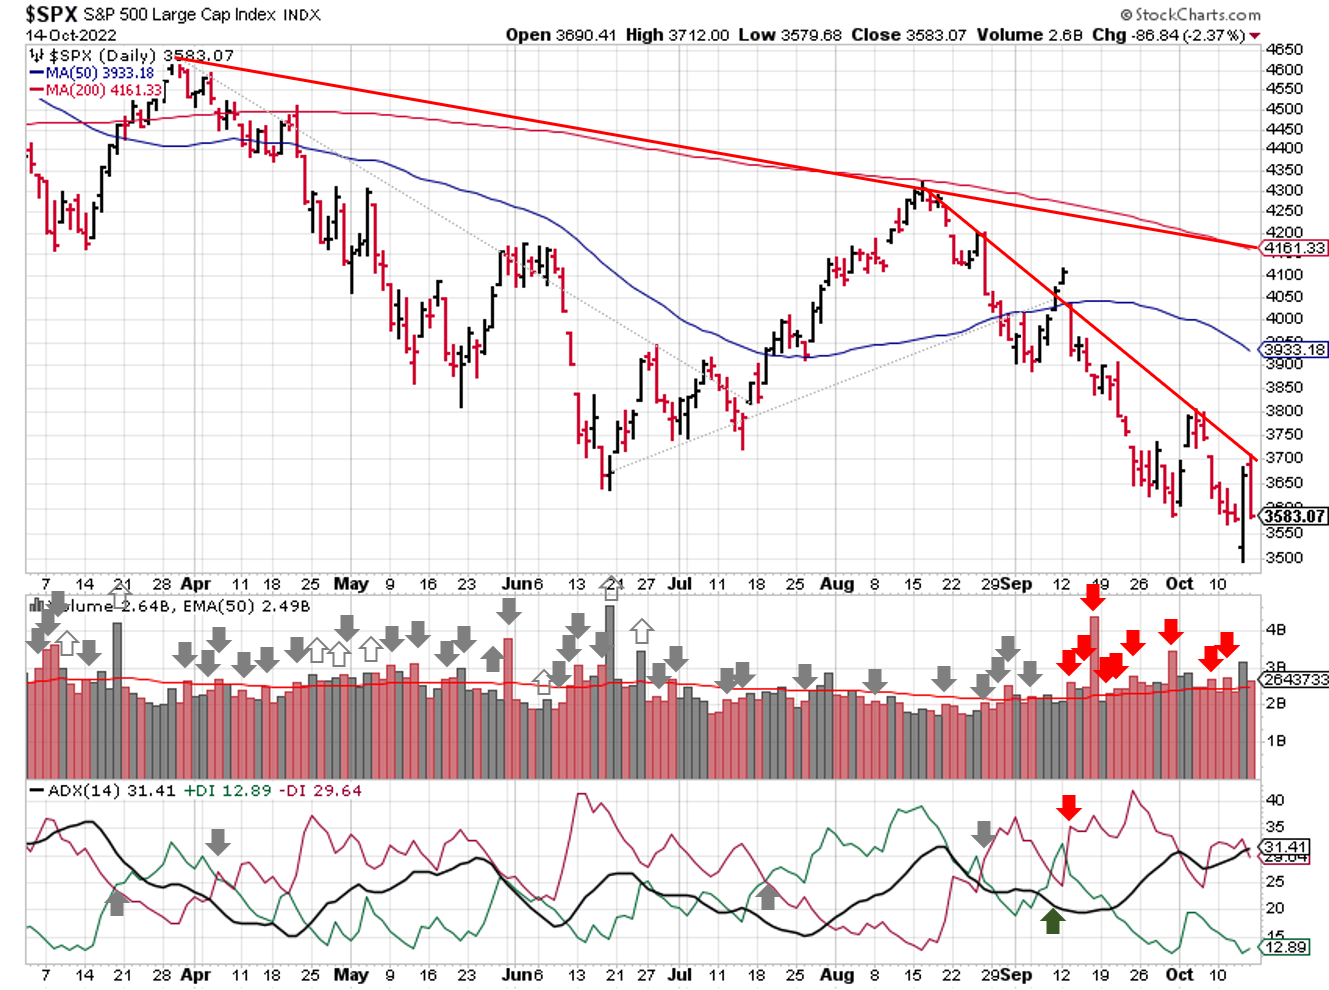
ADX Directional Indicators: Downtrend
Price & Volume Action: Downtrend
Elliott Wave Analysis: Downtrend
The S&P500 ($SPX) rose 1.5% last week, but that seems pretty tame considering its ~6% gain mid-week. The index closed ~10% below the 50-day and ~15% below the 200-day moving average.
2022-10-16-SPX Trendline Analysis - Daily
The ADX? Still bearish. Price/volume remains in a downtrend for now. Thursday’s reversal counts as “Day 1” of a potential rally. The most robust rally confirmations (>1.5% increase on higher than average trading volume) typically occur between Day 4 and Day 10, so be on the lookout next week.
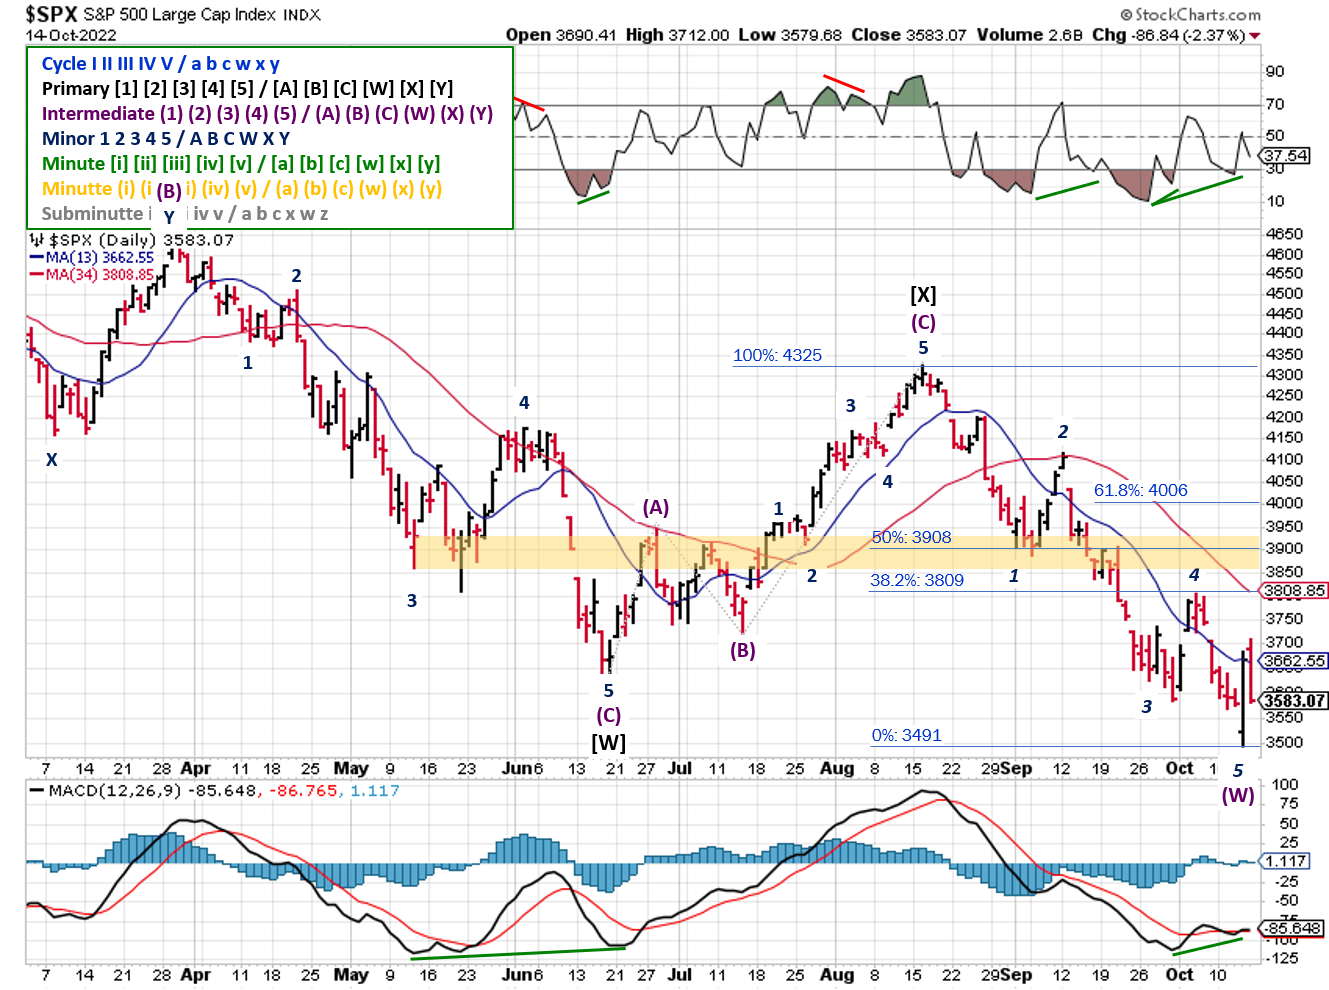
2022-10-16- SPX Elliott Wave Analysis - Daily - Primary Y
After diving below the September low, Elliott Wave appears to show a completed 5-waves pattern. That view is supported by positive divergences in both the RSI and MACD technical indicators. The 5th wave looks compressed, time-wise, but that's to be expected during highly volatility trading periods (VIX > 30).
If the count holds, a 3-wave, counter-trend rally is in play. It’s possible to have a full retracement, back to 4325, but that seems unlikely given current economic conditions. 3900 is a 50% retracement of the August high and represents a ~9% rally from Friday's close. It's also back in that middle of the May-June, July resistance “band”. That's just enough of a countertrend rally get bullish investors back into stocks before the next rug pull.
COMMENTARY
Another U.S. CPI report, another higher than expected reading.
- CPI
- +0.4% MoM; +0.2% expected
- +8.2% YoY; +8.1% expected
- Core CPI
- +0.6% MoM; +0.4% expected
- +6.6% YoY; +6.5% expected
Even though the Fed really cares about PCE, elevated CPI readings provide more cover for interest rate hikes at the next Federal Reserve meeting. It also destroys the "peak inflation" rationale for any market bounces.
Peak inflation or not, the debt market is signaling more pain ahead for the economy and investors. The yield curve inverted even further to -52 basis points or -0.52% (2 year vs. 10 year treasuries). That's the biggest inversion since the early 80's! How many of today's advisors were managing money back then? How many were even born back then?
It's not just a U.S. phenomenon either; per the World Government Bonds website, 18 countries have an inverted yield curve, including:
- Chile
- Canada
- Czech Republic
- Hong Kong
- United States
- Poland
- Iceland
- Sweden
- South Korea
- Hungary
- Turkey
- Pakistan
- Kazakhstan
- Brazil
- Mexico
- Nigeria
- Ukraine
- Russia
Global recession risk indeed! And that doesn't count several countries with partially inverted yield curves.
Personally, I think the U.S. market is due for a tradable rally. It won't be the time to go all-in from an investing standpoint. And before you regurgitate those stats about missing the 10 best days in the market, I have two things for you to consider:
- The biggest one-day gains in stock market history have come in bear markets, not bull markets
- Being OUT of the market for the 10 worst days has a bigger impact on your portfolio than being IN the market for the 10 best days (chart is old, but supports the point)

Source: LPL Research
Earnings season began last week with big banks reporting Q3 results; looks like they're beating estimates, but down versus last year. Pay attention to the rate of change in earnings; it will tell you much more about the company's future prospects than whether or not they beat soft estimates.
Best To Your Week!
P.S. If you find this research helpful, please tell a friend.
If you don't, tell an enemy.
Sources: Bloomberg, CNBC, Federal Reserve Bank of St. Louis, Hedgeye, U.S. Bureau of Economic Analysis, U.S. Bureau of Economic Analysis, WorldGovernmentBonds.com
Share this Post on:

How to Make Money in Stocks: A Winning System in Good Times and Bad.
It's one of my favorites.
I regularly share articles and other news of interest on:
Twitter (@investsafely)
Facebook (@InvestSafely)
LinkedIn (@Invest-Safely)
Instagram (@investsafely)
Invest Safely, LLC is an independent investment research and online financial media company. Use of Invest Safely, LLC and any other products available through invest-safely.com is subject to our Terms of Service and Privacy Policy. Not a recommendation to buy or sell any security.
Charts provided courtesy of stockcharts.com.
For historical Elliott Wave commentary and analysis, go to ELLIOTT WAVE lives on by Tony Caldaro. Current counts can be found at: Pretzel Logic, and 12345ABCDEWXYZ
Once a year, I review the market outlook signals as if they were a mechanical trading system, while pointing out issues and making adjustments. The goal is to give you to give you an example of how to analyze and continuously improve your own systems.
- 2015 Performance - Stock Market Outlook
- 2016 Performance - Stock Market Outlook
- 2017 Performance - Stock Market Outlook
- 2018 Performance - Stock Market Outlook
- 2019 Performance - Stock Market Outlook
- 2020 Performance - Stock Market Outlook
IMPORTANT DISCLOSURE INFORMATION
This material is for general communication and is provided for informational and/or educational purposes only. None of the content should be viewed as a suggestion that you take or refrain from taking any action nor as a recommendation for any specific investment product, strategy, or other such purpose. Certain information contained herein has been obtained from third-party sources believed to be reliable, but we cannot guarantee its accuracy or completeness.
To the extent that a reader has any questions regarding the applicability of any specific issue discussed above to his/her individual situation, he/she is encouraged to consult with the professional advisors of his/her choosing. Invest Safely, LLC is not a law firm, certified public accounting firm, or registered investment advisor and no portion of its content should be construed as legal, accounting, or investment advice.
The material is not to be construed as an offer or a recommendation to buy or sell a security nor is it to be construed as investment advice. Additionally, the material accessible through this website does not constitute a representation that the investments described herein are suitable or appropriate for any person.
Hypothetical Presentations:
Any referenced performance is “as calculated” using the referenced funds and has not been independently verified. This presentation does not discuss, directly or indirectly, the amount of the profits or losses, realized or unrealized, by any reader or contributor, from any specific funds or securities.
The author and/or any reader may have experienced materially different performance based upon various factors during the corresponding time periods. To the extent that any portion of the content reflects hypothetical results that were achieved by means of the retroactive application of a back-tested model, such results have inherent limitations, including:
Model results do not reflect the results of actual trading using assets, but were achieved by means of the retroactive application of the referenced models, certain aspects of which may have been designed with the benefit of hindsight
Back-tested performance may not reflect the impact that any material market or economic factors might have had on the use of a trading model if the model had been used during the period to actually manage assets
Actual investment results during the corresponding time periods may have been materially different from those portrayed in the model
Past performance may not be indicative of future results. Therefore, no one should assume that future performance will be profitable, or equal to any corresponding historical index.
The S&P 500 Composite Total Return Index (the "S&P") is a market capitalization-weighted index of 500 widely held stocks often used as a proxy for the stock market. Standard & Poor's chooses the member companies for the S&P based on market size, liquidity, and industry group representation. Included are the common stocks of industrial, financial, utility, and transportation companies. The S&P is not an index into which an investor can directly invest. The historical S&P performance results (and those of all other indices) are provided exclusively for comparison purposes only, so as to provide general comparative information to assist an individual in determining whether the performance of a specific portfolio or model meets, or continues to meet investment objective(s). The model and indices performance results do not reflect the impact of taxes.
Investing involves risk (even the “safe” kind)! Past performance does not guarantee or indicate future results. Different types of investments involve varying degrees of underlying risk. Therefore, do not assume that future performance of any specific investment or investment strategy be suitable for your portfolio or individual situation, will be profitable, equal any historical performance level(s), or prove successful (including the investments and/or investment strategies describe on this site).
Investing Process Links
Stabilize- Organize your $$$
- Manage your $$$
Plan
- Why You Invest
- Ways to Invest
- Where to Invest
- What to Invest In
Execute
- When to Invest
- How Much to Invest
- Buying & Selling
Monitor
- Track The Market
- Track Your Returns
Reflect & Adjust
- Improve Your Returns
- Adjust your Holdings
Popular Pages
- Jim Cramer- Personal Incomes Statements
- Hyperinflation
- Calculating Beta
- SMART Financial Goals
Blogroll
- Advisor Perspectives- Dividend Growth Investor
- Elliott Wave Lives On
- On My Radar | CMG Wealth
- Sure Dividend
- The Big Picture
- The Fat Pitch
- Thoughts from the Frontline
- Trader Feed
Sponsored Links
Invest Safely provides valuable, time-saving info about personal finance, money management, and investing.


