Stock Market Outlook
For The Week Of October 9th = Downtrend
INDICATORS
-
ADX Directional Indicators: Downtrend
Price & Volume Action: Downtrend
Elliott Wave Analysis: Downtrend
The S&P500 ($SPX) rose 1.5% last week, but that seems pretty tame considering its ~6% gain mid-week. The index closed ~10% below the 50-day and ~15% below the 200-day moving average.
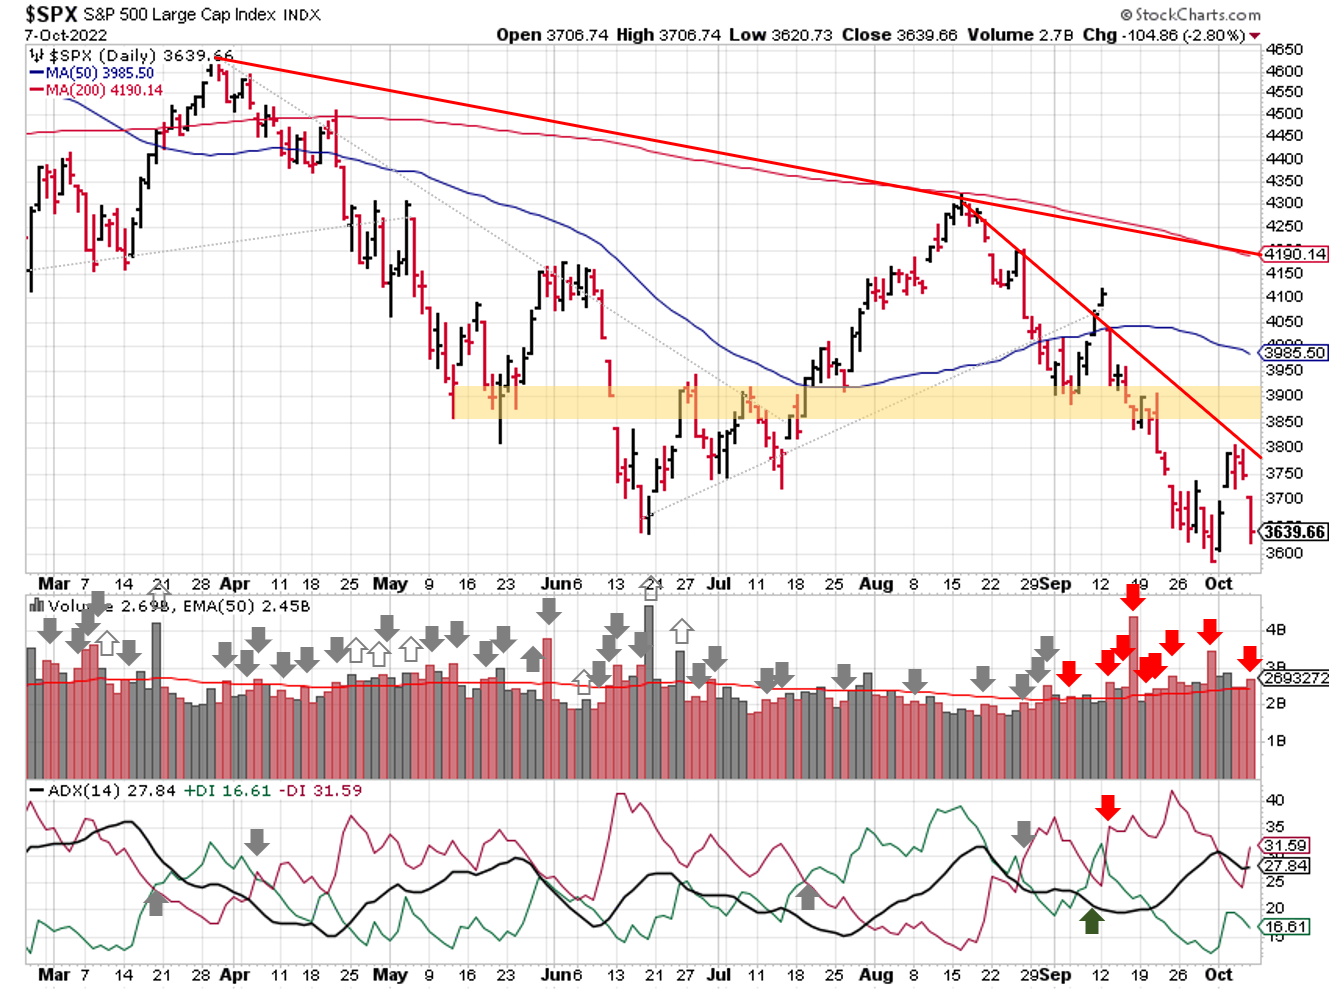
2022-10-09-SPX Trendline Analysis - Daily
The ADX signal stays bearish, as the gap between the negative and positive direction indicators widened after Friday's sell off.
Price & volume still shows a downtrend as well. Monday is the fifth day of the latest rally attempt (started on October 3); watch for either a break below the September 30th low or a 1.5% increase on above average trading volume.
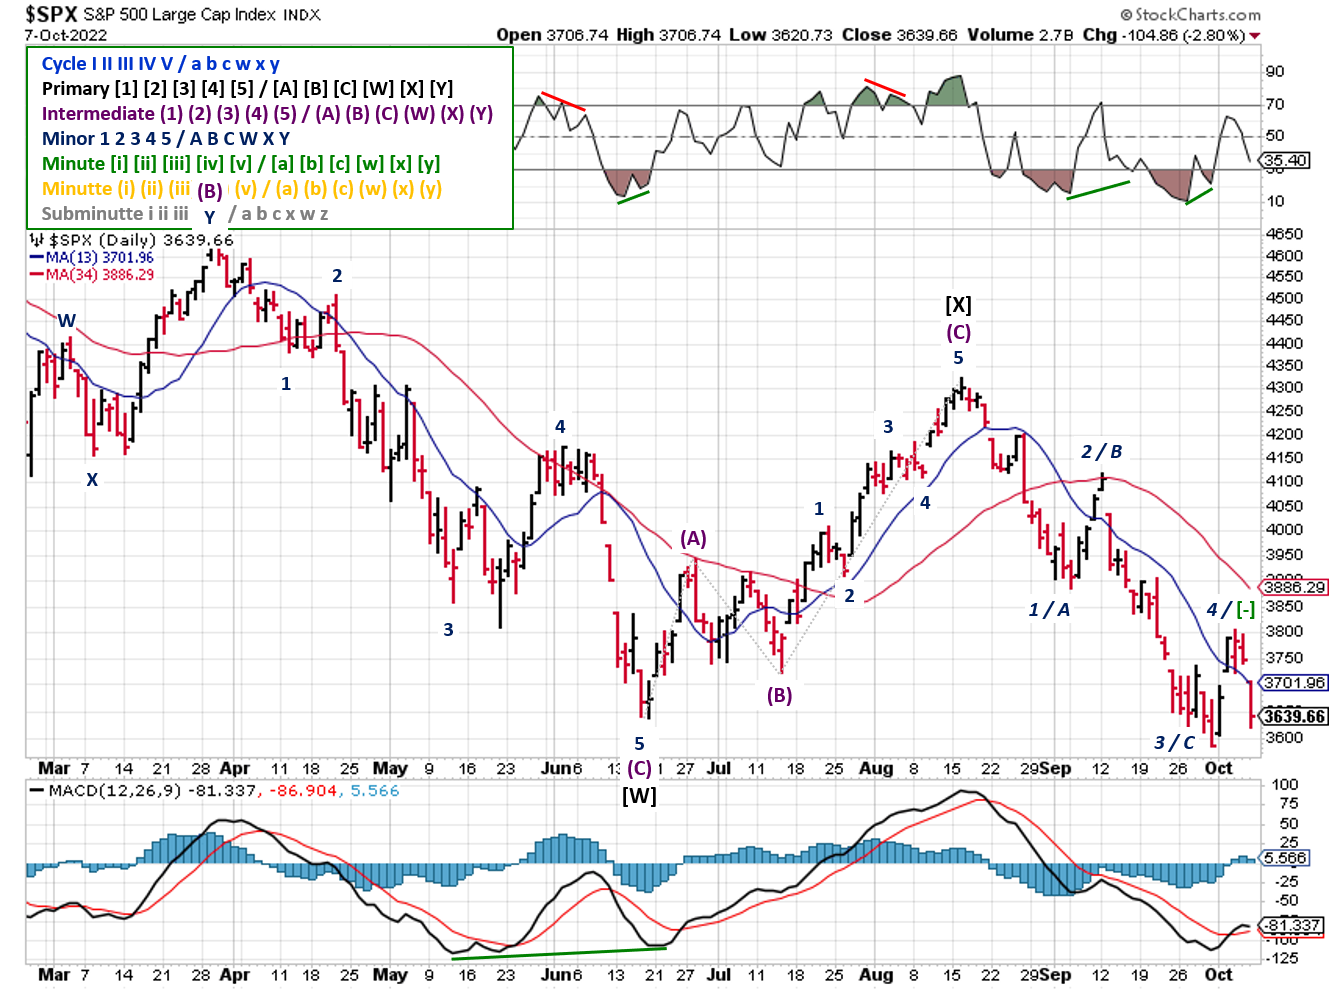
2022-10-09- SPX Elliott Wave Analysis - Daily - Primary Y
Elliott Wave shows a completed wave last week, but more movement is needed to confirm the wave count. Either way, the September 30th low and last week's high are support/resistance levels to watch.
COMMENTARY
Another week, another narrative ends in tears, as market commentators and participants continue their search for anything to justify their views that the Fed's fight with inflation is over, the bottom is in and it's time to buy stocks again.
Last weekend, Australia's central bank decided to slow its pace of rate hikes (the "new" definition of a pivot). Then, United Nations Conference on Trade and Development called on central banks to stop raising interest rates to avoid a global recession. Combined, these two events raised hopes the the Fed would "read the room" and change course.
On Tuesday, the JOLTS summary (Job Openings and Labor Turnover) showed a 10% decline in the number of job openings. Somehow that was interpreted as the economy "definitely" showing signs that interest rate hikes were working, soft landing achieved, etc. All that jawboning appeared with work, with the SPX up more than 5% by Wednesday's high.
Friday's release of nonfarm payroll data showed an increase in September, just above consensus estimates. The unemployment rate dropped to 3.5%, thanks in part to a lower labor force participation rate. Those data points aren't high, but they're not low either, and don't provide enough "negativity" to justify the narrative of a shift in Fed policy. Reality set in, and stock prices retreated.
Would a pause or pivot in interest rate hikes be a "risk-on" event? Definitely. But for how long? Remember that justifying a pivot or pause requires us to be the in midst of a really bad economic situation; one that would make interest rate policy the least of investors' concerns.
This week, financial media will do it all over again while we await the release of CPI data on Thursday. Keep in mind that the Fed doesn't meet until November 1, and a lot can happen between now and then. So no matter how many data points are connected, no matter how many past examples are cited, it's all conjecture and guesswork until November 2.
Better to look for signs of a recovery in other areas:
- Yield curve (is it flattening?)
- U.S. dollar (is it weakening and/or becoming less negatively correlated to equities?)
- Earnings announcements (are they beating targets and/or raising guidance?)
Best To Your Week!
P.S. If you find this research helpful, please tell a friend.
If you don't, tell an enemy.
Sources: Bloomberg, CNBC, Hedgeye, U.S. Bureau of Economic Analysis, U.S. Bureau of Labor Statistics
Share this Post on:

How to Make Money in Stocks: A Winning System in Good Times and Bad.
It's one of my favorites.
I regularly share articles and other news of interest on:
Twitter (@investsafely)
Facebook (@InvestSafely)
LinkedIn (@Invest-Safely)
Instagram (@investsafely)
Invest Safely, LLC is an independent investment research and online financial media company. Use of Invest Safely, LLC and any other products available through invest-safely.com is subject to our Terms of Service and Privacy Policy. Not a recommendation to buy or sell any security.
Charts provided courtesy of stockcharts.com.
For historical Elliott Wave commentary and analysis, go to ELLIOTT WAVE lives on by Tony Caldaro. Current counts can be found at: Pretzel Logic, and 12345ABCDEWXYZ
Once a year, I review the market outlook signals as if they were a mechanical trading system, while pointing out issues and making adjustments. The goal is to give you to give you an example of how to analyze and continuously improve your own systems.
- 2015 Performance - Stock Market Outlook
- 2016 Performance - Stock Market Outlook
- 2017 Performance - Stock Market Outlook
- 2018 Performance - Stock Market Outlook
- 2019 Performance - Stock Market Outlook
- 2020 Performance - Stock Market Outlook
IMPORTANT DISCLOSURE INFORMATION
This material is for general communication and is provided for informational and/or educational purposes only. None of the content should be viewed as a suggestion that you take or refrain from taking any action nor as a recommendation for any specific investment product, strategy, or other such purpose. Certain information contained herein has been obtained from third-party sources believed to be reliable, but we cannot guarantee its accuracy or completeness.
To the extent that a reader has any questions regarding the applicability of any specific issue discussed above to his/her individual situation, he/she is encouraged to consult with the professional advisors of his/her choosing. Invest Safely, LLC is not a law firm, certified public accounting firm, or registered investment advisor and no portion of its content should be construed as legal, accounting, or investment advice.
The material is not to be construed as an offer or a recommendation to buy or sell a security nor is it to be construed as investment advice. Additionally, the material accessible through this website does not constitute a representation that the investments described herein are suitable or appropriate for any person.
Hypothetical Presentations:
Any referenced performance is “as calculated” using the referenced funds and has not been independently verified. This presentation does not discuss, directly or indirectly, the amount of the profits or losses, realized or unrealized, by any reader or contributor, from any specific funds or securities.
The author and/or any reader may have experienced materially different performance based upon various factors during the corresponding time periods. To the extent that any portion of the content reflects hypothetical results that were achieved by means of the retroactive application of a back-tested model, such results have inherent limitations, including:
Model results do not reflect the results of actual trading using assets, but were achieved by means of the retroactive application of the referenced models, certain aspects of which may have been designed with the benefit of hindsight
Back-tested performance may not reflect the impact that any material market or economic factors might have had on the use of a trading model if the model had been used during the period to actually manage assets
Actual investment results during the corresponding time periods may have been materially different from those portrayed in the model
Past performance may not be indicative of future results. Therefore, no one should assume that future performance will be profitable, or equal to any corresponding historical index.
The S&P 500 Composite Total Return Index (the "S&P") is a market capitalization-weighted index of 500 widely held stocks often used as a proxy for the stock market. Standard & Poor's chooses the member companies for the S&P based on market size, liquidity, and industry group representation. Included are the common stocks of industrial, financial, utility, and transportation companies. The S&P is not an index into which an investor can directly invest. The historical S&P performance results (and those of all other indices) are provided exclusively for comparison purposes only, so as to provide general comparative information to assist an individual in determining whether the performance of a specific portfolio or model meets, or continues to meet investment objective(s). The model and indices performance results do not reflect the impact of taxes.
Investing involves risk (even the “safe” kind)! Past performance does not guarantee or indicate future results. Different types of investments involve varying degrees of underlying risk. Therefore, do not assume that future performance of any specific investment or investment strategy be suitable for your portfolio or individual situation, will be profitable, equal any historical performance level(s), or prove successful (including the investments and/or investment strategies describe on this site).
Investing Process Links
Stabilize- Organize your $$$
- Manage your $$$
Plan
- Why You Invest
- Ways to Invest
- Where to Invest
- What to Invest In
Execute
- When to Invest
- How Much to Invest
- Buying & Selling
Monitor
- Track The Market
- Track Your Returns
Reflect & Adjust
- Improve Your Returns
- Adjust your Holdings
Popular Pages
- Jim Cramer- Personal Incomes Statements
- Hyperinflation
- Calculating Beta
- SMART Financial Goals
Blogroll
- Advisor Perspectives- Dividend Growth Investor
- Elliott Wave Lives On
- On My Radar | CMG Wealth
- Sure Dividend
- The Big Picture
- The Fat Pitch
- Thoughts from the Frontline
- Trader Feed
Sponsored Links
Invest Safely provides valuable, time-saving info about personal finance, money management, and investing.


