Stock Market Outlook
For The Week Of October 2nd = Downtrend
INDICATORS
-
ADX Directional Indicators: Downtrend
Price & Volume Action: Downtrend
Elliott Wave Analysis: Downtrend
The S&P500 ($SPX) fell 2.9% last week, and ~13% over the past 3 weeks. The index sits ~11% below the 50-day and ~15% below the 200-day moving average. Year to date, the SPX is down ~25%, which requires a rally of 33% to get back to even.
ADX and price volume are bearish, and look a lot like they did during the first week or two of May.
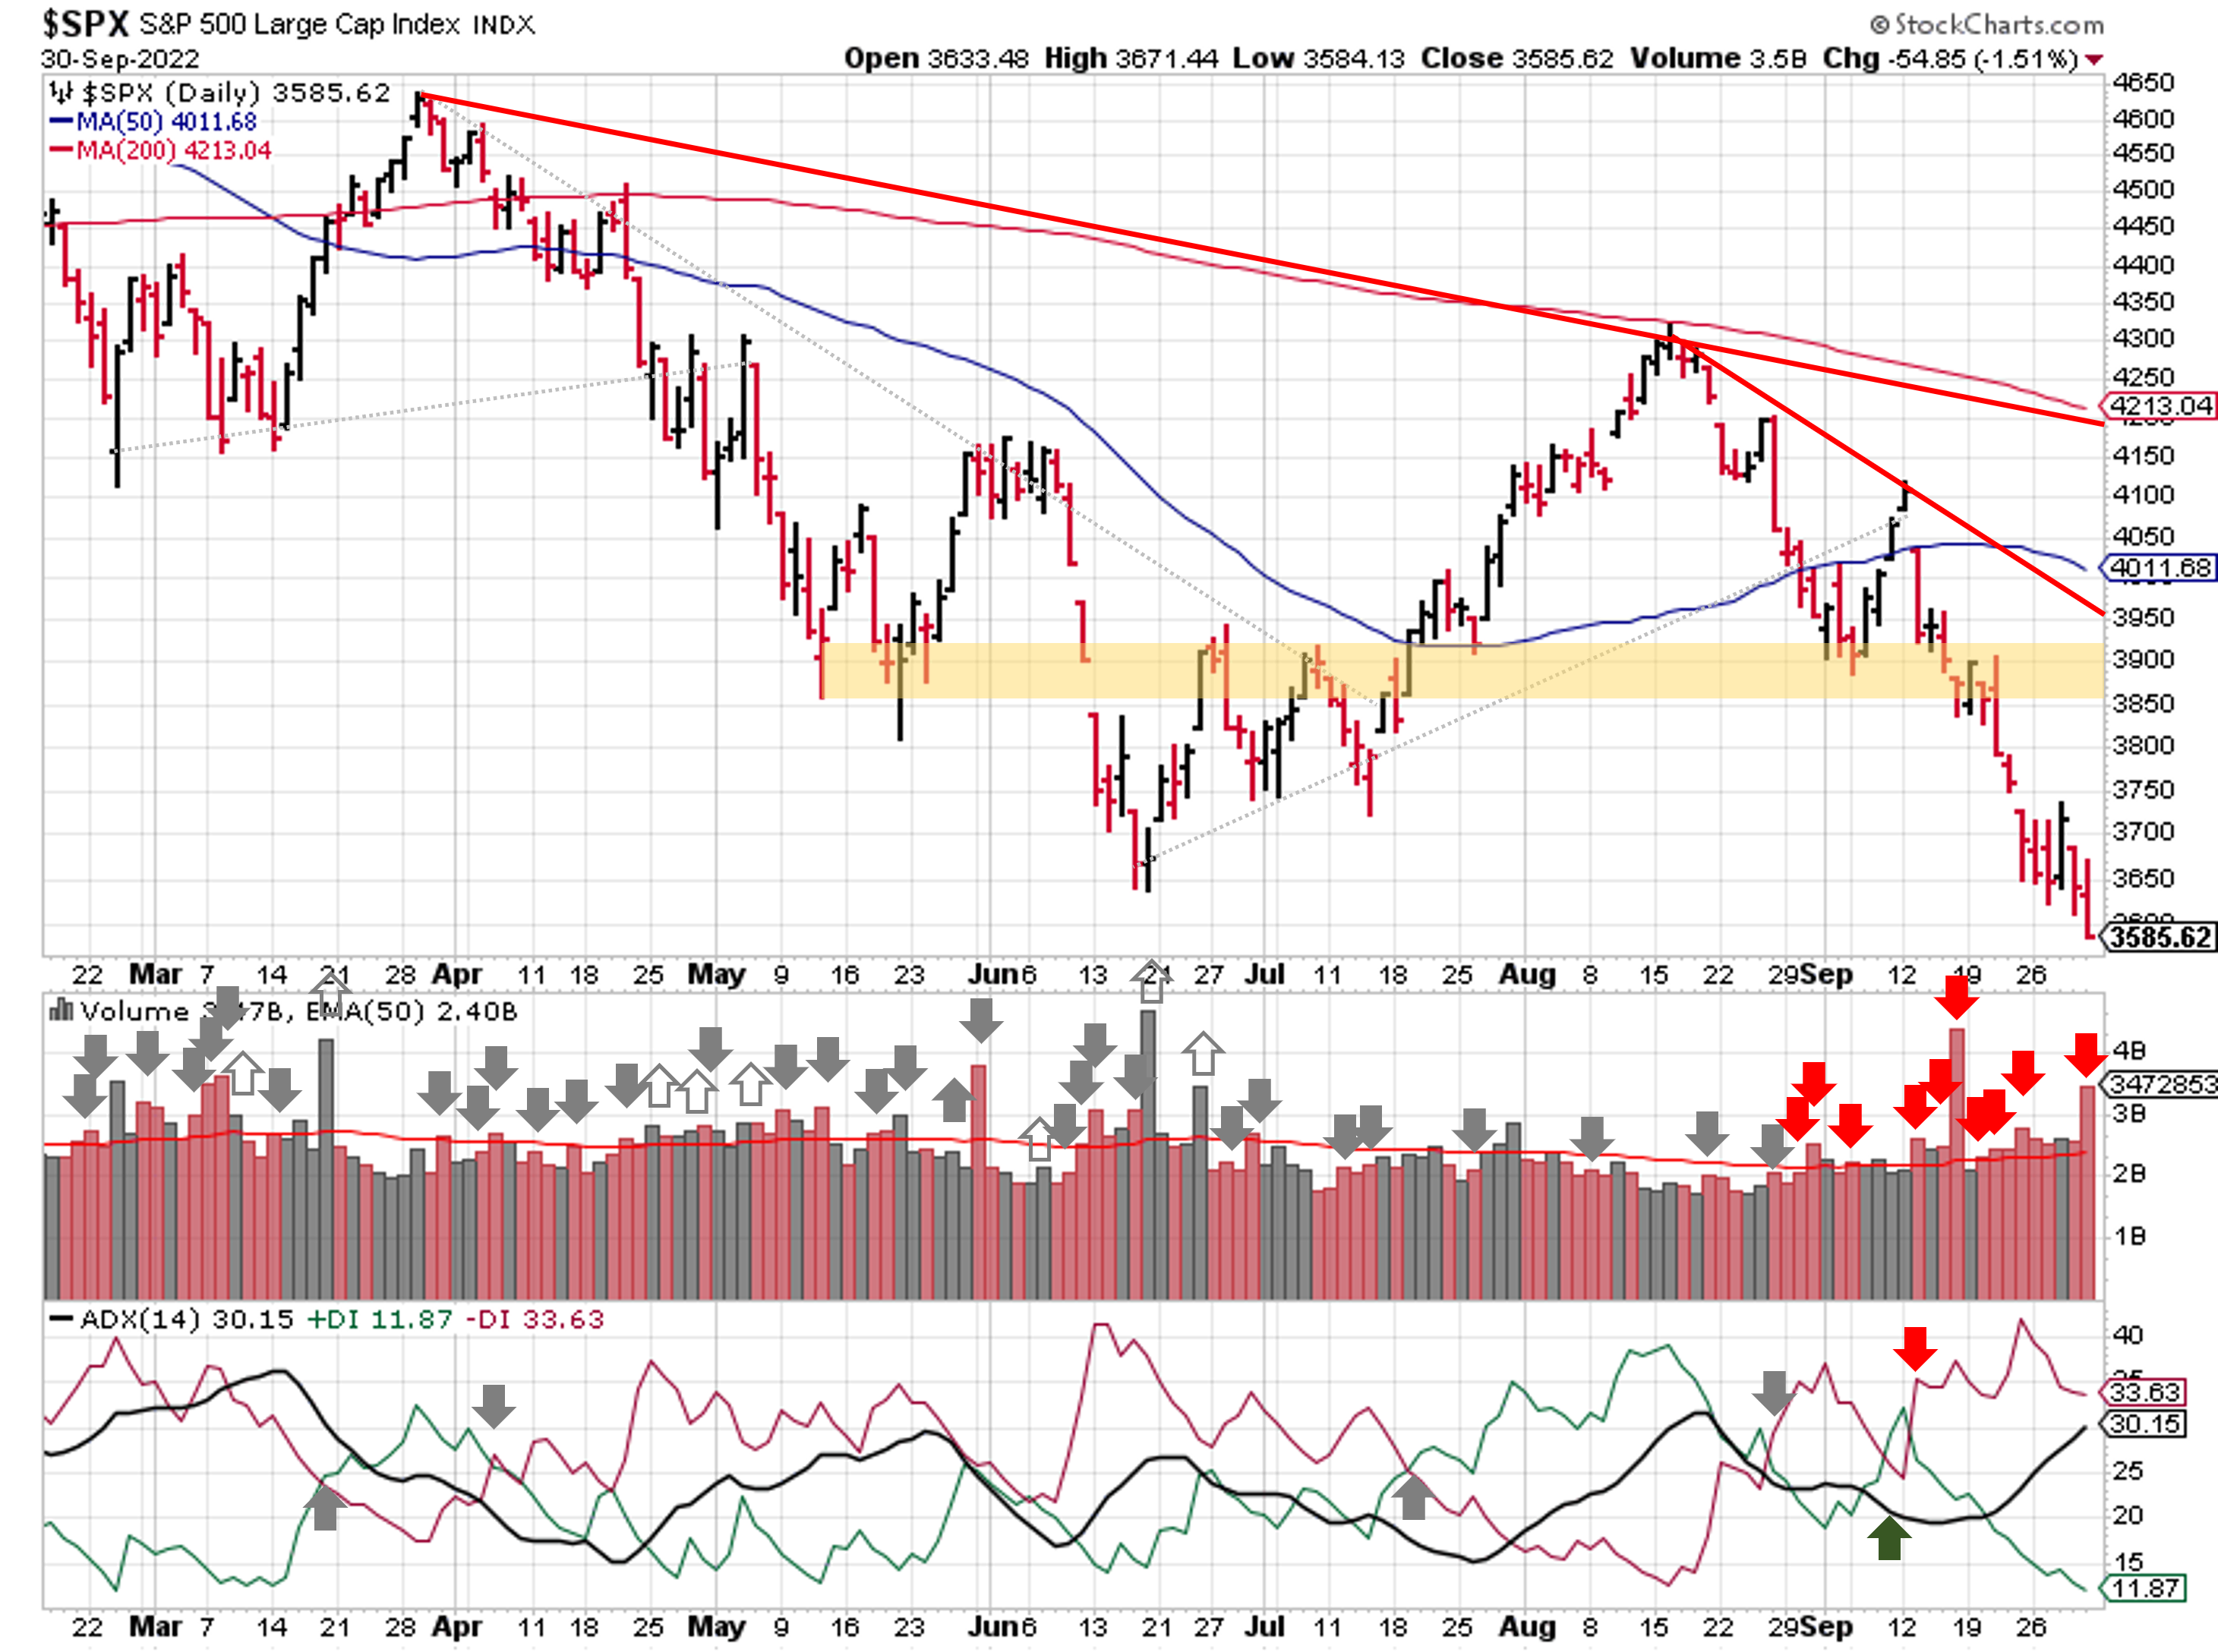
2022-10-02-SPX Trendline Analysis - Daily
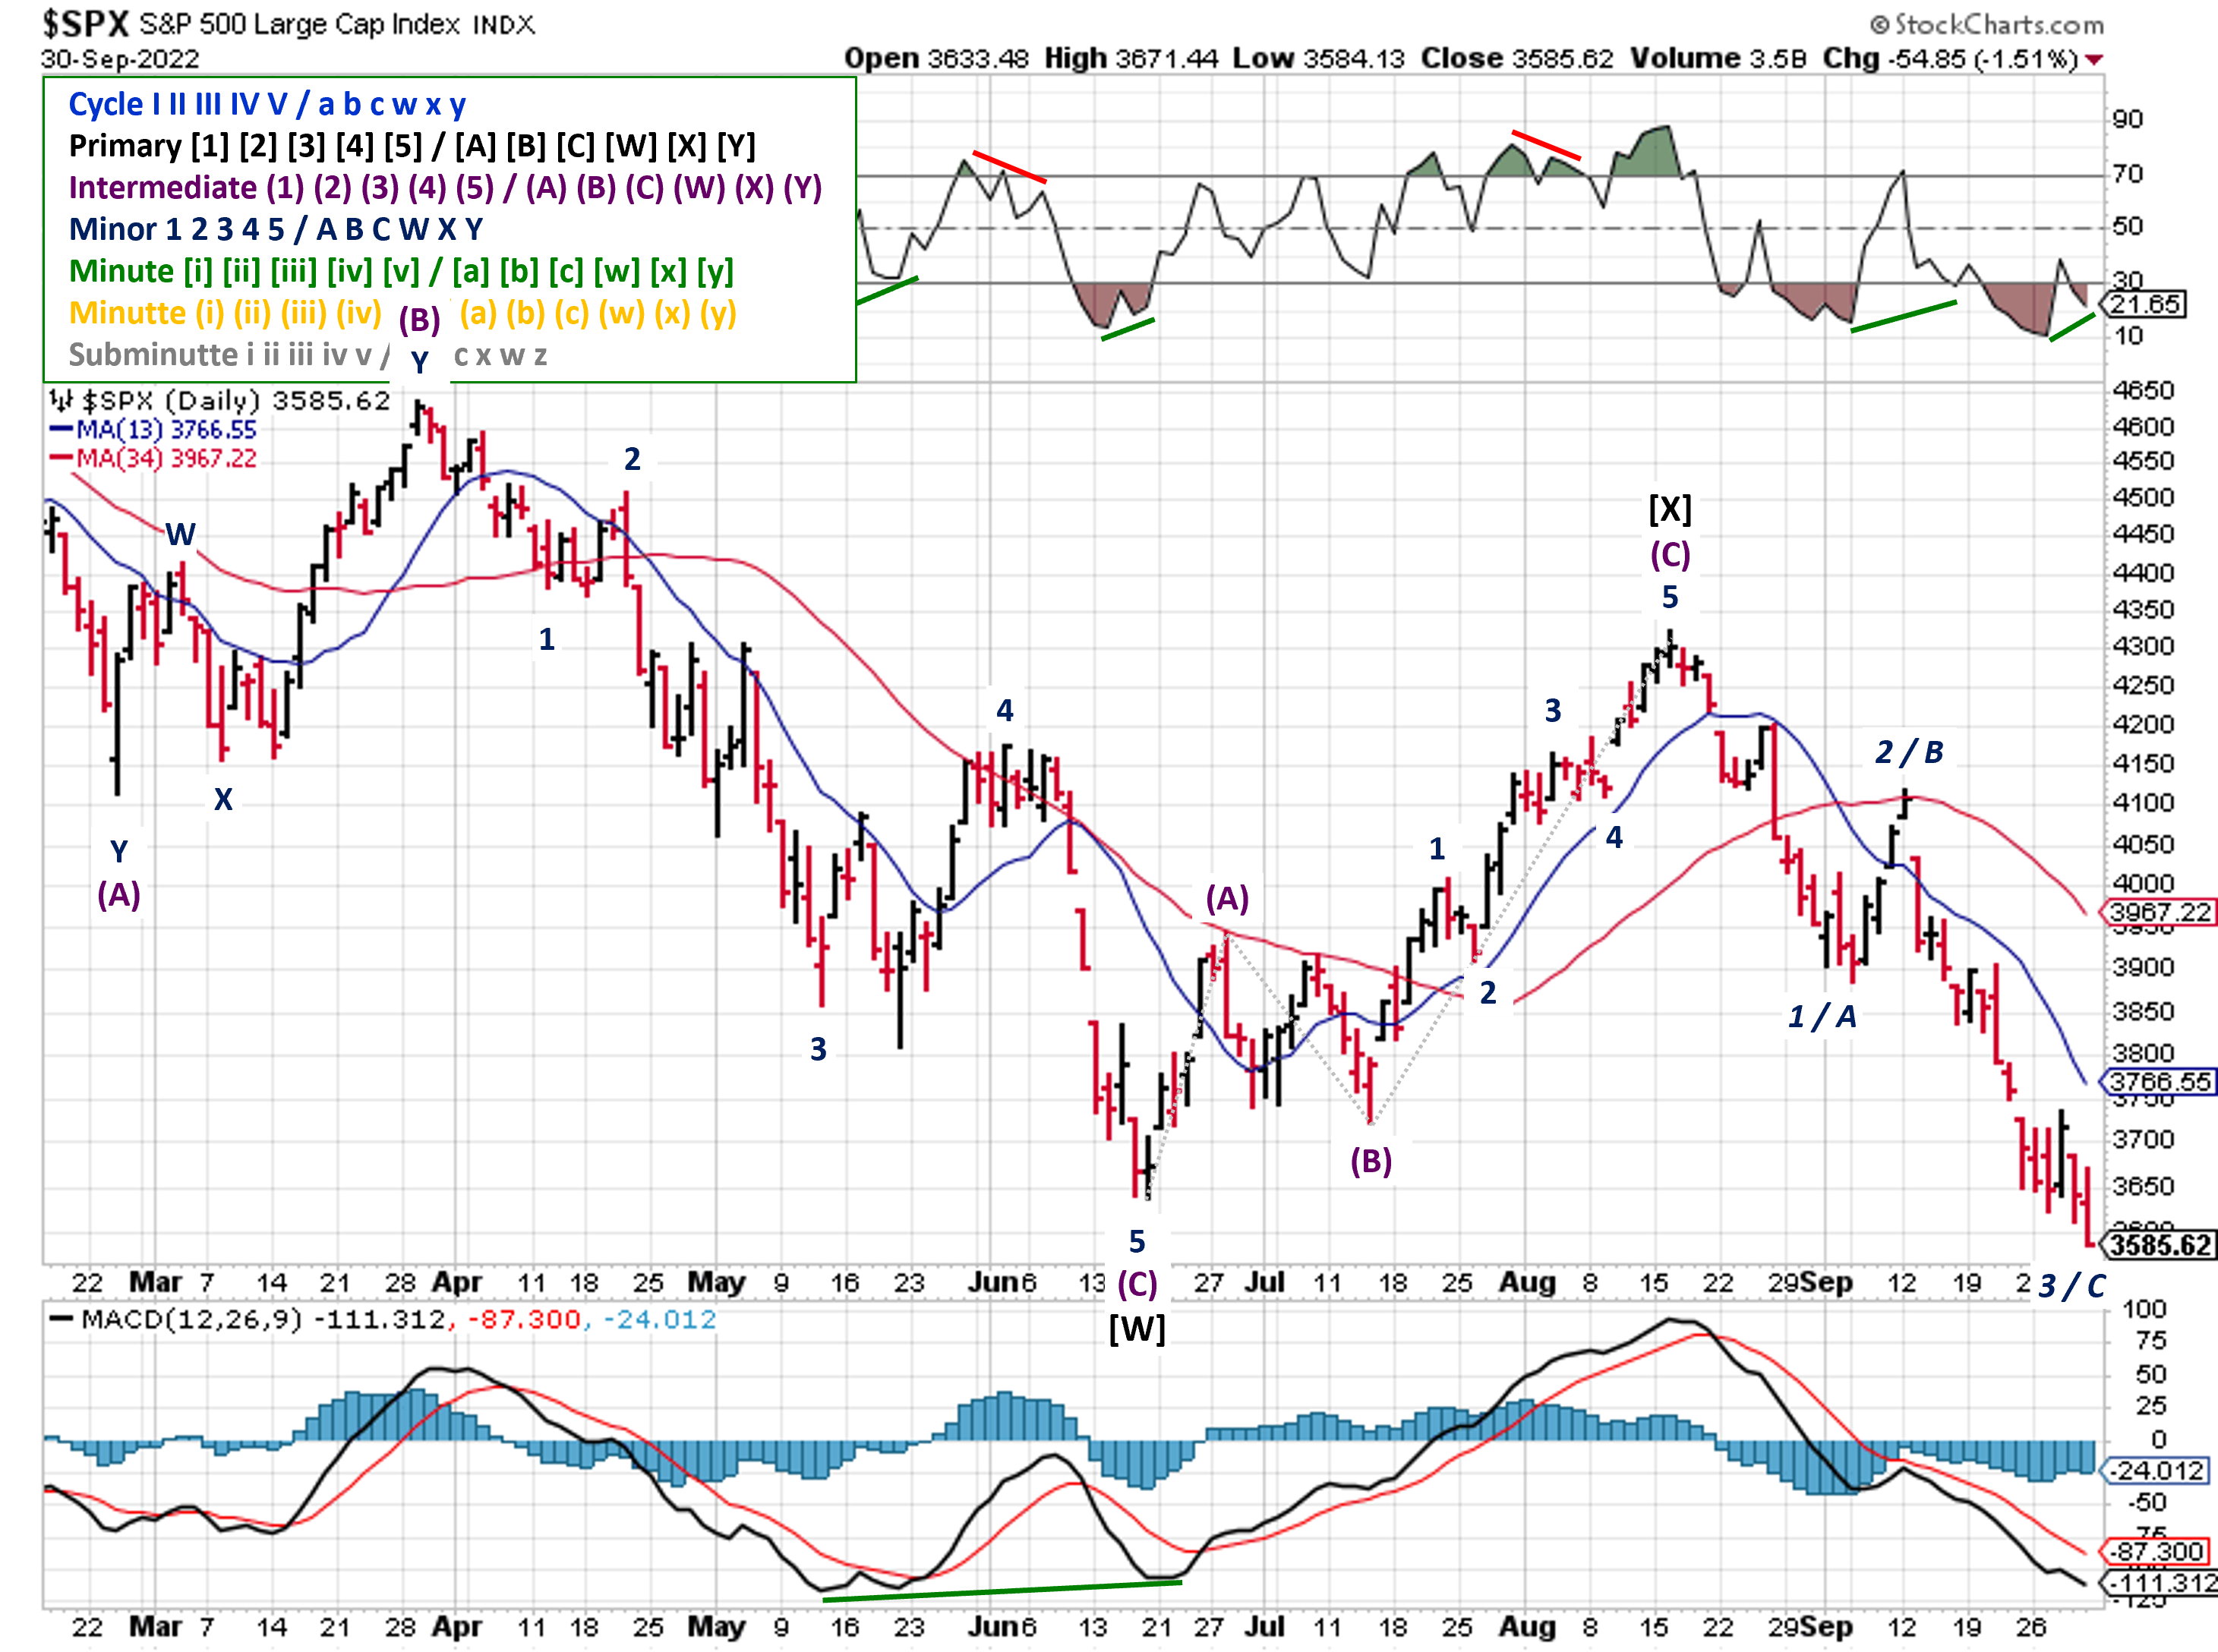
2022-10-02- SPX Elliott Wave Analysis - Daily - Primary Y
Elliott Wave shows 3-waves down (so far). When the SPX dropped below the June low, the uptrend possibility went with it. The long term view of Elliott Wave needed an update, and what better time then the start of Q4.
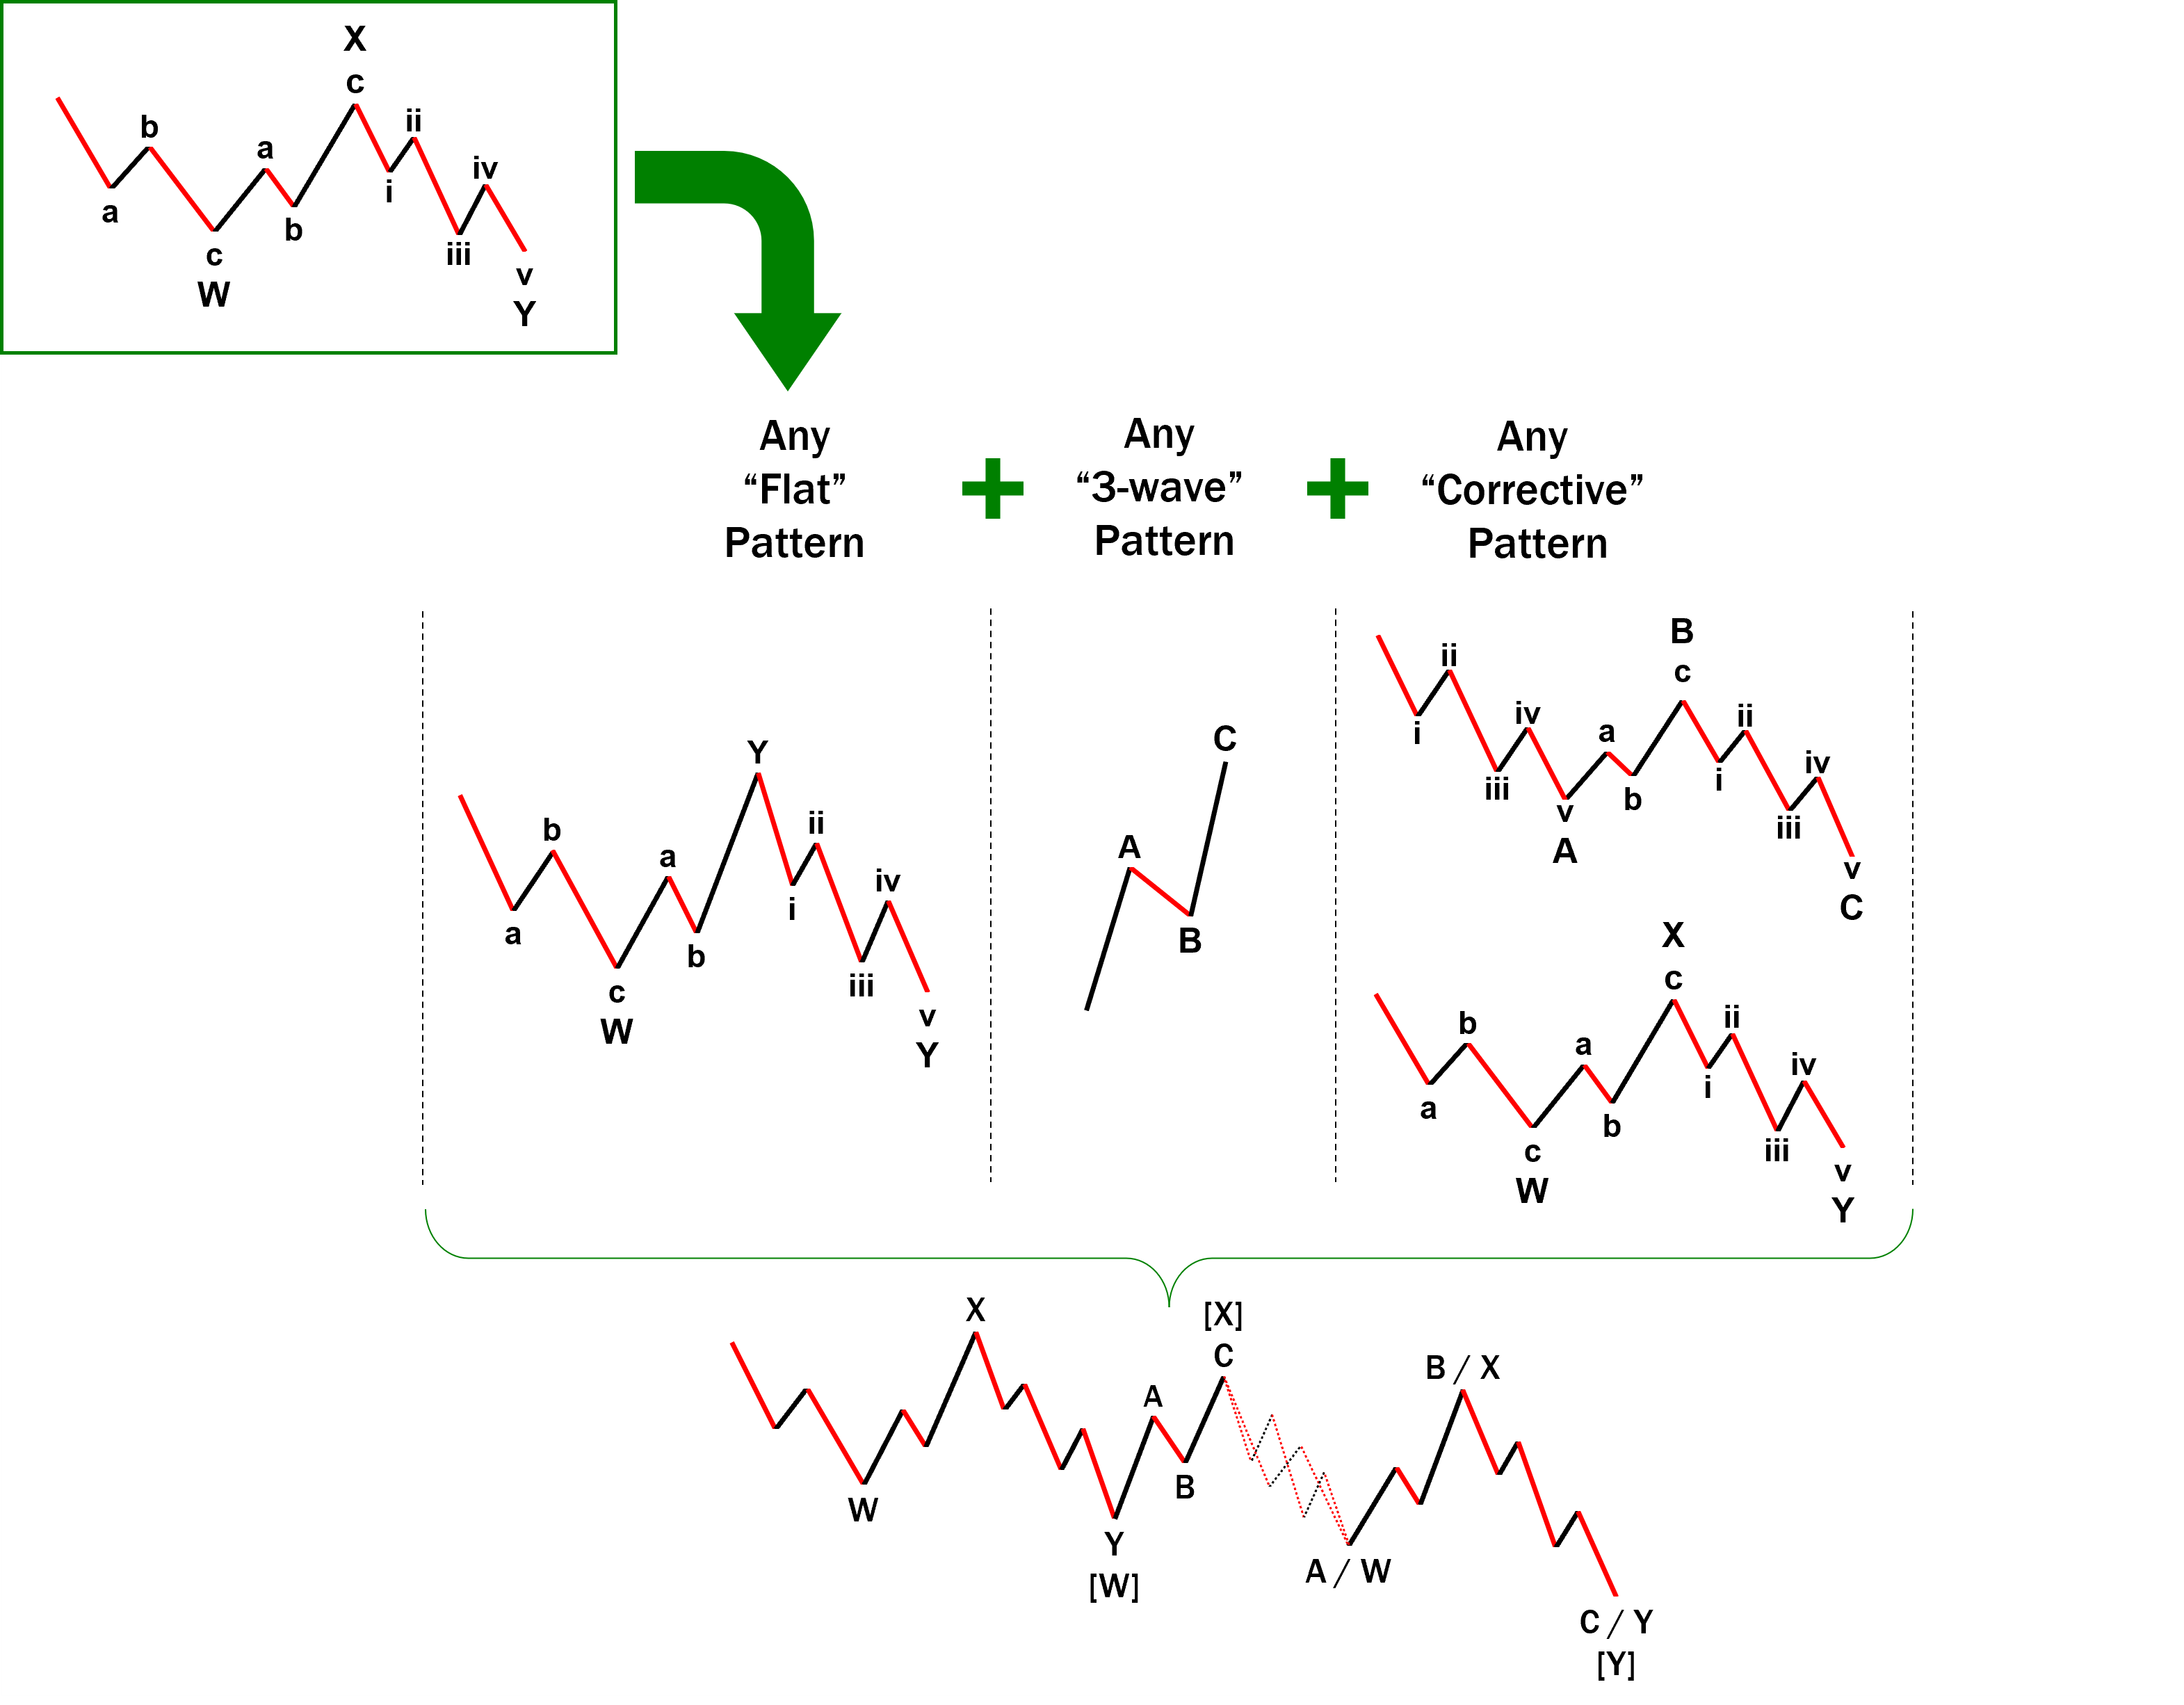
2022-10-02- SPX Elliott Wave Analysis - Double Three Pattern
I still favor the Double Three Pattern, as the weekly view continues to line up really well. We don't know if the first leg down is 3 or 5 waves. In both cases, we're due for a bounce.
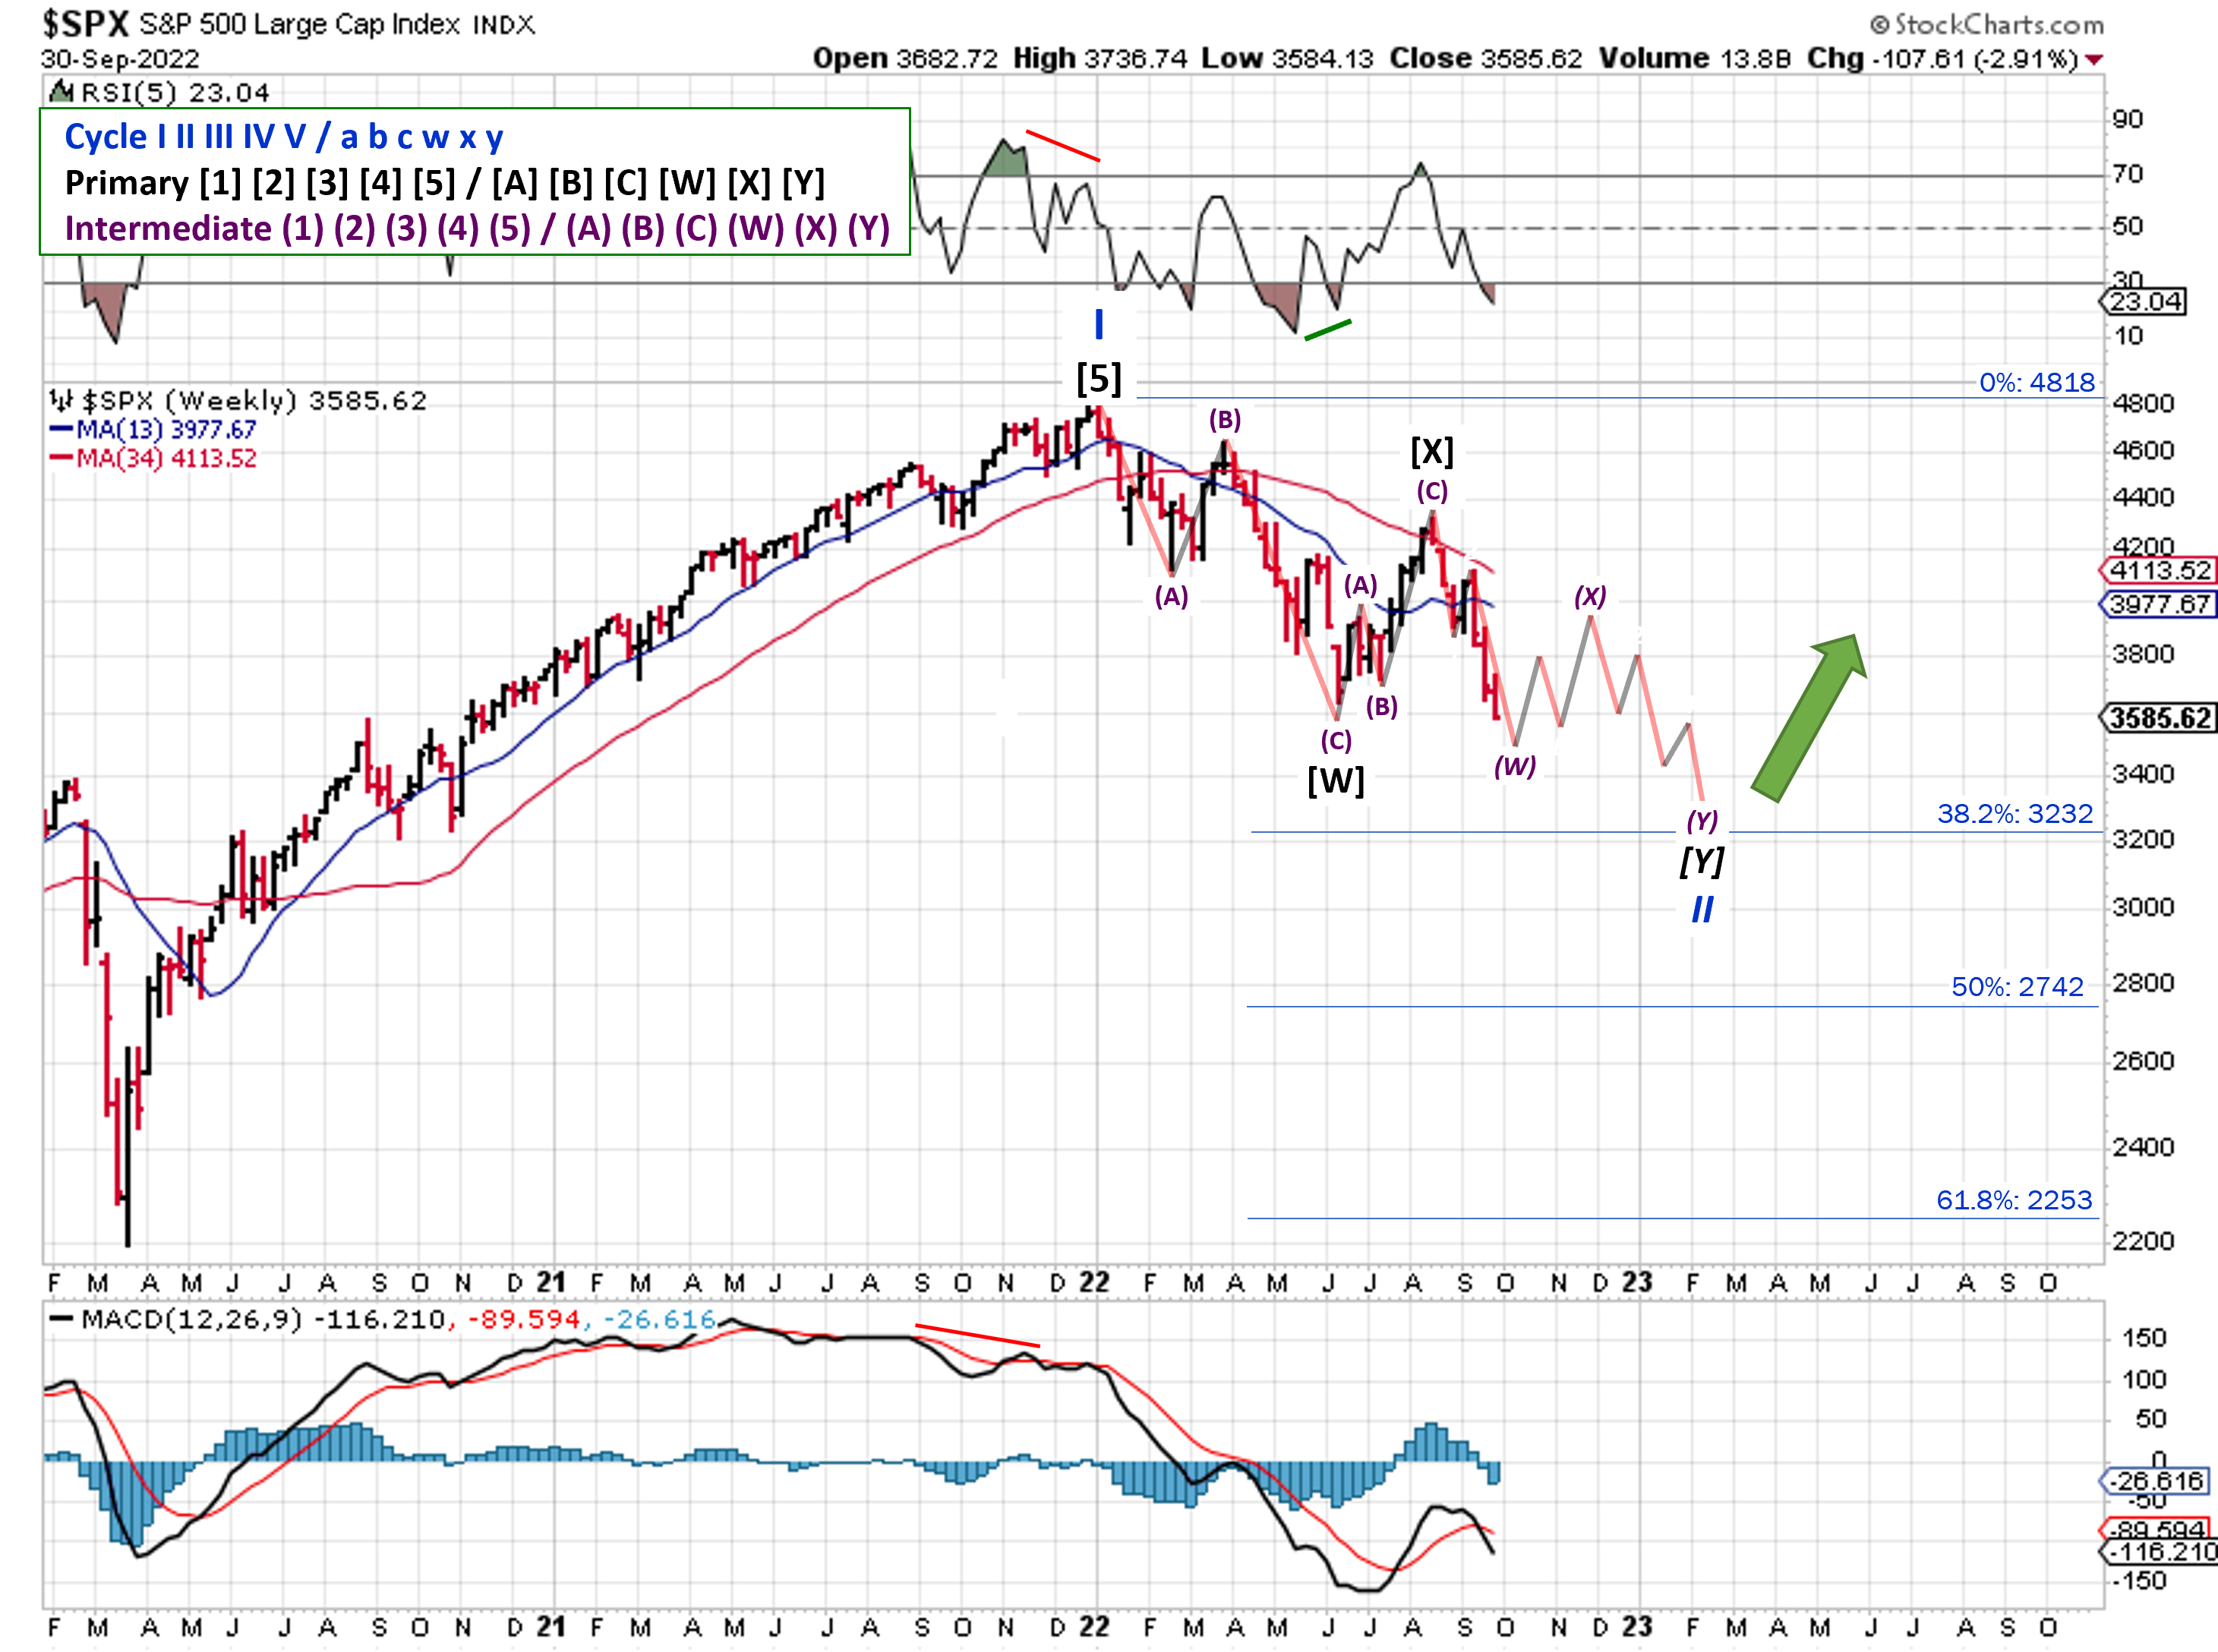
2022-10-02- SPX Elliott Wave Analysis - Weekly - Double Three
If we get three waves down, another double three pattern is possible (3 waves, 3 waves, then 5 waves), and would likely produce the "shortest" bear market of the wave counts I'm tracking. We'll see a bounce shortly, in the form of a new, 3-wave uptrend back towards to the 200-day.
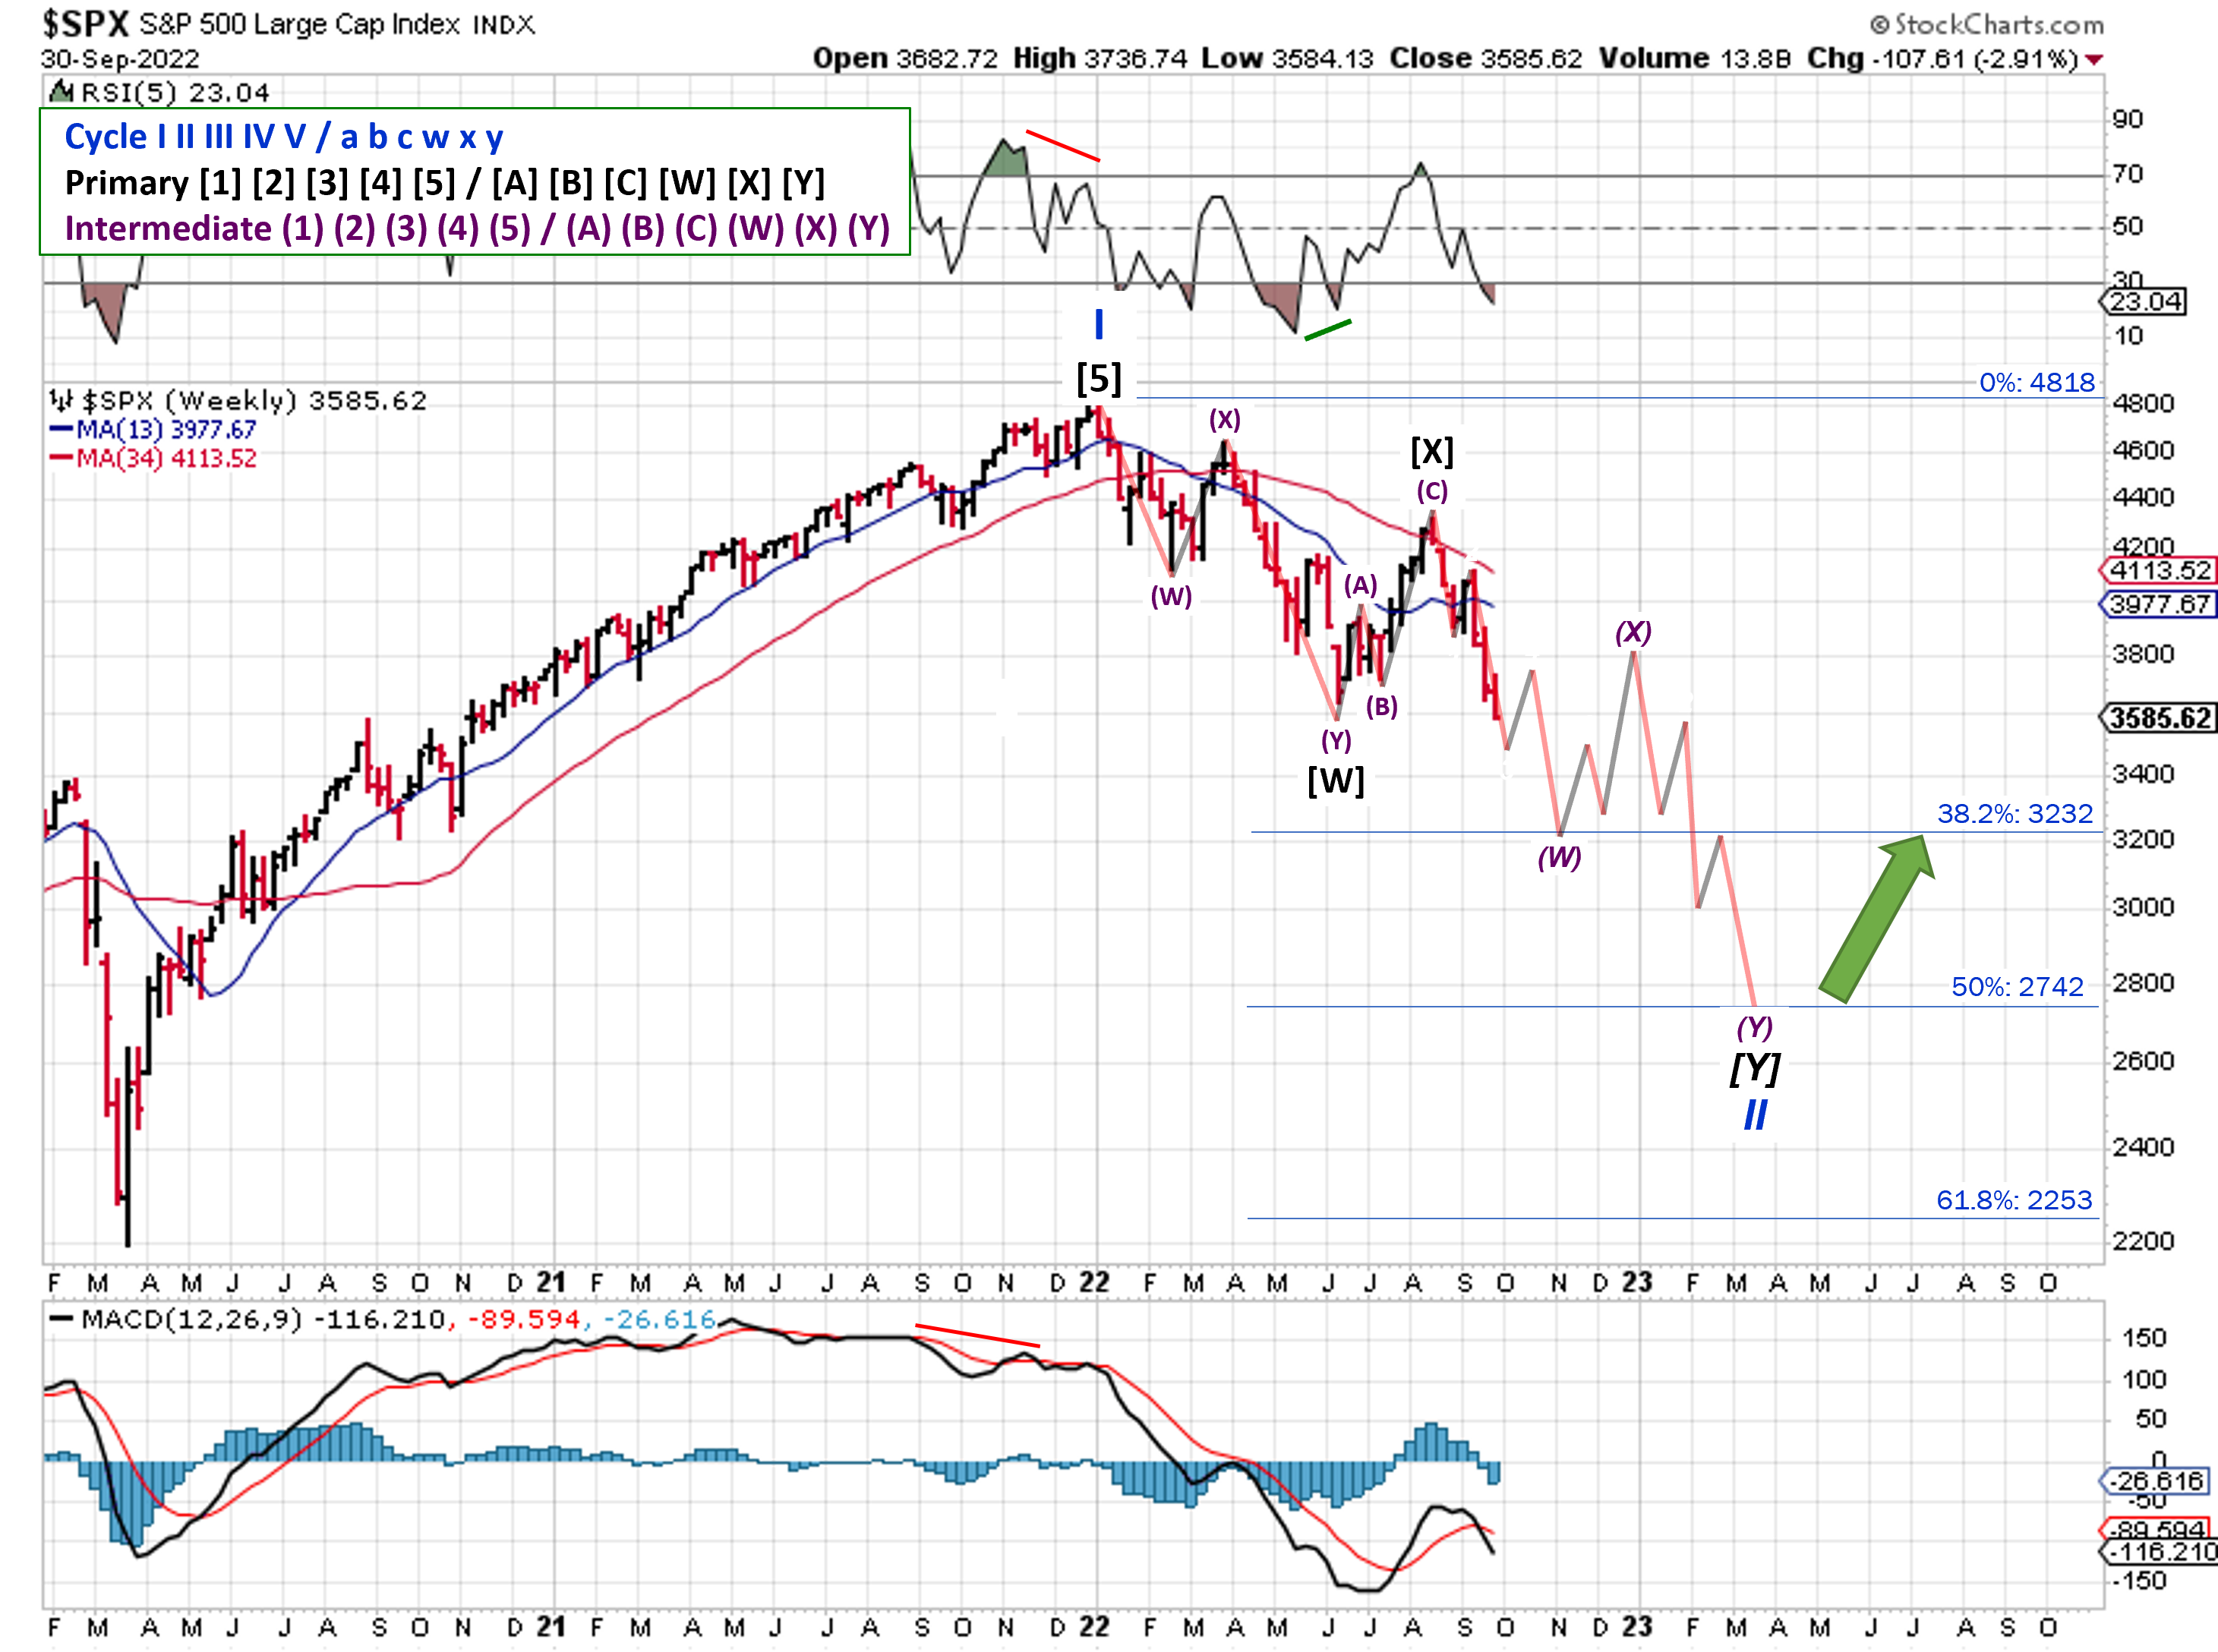
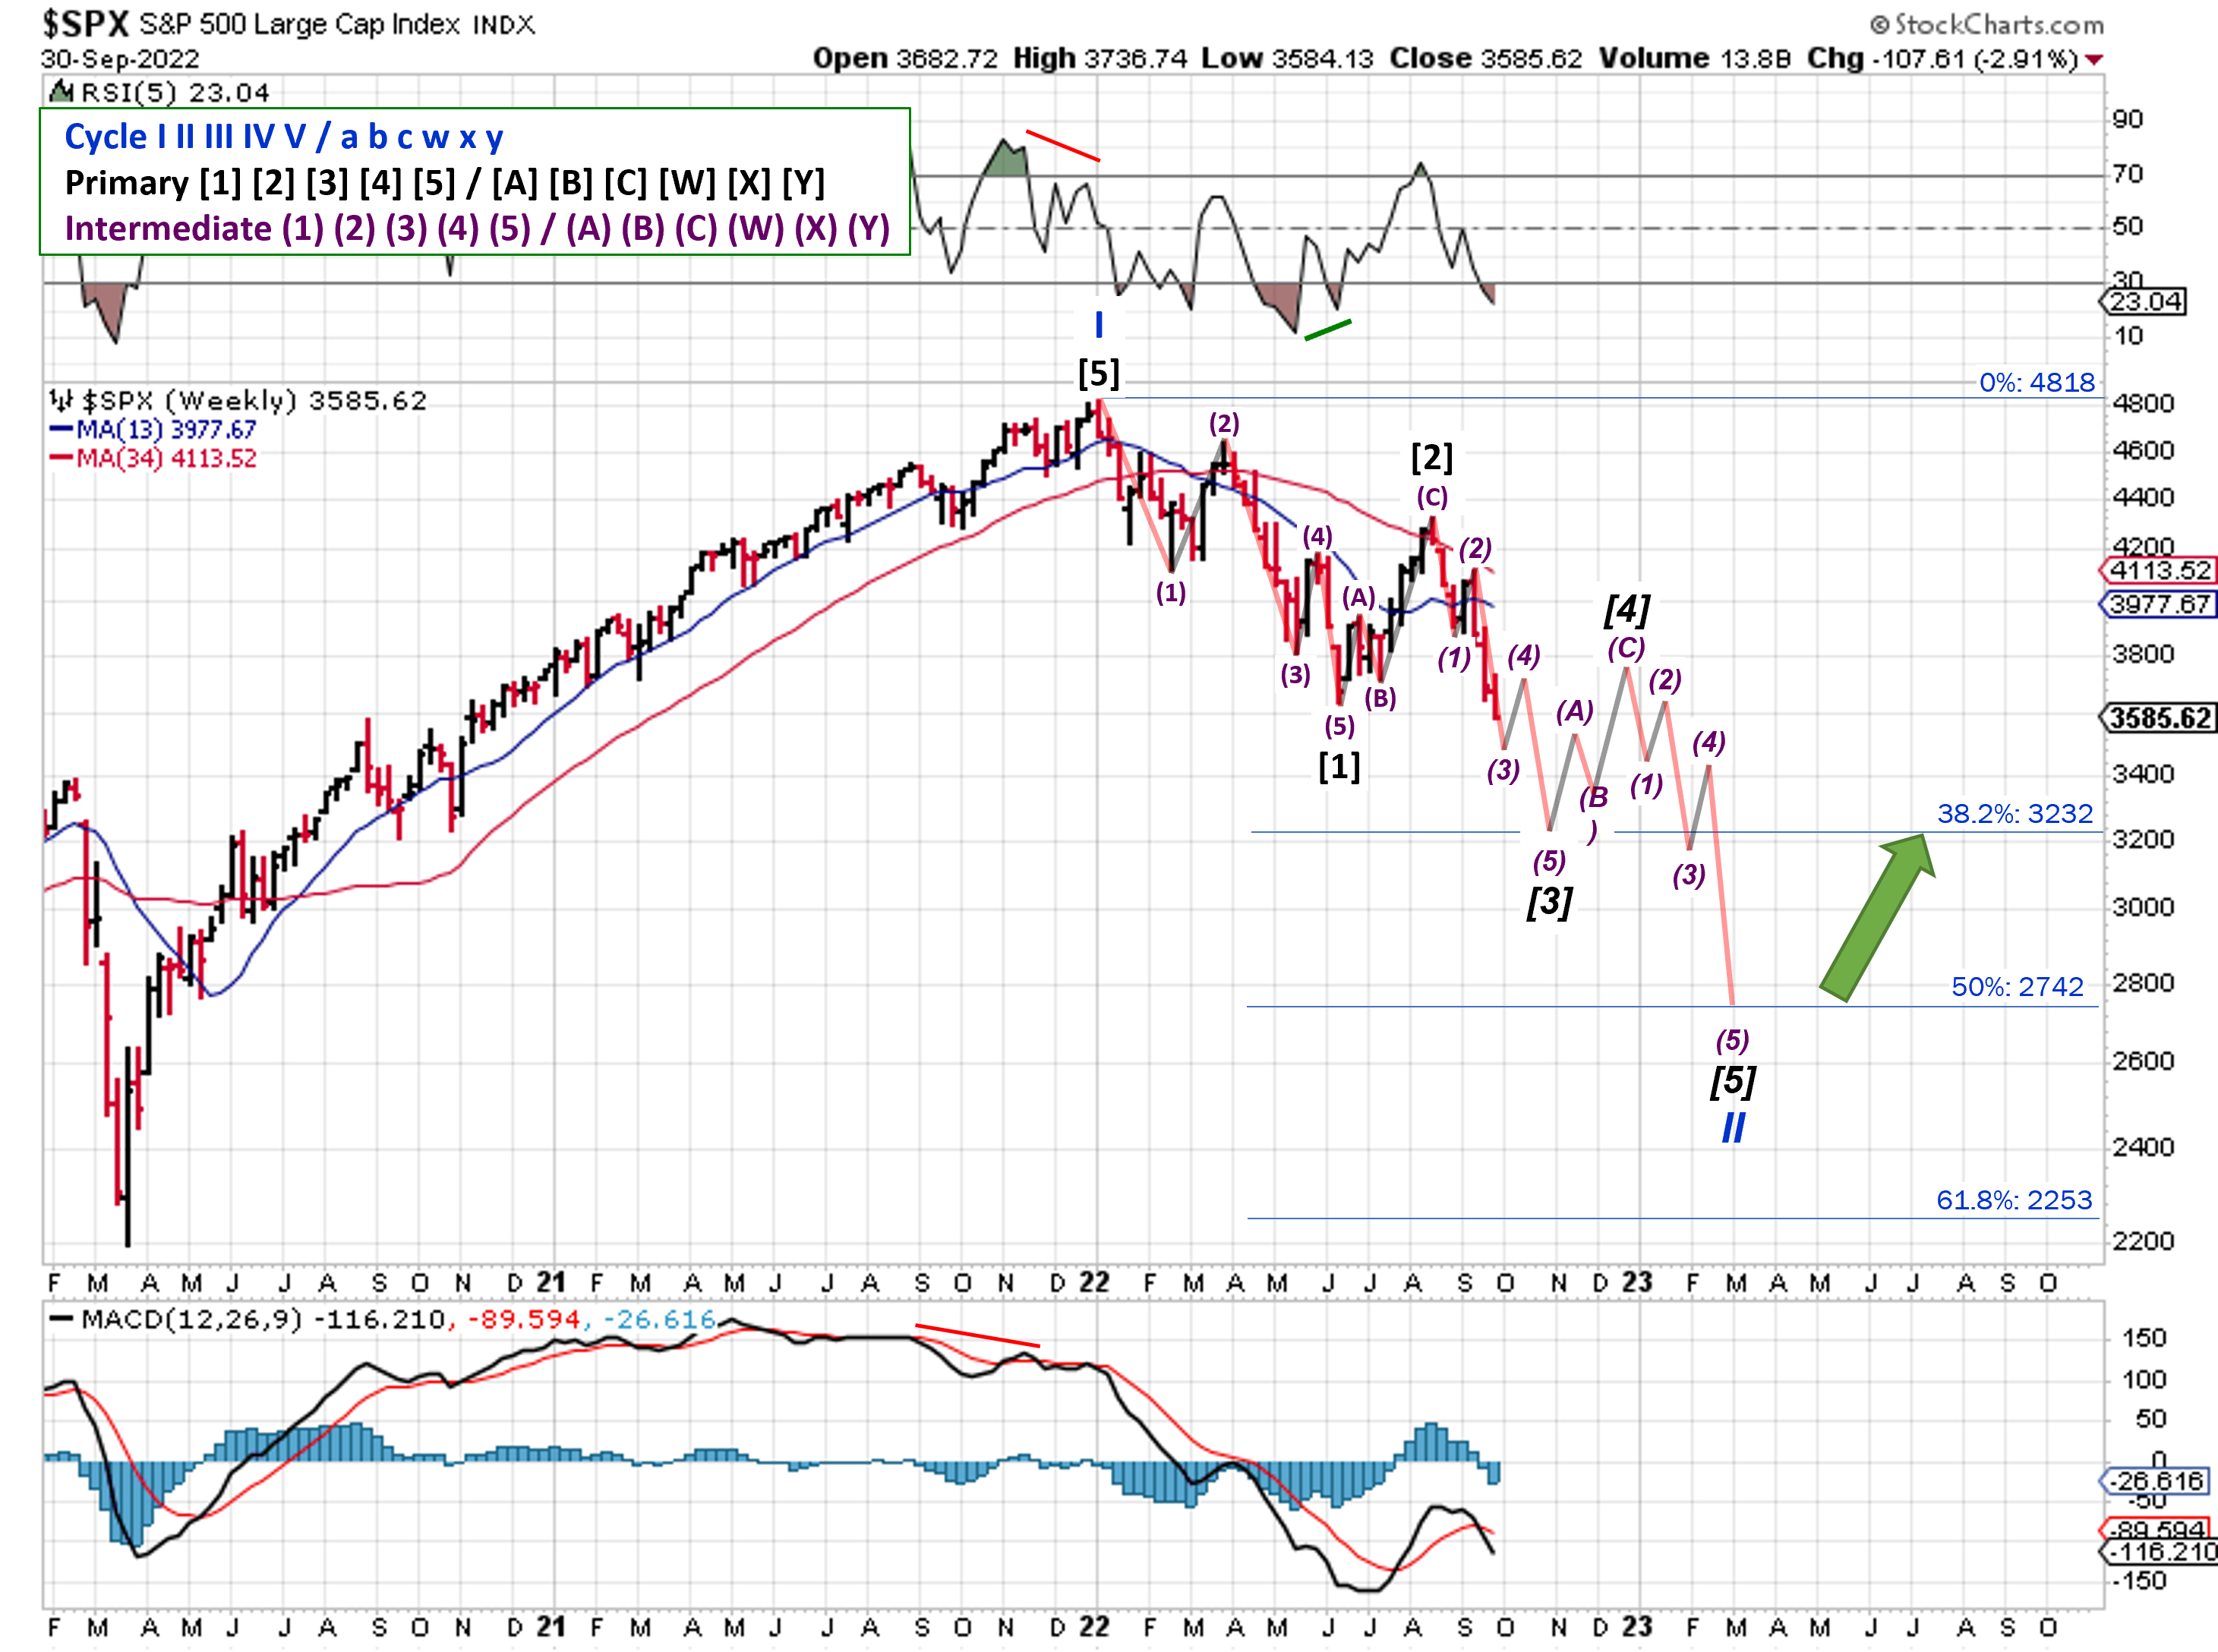
2022-10-02- SPX Elliott Wave Analysis - Weekly - Double Three w/ ZigZag
If the first leg down is 5 waves, then the zigzag pattern above is likely (5 waves, 3 waves, then 5 waves).
2022-10-02- SPX Elliott Wave Analysis - Weekly - Cycle II
It's also possible that the whole correct is just a regular 5-wave corrective pattern. From here on out, that pattern isn't much different than the Double three with a zigzag in terms of inflation points and support/resistance levels.
COMMENTARY
Last week's call for volatility didn't disappoint. Although I don't think anyone was expecting a near collapse of U.K. pension funds!
We also saw some interventions in currency markets by the central banks of Japan and China. Not as unexpected, but still volatility inducing.
Q3 earnings are starting to roll in, and the news so far is "not good". Many firms, especially retail, are sitting on too much inventory. Even firms like Nike ($NKE) struggled, and they are typically on top of such things.
More worrisome are the increasing number of downward earnings revisions and outright misses. It's true that there's a lot of bearish sentiment and most types of investment instruments are oversold levels. It's not true that too much negativity means stocks can only go up.
Long-term prices are based on forward looking earnings. If companies miss on earnings or beat but revise their estimates downward, then their stock is almost immediately "overvalued", and usually results in a price drop.
Moving on to numbers that aren't dropping, remember the post a few weeks back mentioning the Fed's focus on PCE, rather than CPI? Well, PCE came out last week and was higher than expected. The higher reading wasn't too surprising, given that CPI also came in higher than expected. But higher PCE also means a pivot or pause in interest rate hikes is even less likely. Or, to put it another way, justifying a pivot or pause requires an increasingly "bad" situation to unfold.
Almost on cue, the scuttlebutt this weekend was that a major financial institution is in serious financial trouble due to recent interest rate and currency swings. If I had to guess, I'd go with Credit Suisse based on their widening credit spreads; not quite as high as 2008, but it's not 2008 either. Hopefully the rumors turn out to be false, but they're not the type of thing you hear at the start of a new bull market or big rally either.
Best To Your Week!
P.S. If you find this research helpful, please tell a friend. If you don't, tell an enemy.
Sources: Bloomberg, CNBC, Hedgeye, U.S. Bureau of Labor Statistics
Share this Post on:

How to Make Money in Stocks: A Winning System in Good Times and Bad.
It's one of my favorites.
I regularly share articles and other news of interest on:
Twitter (@investsafely)
Facebook (@InvestSafely)
LinkedIn (@Invest-Safely)
Instagram (@investsafely)
Invest Safely, LLC is an independent investment research and online financial media company. Use of Invest Safely, LLC and any other products available through invest-safely.com is subject to our Terms of Service and Privacy Policy. Not a recommendation to buy or sell any security.
Charts provided courtesy of stockcharts.com.
For historical Elliott Wave commentary and analysis, go to ELLIOTT WAVE lives on by Tony Caldaro. Current counts can be found at: Pretzel Logic, and 12345ABCDEWXYZ
Once a year, I review the market outlook signals as if they were a mechanical trading system, while pointing out issues and making adjustments. The goal is to give you to give you an example of how to analyze and continuously improve your own systems.
- 2015 Performance - Stock Market Outlook
- 2016 Performance - Stock Market Outlook
- 2017 Performance - Stock Market Outlook
- 2018 Performance - Stock Market Outlook
- 2019 Performance - Stock Market Outlook
- 2020 Performance - Stock Market Outlook
IMPORTANT DISCLOSURE INFORMATION
This material is for general communication and is provided for informational and/or educational purposes only. None of the content should be viewed as a suggestion that you take or refrain from taking any action nor as a recommendation for any specific investment product, strategy, or other such purpose. Certain information contained herein has been obtained from third-party sources believed to be reliable, but we cannot guarantee its accuracy or completeness.
To the extent that a reader has any questions regarding the applicability of any specific issue discussed above to his/her individual situation, he/she is encouraged to consult with the professional advisors of his/her choosing. Invest Safely, LLC is not a law firm, certified public accounting firm, or registered investment advisor and no portion of its content should be construed as legal, accounting, or investment advice.
The material is not to be construed as an offer or a recommendation to buy or sell a security nor is it to be construed as investment advice. Additionally, the material accessible through this website does not constitute a representation that the investments described herein are suitable or appropriate for any person.
Hypothetical Presentations:
Any referenced performance is “as calculated” using the referenced funds and has not been independently verified. This presentation does not discuss, directly or indirectly, the amount of the profits or losses, realized or unrealized, by any reader or contributor, from any specific funds or securities.
The author and/or any reader may have experienced materially different performance based upon various factors during the corresponding time periods. To the extent that any portion of the content reflects hypothetical results that were achieved by means of the retroactive application of a back-tested model, such results have inherent limitations, including:
Model results do not reflect the results of actual trading using assets, but were achieved by means of the retroactive application of the referenced models, certain aspects of which may have been designed with the benefit of hindsight
Back-tested performance may not reflect the impact that any material market or economic factors might have had on the use of a trading model if the model had been used during the period to actually manage assets
Actual investment results during the corresponding time periods may have been materially different from those portrayed in the model
Past performance may not be indicative of future results. Therefore, no one should assume that future performance will be profitable, or equal to any corresponding historical index.
The S&P 500 Composite Total Return Index (the "S&P") is a market capitalization-weighted index of 500 widely held stocks often used as a proxy for the stock market. Standard & Poor's chooses the member companies for the S&P based on market size, liquidity, and industry group representation. Included are the common stocks of industrial, financial, utility, and transportation companies. The S&P is not an index into which an investor can directly invest. The historical S&P performance results (and those of all other indices) are provided exclusively for comparison purposes only, so as to provide general comparative information to assist an individual in determining whether the performance of a specific portfolio or model meets, or continues to meet investment objective(s). The model and indices performance results do not reflect the impact of taxes.
Investing involves risk (even the “safe” kind)! Past performance does not guarantee or indicate future results. Different types of investments involve varying degrees of underlying risk. Therefore, do not assume that future performance of any specific investment or investment strategy be suitable for your portfolio or individual situation, will be profitable, equal any historical performance level(s), or prove successful (including the investments and/or investment strategies describe on this site).
Investing Process Links
Stabilize- Organize your $$$
- Manage your $$$
Plan
- Why You Invest
- Ways to Invest
- Where to Invest
- What to Invest In
Execute
- When to Invest
- How Much to Invest
- Buying & Selling
Monitor
- Track The Market
- Track Your Returns
Reflect & Adjust
- Improve Your Returns
- Adjust your Holdings
Popular Pages
- Jim Cramer- Personal Incomes Statements
- Hyperinflation
- Calculating Beta
- SMART Financial Goals
Blogroll
- Advisor Perspectives- Dividend Growth Investor
- Elliott Wave Lives On
- On My Radar | CMG Wealth
- Sure Dividend
- The Big Picture
- The Fat Pitch
- Thoughts from the Frontline
- Trader Feed
Sponsored Links
Invest Safely provides valuable, time-saving info about personal finance, money management, and investing.


