Stock Market Outlook
For The Week Of August 28th = Uptrend
INDICATORS
-
ADX Directional Indicators: Downtrend
Price & Volume Action: Uptrend
Elliott Wave Analysis: Mixed
The S&P500 ($SPX) fell 4%, with most of that damage occurring after Fed Chair Powell's comments on Friday morning. Earlier in the week, the index fell back into the support/resistance battleground that's been with us since late February and early March. The SPX enters the week just above its 50-day moving average.
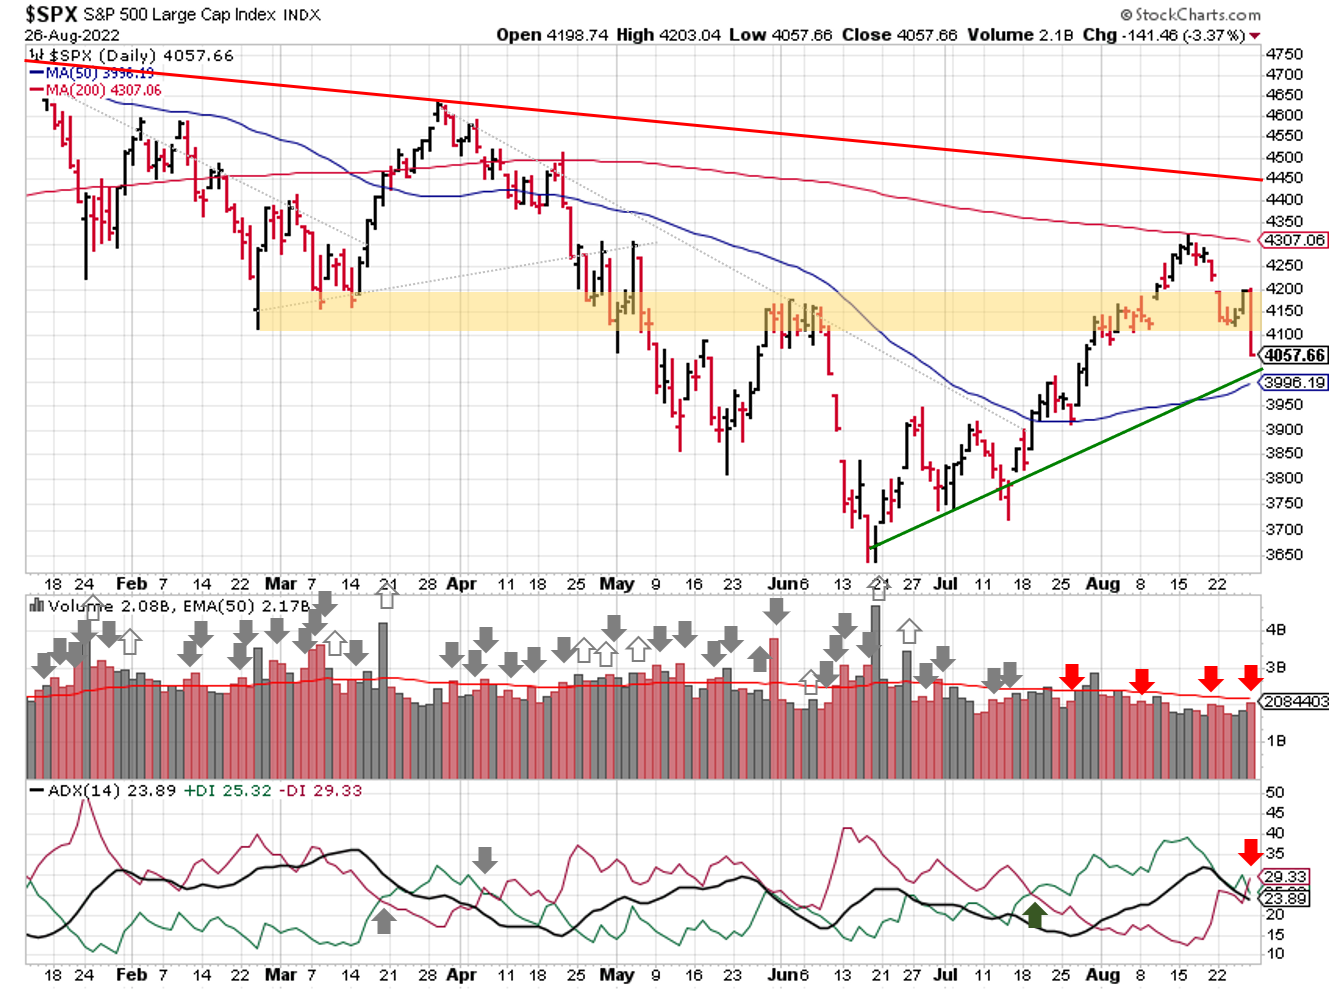
2022-08-28-SPX Trendline Analysis - Daily
The ADX directional indicators flipped on Friday, moving this signal to a downtrend. Price & volume remains in an uptrend, thanks to the low number of distribution days. Leading stocks (e.g. IBD Innovator 50 $FFTY) held up well all things considered. Watch for high volume down days, especially those that cut through the 50-day.
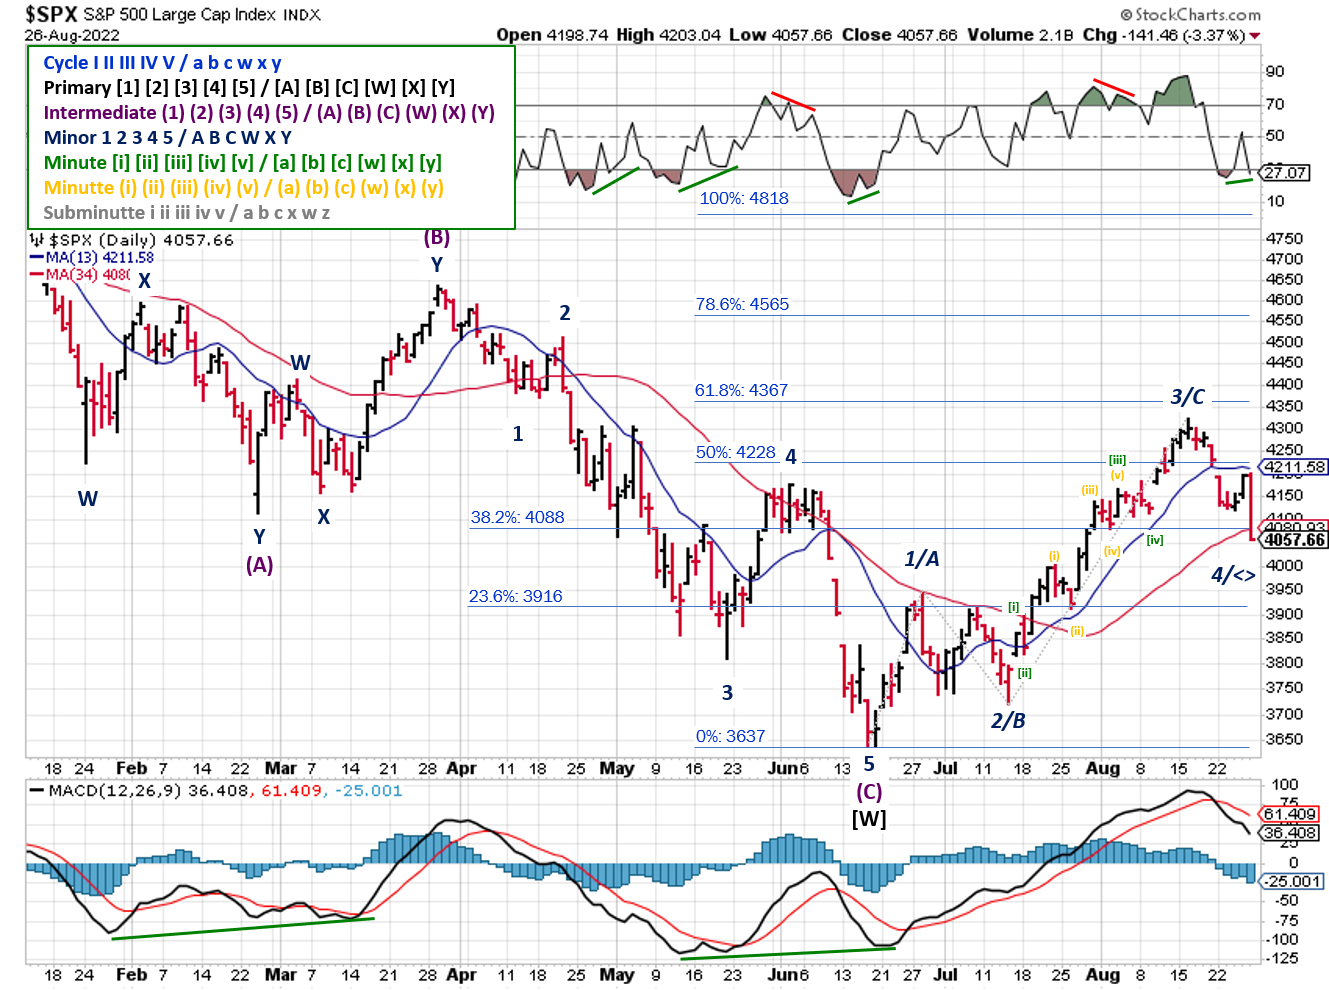
2022-08-28- SPX Elliott Wave Analysis - Daily - Primary X
Elliott Wave is still mixed. Bearish viewpoints gained popularity last week, as did the number of possible wave counts. In all bearish cases, the SPX is in the first wave of a new downtrend. Some bearish counts appear to support a bullish view as they unfold, which is the reason this signal is still mixed. A bullish view remains intact as long as the current down wave (Minor 4) doesn't drop below 3,946 (Minor 1 high). That said, I'd expect the SPX to stay below 4367 if the bear market rally is over.COMMENTARY
The call for choppy price action was spot on, and volatility spiked last week. The SPX's volatility index ($VIX) gapped up last Monday and closed out the week near 26. That's right in the middle of Hedgeye's "chop bucket" (i.e. 20-30), where the market tends to gap down sporadically.
Expanding the view to other indexes, we can see even higher levels of volatility (i.e. risk). Both the Nasdaq and Russell 2000 have their own volatility indexes (i.e. $VXN and $RVX, respectively).

2022-08-28 - U.S. Market Volatility Indexes
The $VXN and $RVX ended the week above 30. A reading above 30 is affectionately referred to as the "F bucket" by Hedgeye, and means there's a high probability of sell-offs...big ones. Keep that in mind when evaluating new trades or existing holdings.
Friday's surge in volatility was a response to Fed Chair Powell's press conference. The size and scale of the sell-off confirms market participants expected "dovish" remarks, which were nowhere to be found.
By dovish, I mean expecting a statement like "as indicated by flattening CPI and PPI data, our aggressive rate hikes have begun to reign in inflation, and this dynamic will play an important role in upcoming rate adjustments". A statement like this would support the "rate hikes will slow down and turn into rate cuts sometime in 2023" narrative that led markets higher in July and August.
Instead, the hawks were out:
The Fed is committed to raising and maintaining interest rates. Period. GDP slows? Meh. Unemployment rises? An unfortunate, but unavoidable, side effect of getting inflation under control.
As inflation improves, expect the narrative to change. CPI and PPI will remain important talking points, but expect to hear more about Personal Consumption Expenditures (called the "PCE").
The PCE Index dropped in July, from 6.8% to 6.3% versus a year ago. Core PCE, which excludes food and energy, came in at 4.6%. The Fed uses Core PCE data as its primary inflation gauge. Bullish commentators are likely to reference this number to justify their case for fewer rate hikes and end of year price targets, since it's close to the Fed's 2% goal.
Best To Your Week!
P.S. If you find this research helpful, please tell a friend. If you don't, tell an enemy.
Sources: Bloomberg, CNBC, Hedgeye, U.S. Bureau of Labor Statistics
Share this Post on:

How to Make Money in Stocks: A Winning System in Good Times and Bad.
It's one of my favorites.
I regularly share articles and other news of interest on:
Twitter (@investsafely)
Facebook (@InvestSafely)
LinkedIn (@Invest-Safely)
Instagram (@investsafely)
Invest Safely, LLC is an independent investment research and online financial media company. Use of Invest Safely, LLC and any other products available through invest-safely.com is subject to our Terms of Service and Privacy Policy. Not a recommendation to buy or sell any security.
Charts provided courtesy of stockcharts.com.
For historical Elliott Wave commentary and analysis, go to ELLIOTT WAVE lives on by Tony Caldaro. Current counts can be found at: Pretzel Logic, and 12345ABCDEWXYZ
Once a year, I review the market outlook signals as if they were a mechanical trading system, while pointing out issues and making adjustments. The goal is to give you to give you an example of how to analyze and continuously improve your own systems.
- 2015 Performance - Stock Market Outlook
- 2016 Performance - Stock Market Outlook
- 2017 Performance - Stock Market Outlook
- 2018 Performance - Stock Market Outlook
- 2019 Performance - Stock Market Outlook
- 2020 Performance - Stock Market Outlook
IMPORTANT DISCLOSURE INFORMATION
This material is for general communication and is provided for informational and/or educational purposes only. None of the content should be viewed as a suggestion that you take or refrain from taking any action nor as a recommendation for any specific investment product, strategy, or other such purpose. Certain information contained herein has been obtained from third-party sources believed to be reliable, but we cannot guarantee its accuracy or completeness.
To the extent that a reader has any questions regarding the applicability of any specific issue discussed above to his/her individual situation, he/she is encouraged to consult with the professional advisors of his/her choosing. Invest Safely, LLC is not a law firm, certified public accounting firm, or registered investment advisor and no portion of its content should be construed as legal, accounting, or investment advice.
The material is not to be construed as an offer or a recommendation to buy or sell a security nor is it to be construed as investment advice. Additionally, the material accessible through this website does not constitute a representation that the investments described herein are suitable or appropriate for any person.
Hypothetical Presentations:
Any referenced performance is “as calculated” using the referenced funds and has not been independently verified. This presentation does not discuss, directly or indirectly, the amount of the profits or losses, realized or unrealized, by any reader or contributor, from any specific funds or securities.
The author and/or any reader may have experienced materially different performance based upon various factors during the corresponding time periods. To the extent that any portion of the content reflects hypothetical results that were achieved by means of the retroactive application of a back-tested model, such results have inherent limitations, including:
Model results do not reflect the results of actual trading using assets, but were achieved by means of the retroactive application of the referenced models, certain aspects of which may have been designed with the benefit of hindsight
Back-tested performance may not reflect the impact that any material market or economic factors might have had on the use of a trading model if the model had been used during the period to actually manage assets
Actual investment results during the corresponding time periods may have been materially different from those portrayed in the model
Past performance may not be indicative of future results. Therefore, no one should assume that future performance will be profitable, or equal to any corresponding historical index.
The S&P 500 Composite Total Return Index (the "S&P") is a market capitalization-weighted index of 500 widely held stocks often used as a proxy for the stock market. Standard & Poor's chooses the member companies for the S&P based on market size, liquidity, and industry group representation. Included are the common stocks of industrial, financial, utility, and transportation companies. The S&P is not an index into which an investor can directly invest. The historical S&P performance results (and those of all other indices) are provided exclusively for comparison purposes only, so as to provide general comparative information to assist an individual in determining whether the performance of a specific portfolio or model meets, or continues to meet investment objective(s). The model and indices performance results do not reflect the impact of taxes.
Investing involves risk (even the “safe” kind)! Past performance does not guarantee or indicate future results. Different types of investments involve varying degrees of underlying risk. Therefore, do not assume that future performance of any specific investment or investment strategy be suitable for your portfolio or individual situation, will be profitable, equal any historical performance level(s), or prove successful (including the investments and/or investment strategies describe on this site).
Investing Process Links
Stabilize- Organize your $$$
- Manage your $$$
Plan
- Why You Invest
- Ways to Invest
- Where to Invest
- What to Invest In
Execute
- When to Invest
- How Much to Invest
- Buying & Selling
Monitor
- Track The Market
- Track Your Returns
Reflect & Adjust
- Improve Your Returns
- Adjust your Holdings
Popular Pages
- Jim Cramer- Personal Incomes Statements
- Hyperinflation
- Calculating Beta
- SMART Financial Goals
Blogroll
- Advisor Perspectives- Dividend Growth Investor
- Elliott Wave Lives On
- On My Radar | CMG Wealth
- Sure Dividend
- The Big Picture
- The Fat Pitch
- Thoughts from the Frontline
- Trader Feed
Sponsored Links
Invest Safely provides valuable, time-saving info about personal finance, money management, and investing.


