Stock Market Outlook
For The Week Of June 19th = Downtrend
INDICATORS
-
ADX Directional Indicators: Downtrend
Price & Volume Action: Downtrend
Elliott Wave Analysis: Downtrend
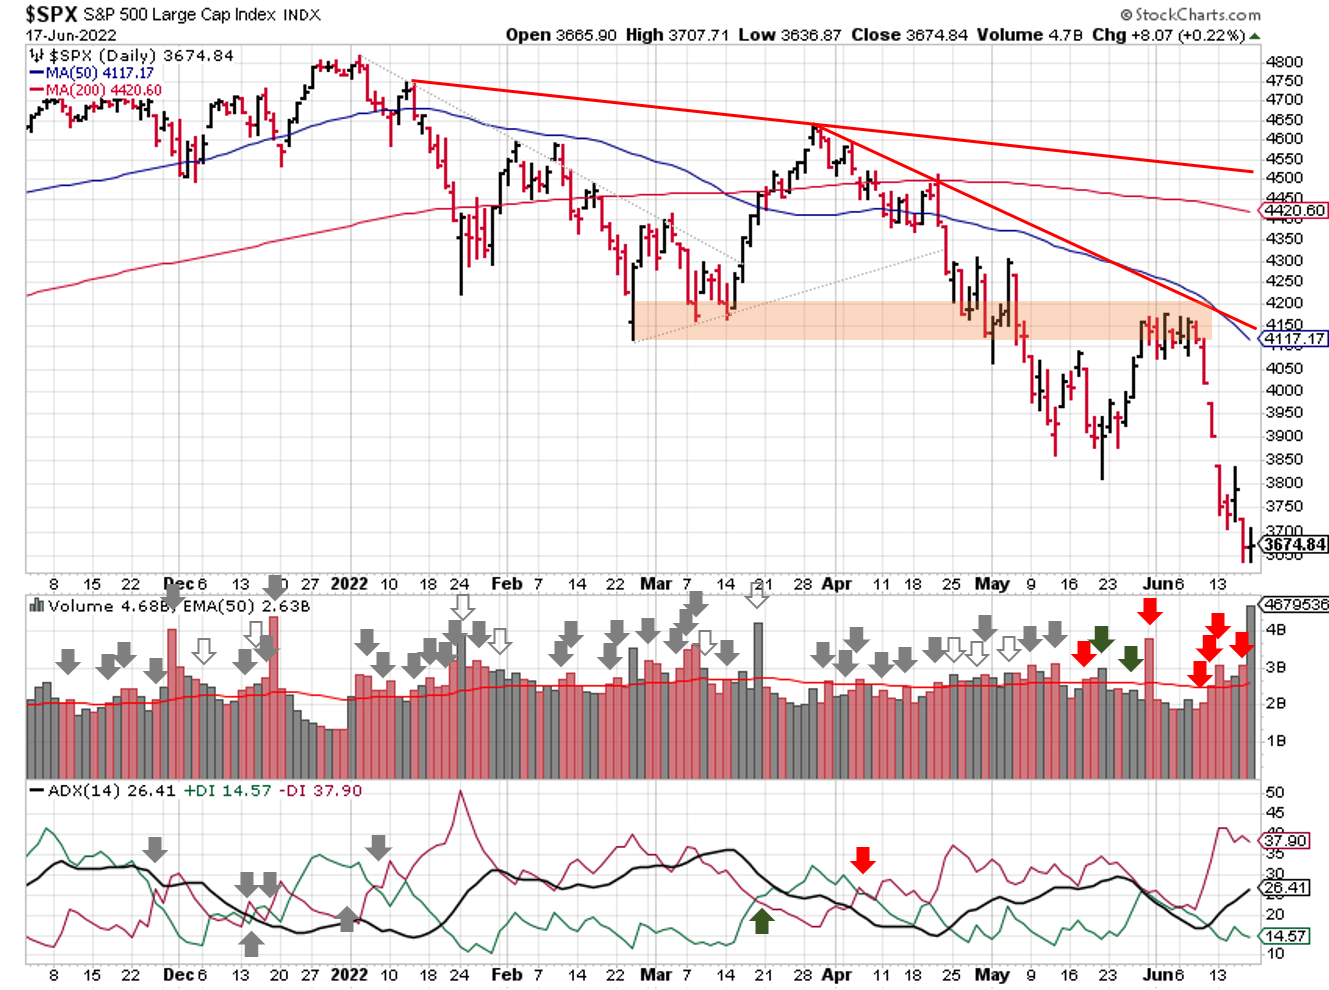
2022-06-19-SPX Trendline Analysis - Daily
The index ended the week ~6% lower, and sits ~12% below the 50-day and ~20% below the 200-day. For a bit of context, at the height of the COVID crash, the SPX was about 36% below the 200-day; the Great Recession reached 66%, while the Dot.com crash hit 37%.
The ADX and price/volume signals are bearish, and Elliott Wave is back to a downtrend.
Between the Fed meeting and the massive option expiration, the stage was set for a potential rally back to resistance near 4400. Instead, the pre-market gap-downs on Monday and Thursday increased the probability that the "3-wave pattern" completed in early June (verses the prior count that put the index in the middle of that pattern).
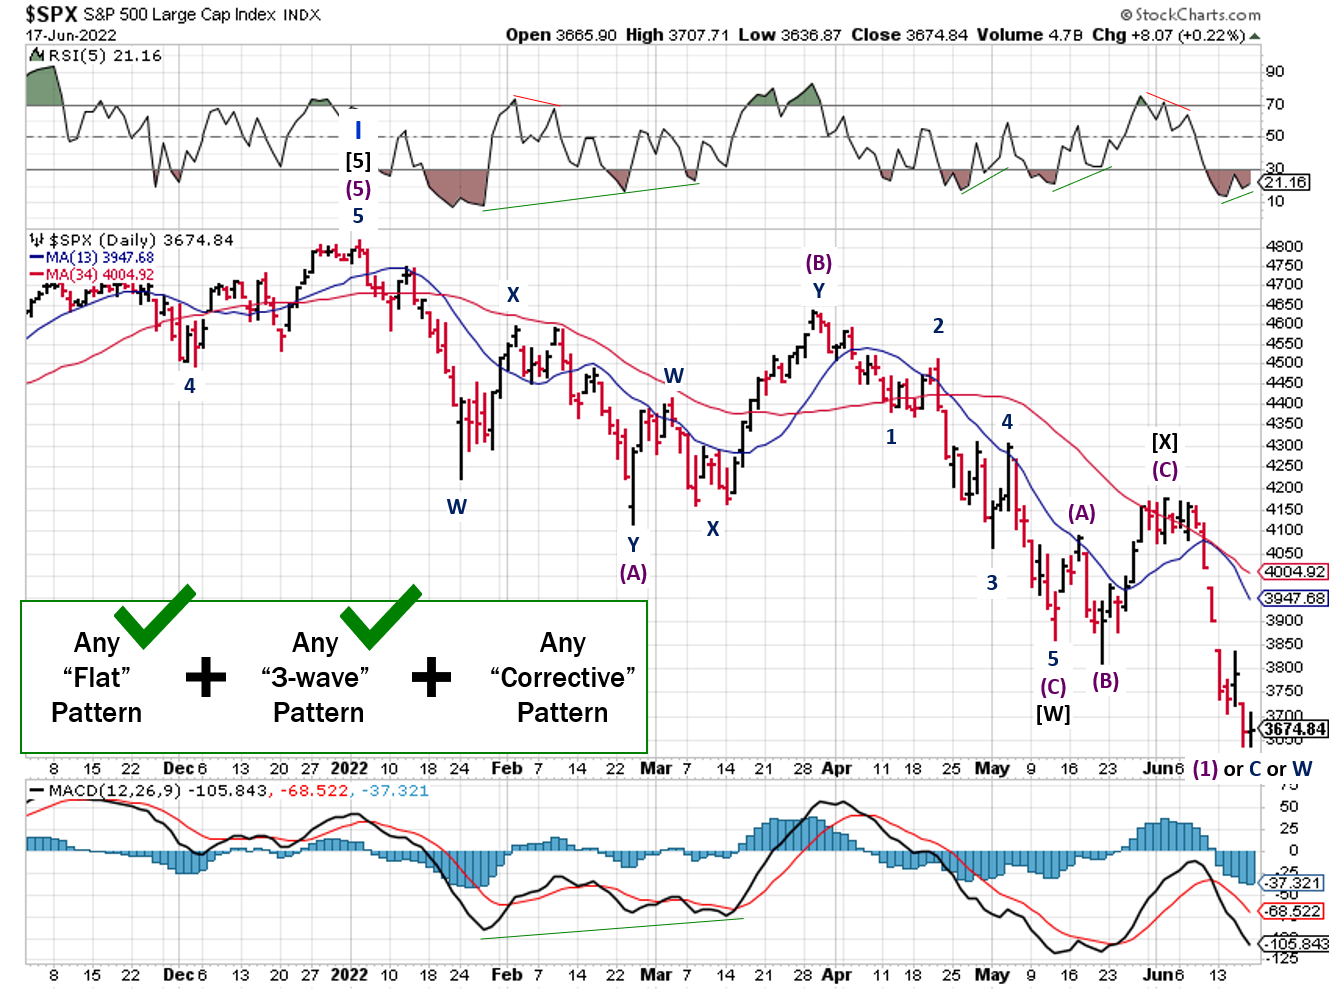
2022-06-19- SPX Elliott Wave Analysis - Daily - Primary Y
The good news? Regardless of which count prevails (both are still possible at this point), the market is due for a counter-trend rally. The 3600 level is prior resistance turned support (August 2020), and a positive divergence developed in the RSI as well, so maybe this week will give traders some relief.
Before you break out the champagne, keep in mind that the bear market is just getting started...the SPX hasn't even reached the 38% retracement level yet.
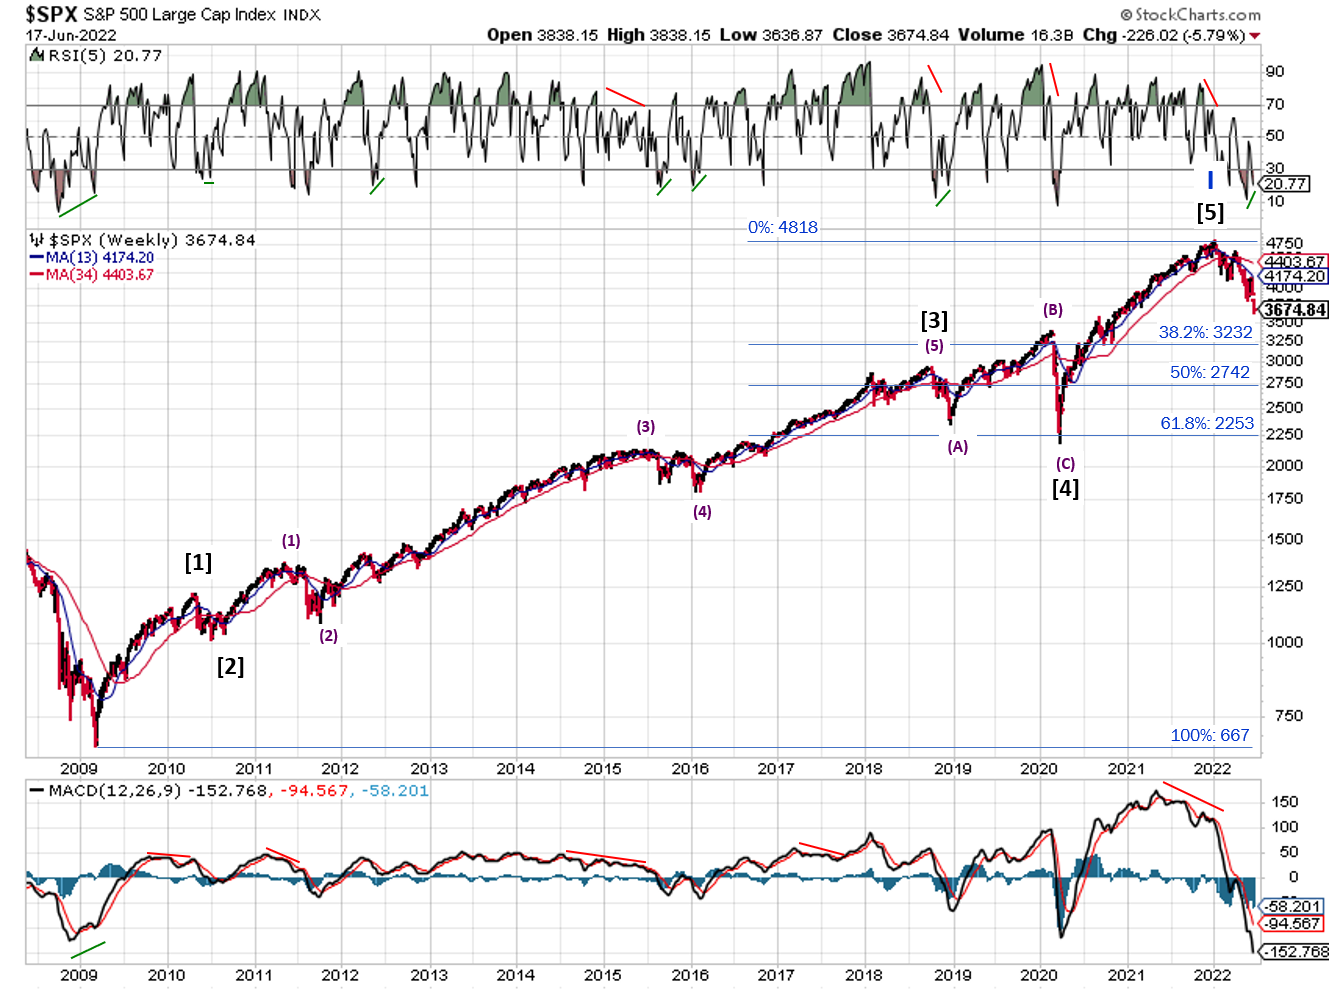
2022-06-19- SPX Elliott Wave Analysis - Weekly - Cycle II
COMMENTARY
As expected, a lot of volatility last week. Things kicked off with a bang, with another cryptocurrency-related blow-up. This time it was an exchange (Celsius) halting all withdrawals from its platform. Unfortunately, blow-ups like this will occur more frequently as liquidity is removed from the system (i.e. qualitative tightening).
Then "someone" leaked that the Fed was likely to hike interest rates by 0.75%, rather than the 0.5% they forecast in May. The rumor quickly spread, and basically became a sure thing in the eyes of most financial media. They even debated whether the Fed should raise by 1% or more! On Wednesday, the Fed did raise rates by 0.75%, citing recent inflation data shifting their view.
Back in reality, the near-term impact to inflation is minimal, and that wouldn't have changed if the Fed hiked rates 2%! Markets would've dropped bigly, but inflation? Not so much. For the rest of the year, supply and demand factors are pretty much locked in. Even if we've already seen "peak" inflation, the numbers will remain high for a while, so strap in.
The situation isn't any better across the pond, as the European Central Bank (ECB) did an about face and is now set to raise interest rates. The ECB confirmed a 0.25% hike in July (its first increase in more than a decade), and hinted at a larger increase in September if inflation remains high. And just like the U.S., the hikes are in spite of the fact that the Euro-zone is experiencing an economic slowdown.
A short trading week in the U.S., with the markets closed for Juneteenth National Independence Day, to celebrate the end of slavery in the United States.
Best To Your Week!
If you find this research helpful, please tell a friend. If you don't find it helpful, tell an enemy.
I regularly share articles and other news of interest via on Twitter (@investsafely), Facebook (InvestSafely),LinkedIn (Invest-Safely), and Instagram (@investsafely).

How to Make Money in Stocks: A Winning System in Good Times and Bad.
It's one of my favorites.
Invest Safely, LLC is an independent investment research and online financial media company. Use of Invest Safely, LLC and any other products available through invest-safely.com is subject to our Terms of Service and Privacy Policy. Not a recommendation to buy or sell any security.
Charts provided courtesy of stockcharts.com.
For historical Elliott Wave commentary and analysis, go to ELLIOTT WAVE lives on by Tony Caldaro. Current counts can be found at: Pretzel Logic, and 12345ABCDEWXYZ
Once a year, I review the market outlook signals as if they were a mechanical trading system, while pointing out issues and making adjustments. The goal is to give you to give you an example of how to analyze and continuously improve your own systems.
- 2015 Performance - Stock Market Outlook
- 2016 Performance - Stock Market Outlook
- 2017 Performance - Stock Market Outlook
- 2018 Performance - Stock Market Outlook
- 2019 Performance - Stock Market Outlook
- 2020 Performance - Stock Market Outlook
IMPORTANT DISCLOSURE INFORMATION
This material is for general communication and is provided for informational and/or educational purposes only. None of the content should be viewed as a suggestion that you take or refrain from taking any action nor as a recommendation for any specific investment product, strategy, or other such purpose. Certain information contained herein has been obtained from third-party sources believed to be reliable, but we cannot guarantee its accuracy or completeness.
To the extent that a reader has any questions regarding the applicability of any specific issue discussed above to his/her individual situation, he/she is encouraged to consult with the professional advisors of his/her choosing. Invest Safely, LLC is not a law firm, certified public accounting firm, or registered investment advisor and no portion of its content should be construed as legal, accounting, or investment advice.
The material is not to be construed as an offer or a recommendation to buy or sell a security nor is it to be construed as investment advice. Additionally, the material accessible through this website does not constitute a representation that the investments described herein are suitable or appropriate for any person.
Hypothetical Presentations:
Any referenced performance is “as calculated” using the referenced funds and has not been independently verified. This presentation does not discuss, directly or indirectly, the amount of the profits or losses, realized or unrealized, by any reader or contributor, from any specific funds or securities.
The author and/or any reader may have experienced materially different performance based upon various factors during the corresponding time periods. To the extent that any portion of the content reflects hypothetical results that were achieved by means of the retroactive application of a back-tested model, such results have inherent limitations, including:
Model results do not reflect the results of actual trading using assets, but were achieved by means of the retroactive application of the referenced models, certain aspects of which may have been designed with the benefit of hindsight
Back-tested performance may not reflect the impact that any material market or economic factors might have had on the use of a trading model if the model had been used during the period to actually manage assets
Actual investment results during the corresponding time periods may have been materially different from those portrayed in the model
Past performance may not be indicative of future results. Therefore, no one should assume that future performance will be profitable, or equal to any corresponding historical index.
The S&P 500 Composite Total Return Index (the "S&P") is a market capitalization-weighted index of 500 widely held stocks often used as a proxy for the stock market. Standard & Poor's chooses the member companies for the S&P based on market size, liquidity, and industry group representation. Included are the common stocks of industrial, financial, utility, and transportation companies. The S&P is not an index into which an investor can directly invest. The historical S&P performance results (and those of all other indices) are provided exclusively for comparison purposes only, so as to provide general comparative information to assist an individual in determining whether the performance of a specific portfolio or model meets, or continues to meet investment objective(s). The model and indices performance results do not reflect the impact of taxes.
Investing involves risk (even the “safe” kind)! Past performance does not guarantee or indicate future results. Different types of investments involve varying degrees of underlying risk. Therefore, do not assume that future performance of any specific investment or investment strategy be suitable for your portfolio or individual situation, will be profitable, equal any historical performance level(s), or prove successful (including the investments and/or investment strategies describe on this site).
Investing Process Links
Stabilize- Organize your $$$
- Manage your $$$
Plan
- Why You Invest
- Ways to Invest
- Where to Invest
- What to Invest In
Execute
- When to Invest
- How Much to Invest
- Buying & Selling
Monitor
- Track The Market
- Track Your Returns
Reflect & Adjust
- Improve Your Returns
- Adjust your Holdings
Popular Pages
- Jim Cramer- Personal Incomes Statements
- Hyperinflation
- Calculating Beta
- SMART Financial Goals
Blogroll
- Advisor Perspectives- Dividend Growth Investor
- Elliott Wave Lives On
- On My Radar | CMG Wealth
- Sure Dividend
- The Big Picture
- The Fat Pitch
- Thoughts from the Frontline
- Trader Feed
Sponsored Links
Invest Safely provides valuable, time-saving info about personal finance, money management, and investing.


