Stock Market Outlook
For The Week Of May 1st = Downtrend
INDICATORS
-
ADX Directional Indicators: Downtrend
Price & Volume Action: Downtrend
Elliott Wave Analysis: Downtrend
The S&P500 ($SPX) dropped a little more than 3% last week. The ADX shows a strengthening trend, and the directional indicators are bearish.
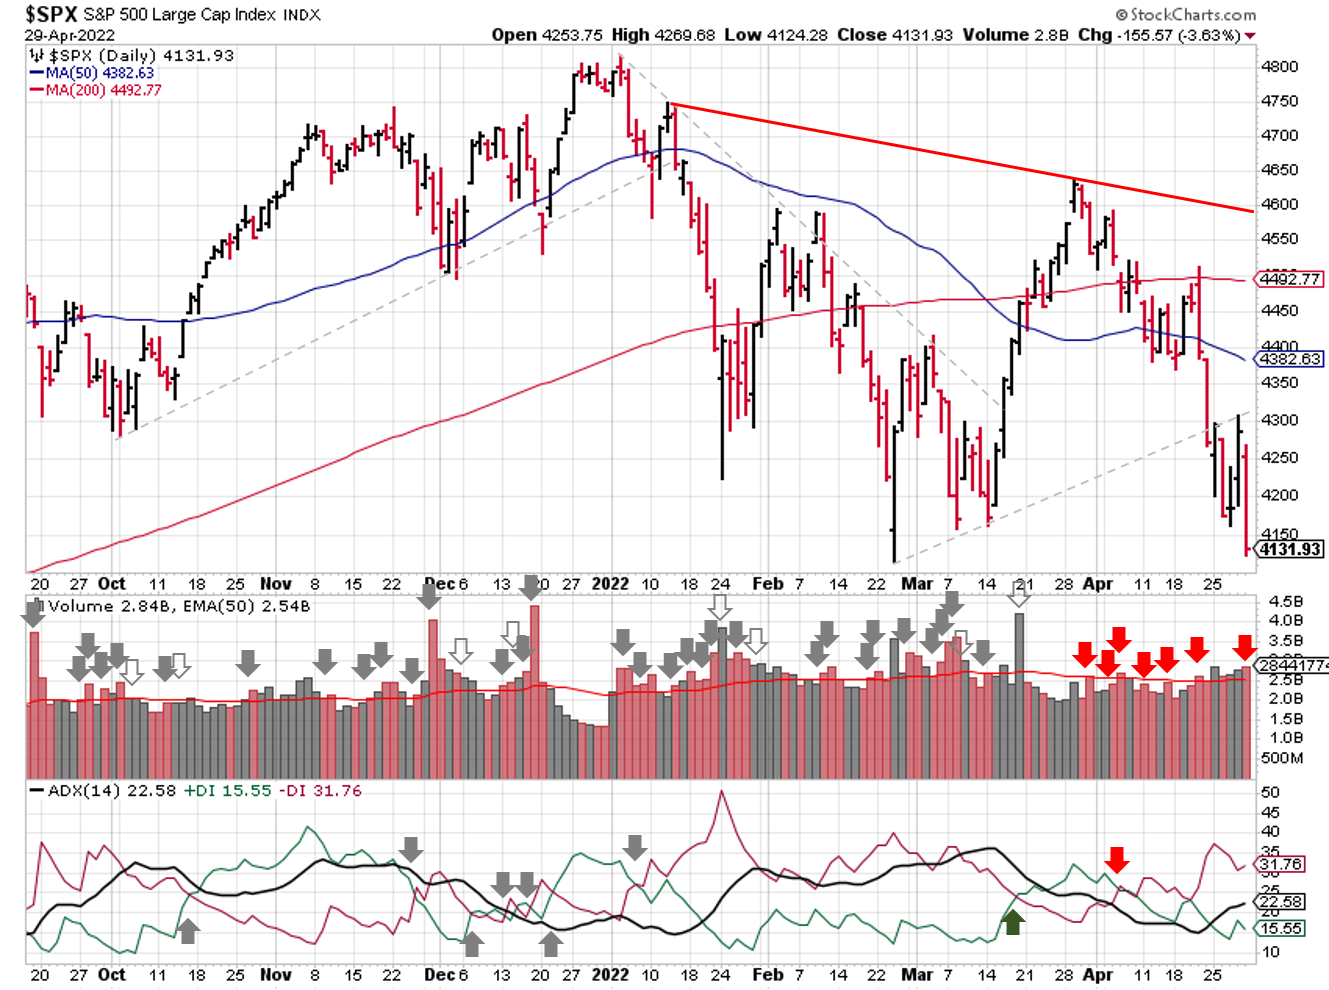
2022-05-01-SPX Trendline Analysis - Daily
The price/volume signal remains bearish. Last week saw elevated trading volumes across the board, but the new low on Friday eliminated any possibility of a new rally.
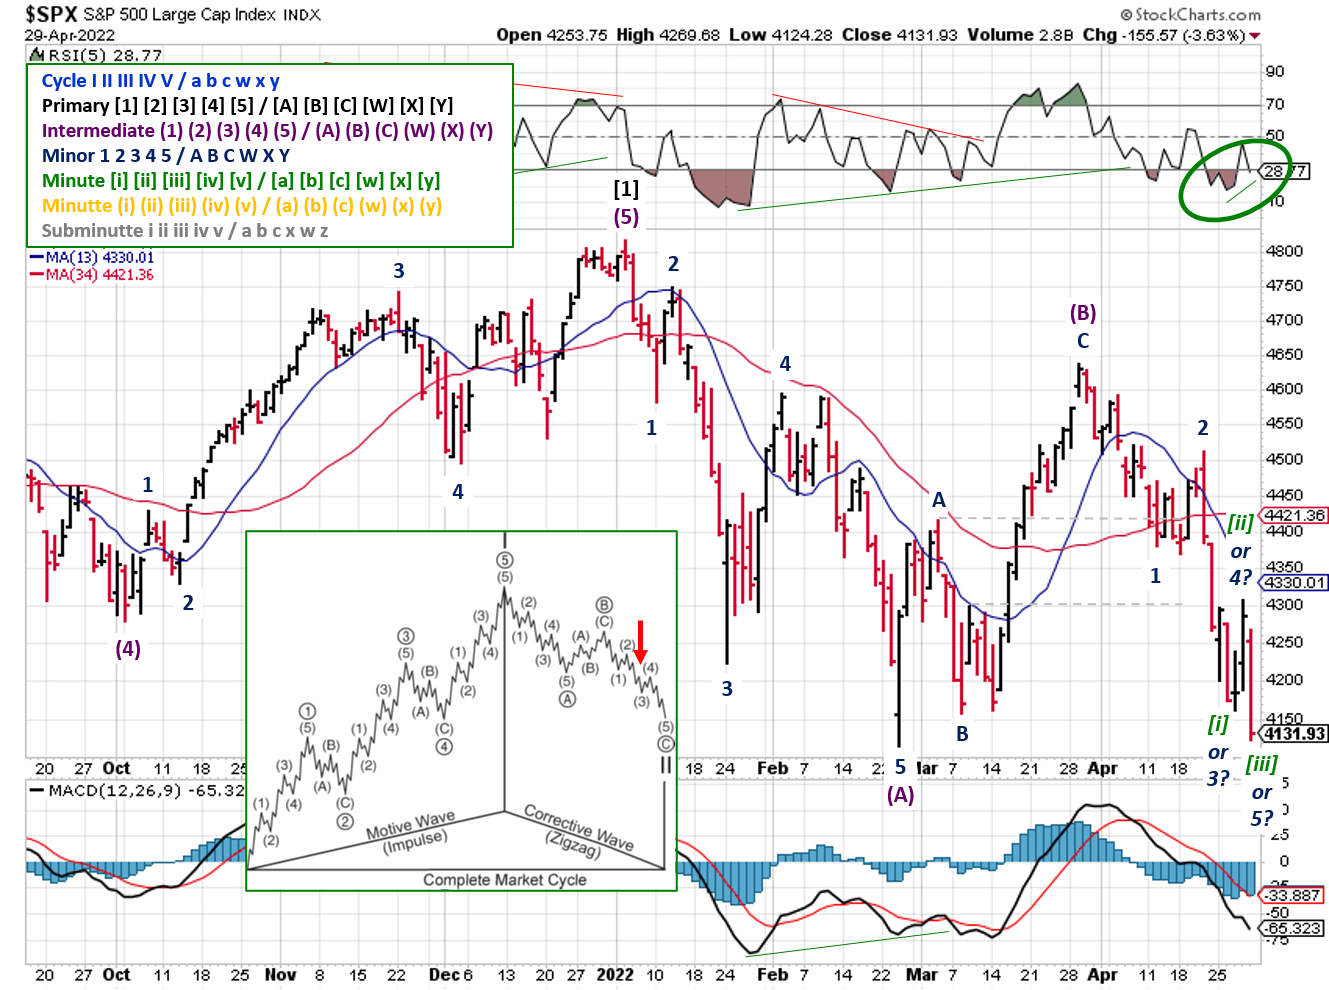
2022-05-01- SPX Elliott Wave Analysis - Daily - Primary 2
Elliott Wave shows the SPX in a corrective wave pattern. A positive divergence developed in the RSI on Friday, but there's more downside risk than upside potential at this point.
COMMENTARY
As expected, the stock markets experienced a lot of volatility. Perhaps "a lot" is an understatement, considering the Volatility Index ($VIX) spent most of the week around 30.
More than 30% of the S&P500 has reported Q1 results so far, including mega-cap names like Google (Alphabet), Amazon, Apple, Facebook (Meta) and Microsoft. Out of that group, only Facebook was able to survive their earnings release without a big sell-off. That's probably because the stock already had a massive sell-off in February.
The initial GDP estimate for Q1 didn't get as much airtime as earnings, inflation, the Fed, or "Markets in Turmoil", but it should have. The figure came in at -1.4%: yes...negative, as in a contraction! The expectation was growth of 1.1% verses last quarter. The year over year comparison looks even worse, considering Q1 2021 GDP grew more than 6%! I don't care how you slice that data, it's bad.
This week, we get another Fed meeting. A rate hike of 0.5% is the most likely scenario at the moment. We'll have to see what they say about the pace of balance sheet adjustments.
Speaking of the Fed, after seeing Q1 inflation data, we know that the "transitory" label was wrong. Now the U.S. Fed will try "catch-up" via interest rate policy and stopping bond purchases. Their plan is that higher interest rates will create financial conditions that slow down demand for goods and services, which reduces the rate of price increases, which reduces inflation readings.
Right now, the market expects that catch-up plan to include ~10 quarter-point hikes, on top of the quantitative tightening. An economy growing at ~6%, like last year (Q1 2021 GDP), could handle it. But an economy that's already contracting? Not so much. Many people think something will break long before than happens, and force the Fed to reverse course and cut rates again.
Remember, inflation and GDP are the two data points that you need to get right when looking for places to invest your hard earned capital. In Q1, we had stagflation: slowing growth with rising inflation. If inflation slows, were in for slowing growth and inflation or "disinflation". Historically, stocks get crushed when GDP growth and inflation are slowing down at the same time.
Hopefully you used the bear market bounce in late March to book profits and rearrange your portfolio. Or at least shifting some things around in early April. With the Fed on a mission to squash inflation, it will be a challenging summer for investors. One more quarter of slowing GDP and we have a recession on our hands.
Best To Your Week!
If you find this research helpful, please tell a friend. If you don't find it helpful, tell an enemy.
I regularly share articles and other news of interest via on Twitter (@investsafely), Facebook (InvestSafely),LinkedIn (Invest-Safely), and Instagram (@investsafely).

How to Make Money in Stocks: A Winning System in Good Times and Bad.
It's one of my favorites.
Invest Safely, LLC is an independent investment research and online financial media company. Use of Invest Safely, LLC and any other products available through invest-safely.com are subject to our Terms of Service and Privacy Policy. Not a recommendation to buy or sell any security.
Charts provided courtesy of stockcharts.com.
For historical Elliott Wave commentary and analysis, go to ELLIOTT WAVE lives on by Tony Caldaro. Current counts can be found at: Pretzel Logic, and 12345ABCDEWXYZ
Once a year, I review the market outlook signals as if they were a mechanical trading system, while pointing out issues and making adjustments. The goal is to give you to give you an example of how to analyze and continuously improve your own systems.
- 2015 Performance - Stock Market Outlook
- 2016 Performance - Stock Market Outlook
- 2017 Performance - Stock Market Outlook
- 2018 Performance - Stock Market Outlook
- 2019 Performance - Stock Market Outlook
- 2020 Performance - Stock Market Outlook
IMPORTANT DISCLOSURE INFORMATION
This material is for general communication and is provided for informational and/or educational purposes only. None of the content should be viewed as a suggestion that you take or refrain from taking any action nor as a recommendation for any specific investment product, strategy, or other such purpose. Certain information contained herein has been obtained from third-party sources believed to be reliable, but we cannot guarantee its accuracy or completeness.
To the extent that a reader has any questions regarding the applicability of any specific issue discussed above to his/her individual situation, he/she is encouraged to consult with the professional advisors of his/her choosing. Invest Safely, LLC is not a law firm, certified public accounting firm, or registered investment advisor and no portion of its content should be construed as legal, accounting, or investment advice.
The material is not to be construed as an offer or a recommendation to buy or sell a security nor is it to be construed as investment advice. Additionally, the material accessible through this website does not constitute a representation that the investments described herein are suitable or appropriate for any person.
Hypothetical Presentations:
Any referenced performance is “as calculated” using the referenced funds and has not been independently verified. This presentation does not discuss, directly or indirectly, the amount of the profits or losses, realized or unrealized, by any reader or contributor, from any specific funds or securities.
The author and/or any reader may have experienced materially different performance based upon various factors during the corresponding time periods. To the extent that any portion of the content reflects hypothetical results that were achieved by means of the retroactive application of a back-tested model, such results have inherent limitations, including:
Model results do not reflect the results of actual trading using assets, but were achieved by means of the retroactive application of the referenced models, certain aspects of which may have been designed with the benefit of hindsight
Back-tested performance may not reflect the impact that any material market or economic factors might have had on the use of a trading model if the model had been used during the period to actually manage assets
Actual investment results during the corresponding time periods may have been materially different from those portrayed in the model
Past performance may not be indicative of future results. Therefore, no one should assume that future performance will be profitable, or equal to any corresponding historical index.
The S&P 500 Composite Total Return Index (the "S&P") is a market capitalization-weighted index of 500 widely held stocks often used as a proxy for the stock market. Standard & Poor's chooses the member companies for the S&P based on market size, liquidity, and industry group representation. Included are the common stocks of industrial, financial, utility, and transportation companies. The S&P is not an index into which an investor can directly invest. The historical S&P performance results (and those of all other indices) are provided exclusively for comparison purposes only, so as to provide general comparative information to assist an individual in determining whether the performance of a specific portfolio or model meets, or continues to meet investment objective(s). The model and indices performance results do not reflect the impact of taxes.
Investing involves risk (even the “safe” kind)! Past performance does not guarantee or indicate future results. Different types of investments involve varying degrees of underlying risk. Therefore, do not assume that future performance of any specific investment or investment strategy be suitable for your portfolio or individual situation, will be profitable, equal any historical performance level(s), or prove successful (including the investments and/or investment strategies describe on this site).
Investing Process Links
Stabilize- Organize your $$$
- Manage your $$$
Plan
- Why You Invest
- Ways to Invest
- Where to Invest
- What to Invest In
Execute
- When to Invest
- How Much to Invest
- Buying & Selling
Monitor
- Track The Market
- Track Your Returns
Reflect & Adjust
- Improve Your Returns
- Adjust your Holdings
Popular Pages
- Jim Cramer- Personal Incomes Statements
- Hyperinflation
- Calculating Beta
- SMART Financial Goals
Blogroll
- Advisor Perspectives- Dividend Growth Investor
- Elliott Wave Lives On
- On My Radar | CMG Wealth
- Sure Dividend
- The Big Picture
- The Fat Pitch
- Thoughts from the Frontline
- Trader Feed
Sponsored Links
Invest Safely provides valuable, time-saving info about personal finance, money management, and investing.


