Stock Market Outlook
For The Week Of April 24th = Downtrend
INDICATORS
-
ADX Directional Indicators: Downtrend
Price & Volume Action: Downtrend
Elliott Wave Analysis: Downtrend
The S&P500 ($SPX) dropped 2.7%...that's just short of 5% in the past two weeks. The index started off well, rallying from support at the 50-day moving average to 200-day. From there, the index fell back to the 50-day on higher volume and then kept falling into the close on Friday.
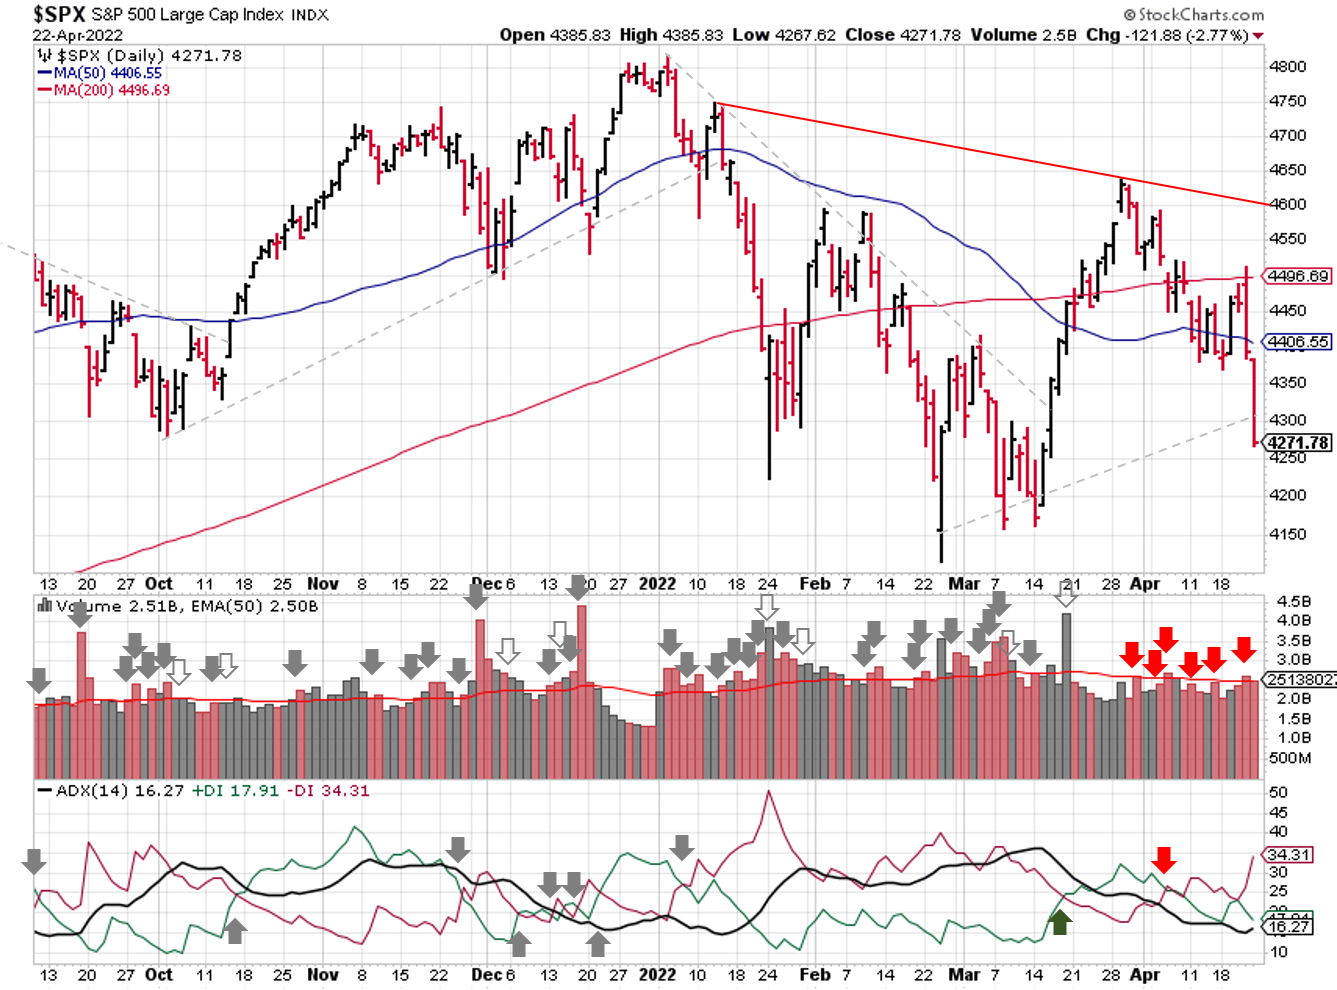
2022-04-24-SPX Trendline Analysis - Daily
The ADX is still below 20, so the trend is weak, but the directional indicators are bearish.
The price/volume signal shows a downtrend in place. Institutional investors sold after late-March rally, evidenced by many distributions days during the past 5 weeks. Thursday's session ticked the box mentioned last week, in terms of distribution days and price action needed to shift the signal.
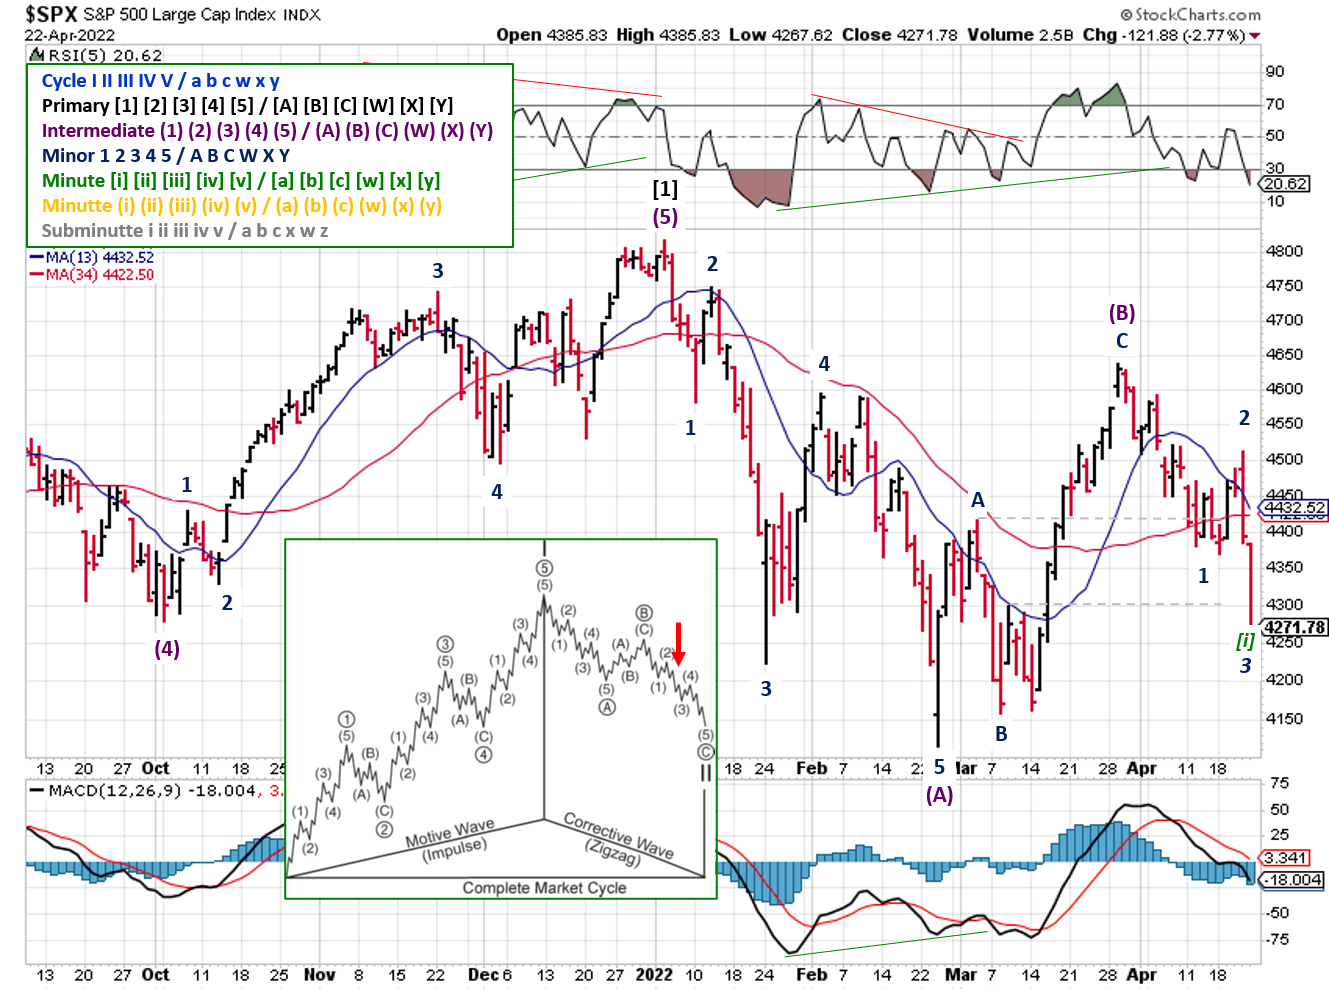
2022-04-24- SPX Elliott Wave Analysis - Daily - Primary 2
Elliott Wave confirmed the downtrend as well, although the Minor 2 was shorter than expected. Overall, Primary 2 is acting like zigzag corrective wave (5 waves down, 3 waves up, 5 waves down). We’ll have to see what price action is like this week, but the current Minor 3 kicked off with a lot of volatility, just like the past Minor 3 in mid-January.
COMMENTARY
The Fed continues to talk about fighting inflation, and Powell confirmed a 0.5% rate hike is on the table for May. Based on the last announcement, he's probably telling everyone that the Fed will hike rates 0.5%, without actually saying it.
There is a growing expectation that the Fed will hike rates until "something breaks", and the 2022 Fed Funds Futures is pricing in 10 rate hikes. I expect something to break before we get there, but stranger things have happened.
#earnings for the week https://t.co/lObOE0dgsr $FB $AAPL $MSFT $AMZN $PYPL $GOOGL $KO $UPS $ATVI $TWTR $XOM $BA $F $GE $SPOT $PEP $ROKU $MMM $CVX $QCOM $VLO $RTX $CL $INTC $JBLU $V $WM $CAT $NOK $LUV $GM $DHI $HOOD $ENPH $CVE $MA $ABBV $OTIS $PHG $CMG $MCD $MRK $DORM $X $ADM pic.twitter.com/Q2N0mmLZyB
— Earnings Whispers (@eWhispers) April 23, 2022
As you can see, this week is jam packed with the earnings releases of companies that are widely held by all sorts of investors. There are several names from the Dividend Aristocrats and Dividend Kings lists, as well as 4 of the 5 largest components of the S&P reporting:
- Apple = ~7% of the index's total value
- Microsoft = ~6%
- Alphabet = ~4% (Class A + Class C Shares)
- Amazon = ~4%
If last week was any indication, we're in for a lot of volatility this week. Weak earnings are one thing, but lowering guidance or mentioning headwinds and slow downs will cause investors to press the sell button; HCA Healthcare ($HCA) and Verizon ($VZ) come to mind.
Looking for shelter from the inflation storm? Energy, utilities, and consumer staples have the most pricing power, and will probably be the "least bad". Technology and consumer discretionary get hurt the most.
Several readers emailed me last week, commenting that their signaling process had already shifted to a downtrend and/or bearish outlook. I think that's fantastic! One, because they made some moves that saved them from losing money. And two, because they created a process and executed it!
This stock market outlook is just an example of how to evaluate market conditions, as well as how to make improvements over time. It's better than nothing, but use it as a tool to get you started. Every investor has a different situation and different needs, so every investor needs their own process with their own signal(s) for the things they are trading.
Best To Your Week!
If you find this research helpful, please tell a friend. If you don't find it helpful, tell an enemy.
I regularly share articles and other news of interest via on Twitter (@investsafely), Facebook (InvestSafely),LinkedIn (Invest-Safely), and Instagram (@investsafely).

How to Make Money in Stocks: A Winning System in Good Times and Bad.
It's one of my favorites.
Invest Safely, LLC is an independent investment research and online financial media company. Use of Invest Safely, LLC and any other products available through invest-safely.com are subject to our Terms of Service and Privacy Policy. Not a recommendation to buy or sell any security.
Charts provided courtesy of stockcharts.com.
For historical Elliott Wave commentary and analysis, go to ELLIOTT WAVE lives on by Tony Caldaro. Current counts can be found at: Pretzel Logic, and 12345ABCDEWXYZ
Once a year, I review the market outlook signals as if they were a mechanical trading system, while pointing out issues and making adjustments. The goal is to give you to give you an example of how to analyze and continuously improve your own systems.
- 2015 Performance - Stock Market Outlook
- 2016 Performance - Stock Market Outlook
- 2017 Performance - Stock Market Outlook
- 2018 Performance - Stock Market Outlook
- 2019 Performance - Stock Market Outlook
- 2020 Performance - Stock Market Outlook
IMPORTANT DISCLOSURE INFORMATION
This material is for general communication and is provided for informational and/or educational purposes only. None of the content should be viewed as a suggestion that you take or refrain from taking any action nor as a recommendation for any specific investment product, strategy, or other such purpose. Certain information contained herein has been obtained from third-party sources believed to be reliable, but we cannot guarantee its accuracy or completeness.
To the extent that a reader has any questions regarding the applicability of any specific issue discussed above to his/her individual situation, he/she is encouraged to consult with the professional advisors of his/her choosing. Invest Safely, LLC is not a law firm, certified public accounting firm, or registered investment advisor and no portion of its content should be construed as legal, accounting, or investment advice.
The material is not to be construed as an offer or a recommendation to buy or sell a security nor is it to be construed as investment advice. Additionally, the material accessible through this website does not constitute a representation that the investments described herein are suitable or appropriate for any person.
Hypothetical Presentations:
Any referenced performance is “as calculated” using the referenced funds and has not been independently verified. This presentation does not discuss, directly or indirectly, the amount of the profits or losses, realized or unrealized, by any reader or contributor, from any specific funds or securities.
The author and/or any reader may have experienced materially different performance based upon various factors during the corresponding time periods. To the extent that any portion of the content reflects hypothetical results that were achieved by means of the retroactive application of a back-tested model, such results have inherent limitations, including:
Model results do not reflect the results of actual trading using assets, but were achieved by means of the retroactive application of the referenced models, certain aspects of which may have been designed with the benefit of hindsight
Back-tested performance may not reflect the impact that any material market or economic factors might have had on the use of a trading model if the model had been used during the period to actually manage assets
Actual investment results during the corresponding time periods may have been materially different from those portrayed in the model
Past performance may not be indicative of future results. Therefore, no one should assume that future performance will be profitable, or equal to any corresponding historical index.
The S&P 500 Composite Total Return Index (the "S&P") is a market capitalization-weighted index of 500 widely held stocks often used as a proxy for the stock market. Standard & Poor's chooses the member companies for the S&P based on market size, liquidity, and industry group representation. Included are the common stocks of industrial, financial, utility, and transportation companies. The S&P is not an index into which an investor can directly invest. The historical S&P performance results (and those of all other indices) are provided exclusively for comparison purposes only, so as to provide general comparative information to assist an individual in determining whether the performance of a specific portfolio or model meets, or continues to meet investment objective(s). The model and indices performance results do not reflect the impact of taxes.
Investing involves risk (even the “safe” kind)! Past performance does not guarantee or indicate future results. Different types of investments involve varying degrees of underlying risk. Therefore, do not assume that future performance of any specific investment or investment strategy be suitable for your portfolio or individual situation, will be profitable, equal any historical performance level(s), or prove successful (including the investments and/or investment strategies describe on this site).
Investing Process Links
Stabilize- Organize your $$$
- Manage your $$$
Plan
- Why You Invest
- Ways to Invest
- Where to Invest
- What to Invest In
Execute
- When to Invest
- How Much to Invest
- Buying & Selling
Monitor
- Track The Market
- Track Your Returns
Reflect & Adjust
- Improve Your Returns
- Adjust your Holdings
Popular Pages
- Jim Cramer- Personal Incomes Statements
- Hyperinflation
- Calculating Beta
- SMART Financial Goals
Blogroll
- Advisor Perspectives- Dividend Growth Investor
- Elliott Wave Lives On
- On My Radar | CMG Wealth
- Sure Dividend
- The Big Picture
- The Fat Pitch
- Thoughts from the Frontline
- Trader Feed
Sponsored Links
Invest Safely provides valuable, time-saving info about personal finance, money management, and investing.


