Stock Market Outlook
For The Week Of April 17th = Uptrend
INDICATORS
-
ADX Directional Indicators: Downtrend
Price & Volume Action: Mixed
Elliott Wave Analysis: Mixed
The S&P500 ($SPX) fell 2.1% for the week, unable to break free from the pull of the 50-day moving average.
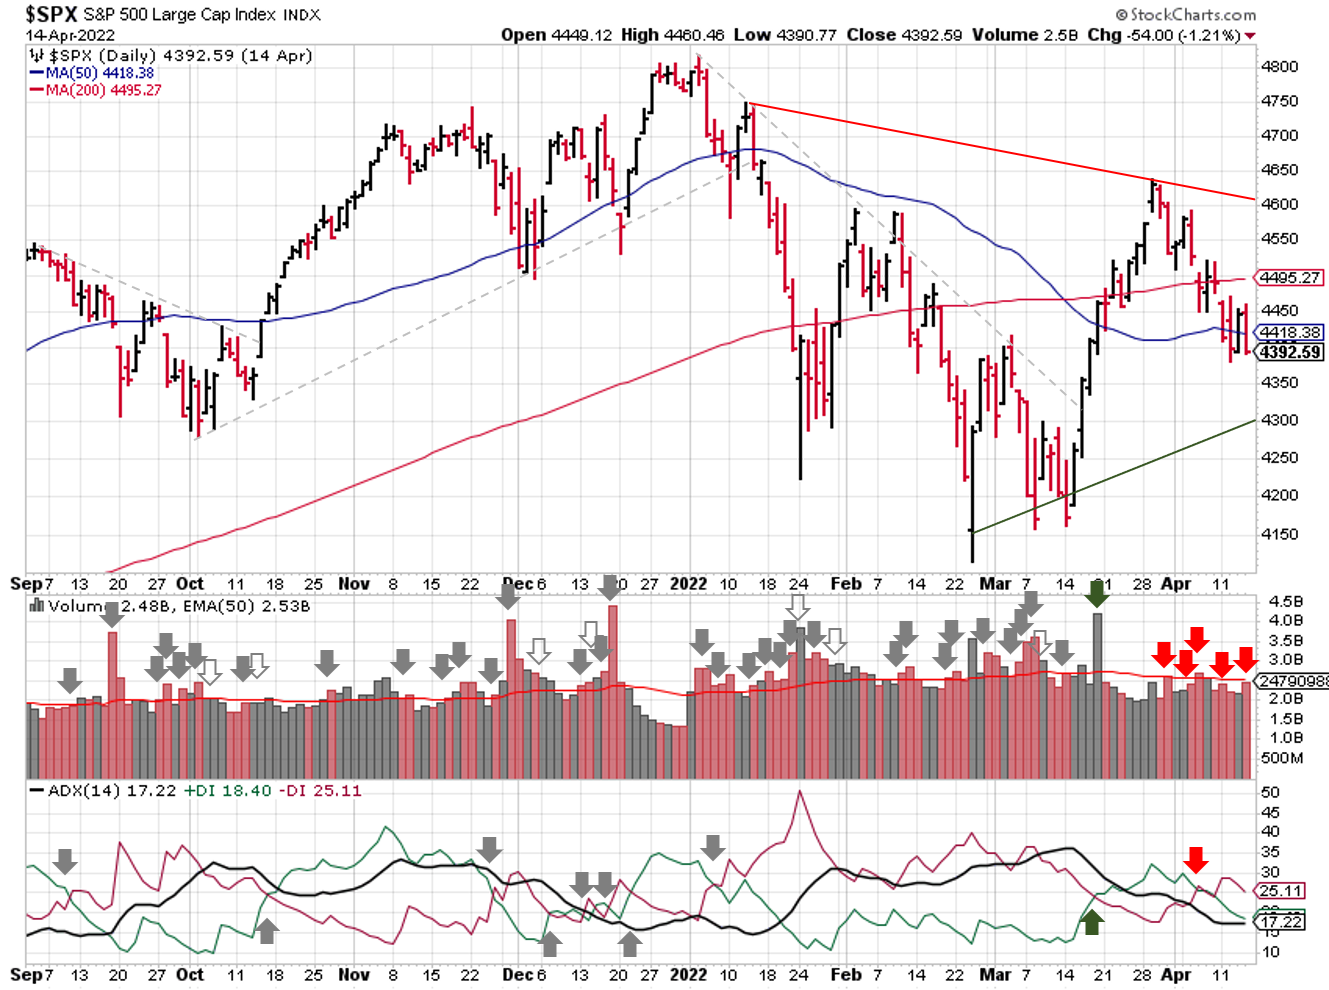
2022-04-17-SPX Trendline Analysis - Daily
The ADX remains continues to signal a downtrend with the directional indicators growing more bearish over the week.
The price/volume signal shifts from an uptrend to mixed. SPX dropped below the 50-day moving average, and also closed below the April 18 follow-through day. Distribution days are also piling up (5), so a down day this week on elevated volume would put this signal into a downtrend, as well as the overall outlook.

2022-04-17- SPX Elliott Wave Analysis - Daily - Primary 2
For Elliott Wave, the count remains mixed. The bounce back to 4650 didn't happen. Instead, the SPX added a 5th wave down, and appears to have completed an impulse wave (rather than a corrective wave). Which means the March 29th high was the likely end of our bear market rally. If so, Minor Wave 2 should now take the market back towards 4650.
COMMENTARY
We got Consumer Price Index (CPI) data last week, and it showed that inflation remains high (duh).
#Inflation Numbers (Consumer Price Index)
— Invest Safely (@investsafely) April 12, 2022
CPI Headline +1.2% M/M
CPI Headline +8.54% Y/Y (highest since Dec. 1981)
---
CPI Core +0.3% M/M
CPI Core +6.5% Y/Y (lower than expected)
---
Energy +48.3% Y/Y (!)
Food +10% Y/Y
Medical +2.9% Y/Y
Shelter +5% Y/Y
Not to be outdone, the Producer Price Index numbers (PPI) came in at an all time high: 11.2% year-over-year! Those increases haven't hit consumers yet.
The "good" news, if you can call it that, is inflation has probably peaked unless there's a massive shock. For y-o-y figures to continue rising, the price of oil needs to reach 180+. If that happens, we'll have things other than inflation to worry about.
Q1 earnings pick up speed this week, with Bank of America, Tesla, and Netflix reporting.
#earnings for the week
— Earnings Whispers (@eWhispers) April 16, 2022
https://t.co/lObOE0dgsr
$TSLA $BAC $NFLX $HAL $SCHW $CLF $JNJ $AAL $SNAP $BK $T $LMT $NUE $PG $AA $IBM $VZ $ASML $UAL $JBHT $SYF $SIFY $SI $FCX $SLB $GNTY $HAS $LRCX $DOW $AXP $TFC $SBNY $ABT $TRV $UNP $PLD $PM $NDAQ $STLD $BKR $ISRG $CSX $ANTM $NEE pic.twitter.com/PqWkcv6vpB
Earnings season started off with a bang, as several companies reported better than expected earnings AND raise guidance. For example, Taiwan Semiconductor Manufacturing (TSM) crushed their numbers for the first quarter AND guided higher for Q2. TSM gapped up at the open, and then sold off throughout the day, ending down ~3%. If we were in a strong bull market, that wouldn't have happened.
Best To Your Week!
If you find this research helpful, please tell a friend. If you don't find it helpful, tell an enemy.
I regularly share articles and other news of interest via on Twitter (@investsafely), Facebook (InvestSafely),LinkedIn (Invest-Safely), and Instagram (@investsafely).

How to Make Money in Stocks: A Winning System in Good Times and Bad.
It's one of my favorites.
Invest Safely, LLC is an independent investment research and online financial media company. Use of Invest Safely, LLC and any other products available through invest-safely.com are subject to our Terms of Service and Privacy Policy. Not a recommendation to buy or sell any security.
Charts provided courtesy of stockcharts.com.
For historical Elliott Wave commentary and analysis, go to ELLIOTT WAVE lives on by Tony Caldaro. Current counts can be found at: Pretzel Logic, and 12345ABCDEWXYZ
Once a year, I review the market outlook signals as if they were a mechanical trading system, while pointing out issues and making adjustments. The goal is to give you to give you an example of how to analyze and continuously improve your own systems.
- 2015 Performance - Stock Market Outlook
- 2016 Performance - Stock Market Outlook
- 2017 Performance - Stock Market Outlook
- 2018 Performance - Stock Market Outlook
- 2019 Performance - Stock Market Outlook
- 2020 Performance - Stock Market Outlook
IMPORTANT DISCLOSURE INFORMATION
This material is for general communication and is provided for informational and/or educational purposes only. None of the content should be viewed as a suggestion that you take or refrain from taking any action nor as a recommendation for any specific investment product, strategy, or other such purpose. Certain information contained herein has been obtained from third-party sources believed to be reliable, but we cannot guarantee its accuracy or completeness.
To the extent that a reader has any questions regarding the applicability of any specific issue discussed above to his/her individual situation, he/she is encouraged to consult with the professional advisors of his/her choosing. Invest Safely, LLC is not a law firm, certified public accounting firm, or registered investment advisor and no portion of its content should be construed as legal, accounting, or investment advice.
The material is not to be construed as an offer or a recommendation to buy or sell a security nor is it to be construed as investment advice. Additionally, the material accessible through this website does not constitute a representation that the investments described herein are suitable or appropriate for any person.
Hypothetical Presentations:
Any referenced performance is “as calculated” using the referenced funds and has not been independently verified. This presentation does not discuss, directly or indirectly, the amount of the profits or losses, realized or unrealized, by any reader or contributor, from any specific funds or securities.
The author and/or any reader may have experienced materially different performance based upon various factors during the corresponding time periods. To the extent that any portion of the content reflects hypothetical results that were achieved by means of the retroactive application of a back-tested model, such results have inherent limitations, including:
Model results do not reflect the results of actual trading using assets, but were achieved by means of the retroactive application of the referenced models, certain aspects of which may have been designed with the benefit of hindsight
Back-tested performance may not reflect the impact that any material market or economic factors might have had on the use of a trading model if the model had been used during the period to actually manage assets
Actual investment results during the corresponding time periods may have been materially different from those portrayed in the model
Past performance may not be indicative of future results. Therefore, no one should assume that future performance will be profitable, or equal to any corresponding historical index.
The S&P 500 Composite Total Return Index (the "S&P") is a market capitalization-weighted index of 500 widely held stocks often used as a proxy for the stock market. Standard & Poor's chooses the member companies for the S&P based on market size, liquidity, and industry group representation. Included are the common stocks of industrial, financial, utility, and transportation companies. The S&P is not an index into which an investor can directly invest. The historical S&P performance results (and those of all other indices) are provided exclusively for comparison purposes only, so as to provide general comparative information to assist an individual in determining whether the performance of a specific portfolio or model meets, or continues to meet investment objective(s). The model and indices performance results do not reflect the impact of taxes.
Investing involves risk (even the “safe” kind)! Past performance does not guarantee or indicate future results. Different types of investments involve varying degrees of underlying risk. Therefore, do not assume that future performance of any specific investment or investment strategy be suitable for your portfolio or individual situation, will be profitable, equal any historical performance level(s), or prove successful (including the investments and/or investment strategies describe on this site).
Investing Process Links
Stabilize- Organize your $$$
- Manage your $$$
Plan
- Why You Invest
- Ways to Invest
- Where to Invest
- What to Invest In
Execute
- When to Invest
- How Much to Invest
- Buying & Selling
Monitor
- Track The Market
- Track Your Returns
Reflect & Adjust
- Improve Your Returns
- Adjust your Holdings
Popular Pages
- Jim Cramer- Personal Incomes Statements
- Hyperinflation
- Calculating Beta
- SMART Financial Goals
Blogroll
- Advisor Perspectives- Dividend Growth Investor
- Elliott Wave Lives On
- On My Radar | CMG Wealth
- Sure Dividend
- The Big Picture
- The Fat Pitch
- Thoughts from the Frontline
- Trader Feed
Sponsored Links
Invest Safely provides valuable, time-saving info about personal finance, money management, and investing.


