Stock Market Outlook
For The Week Of March 6th = Downtrend
INDICATORS
-
ADX Directional Indicators: Downtrend
Price & Volume Action: Downtrend
Elliott Wave Analysis: Downtrend
The S&P500 ($SPX) lost 1.3% for the week, and currently sits ~4% below the 50-day moving average and 3% below the 200-day. The index briefly broke the downward trendline after trading opened on Thursday, but quickly reversed lower.
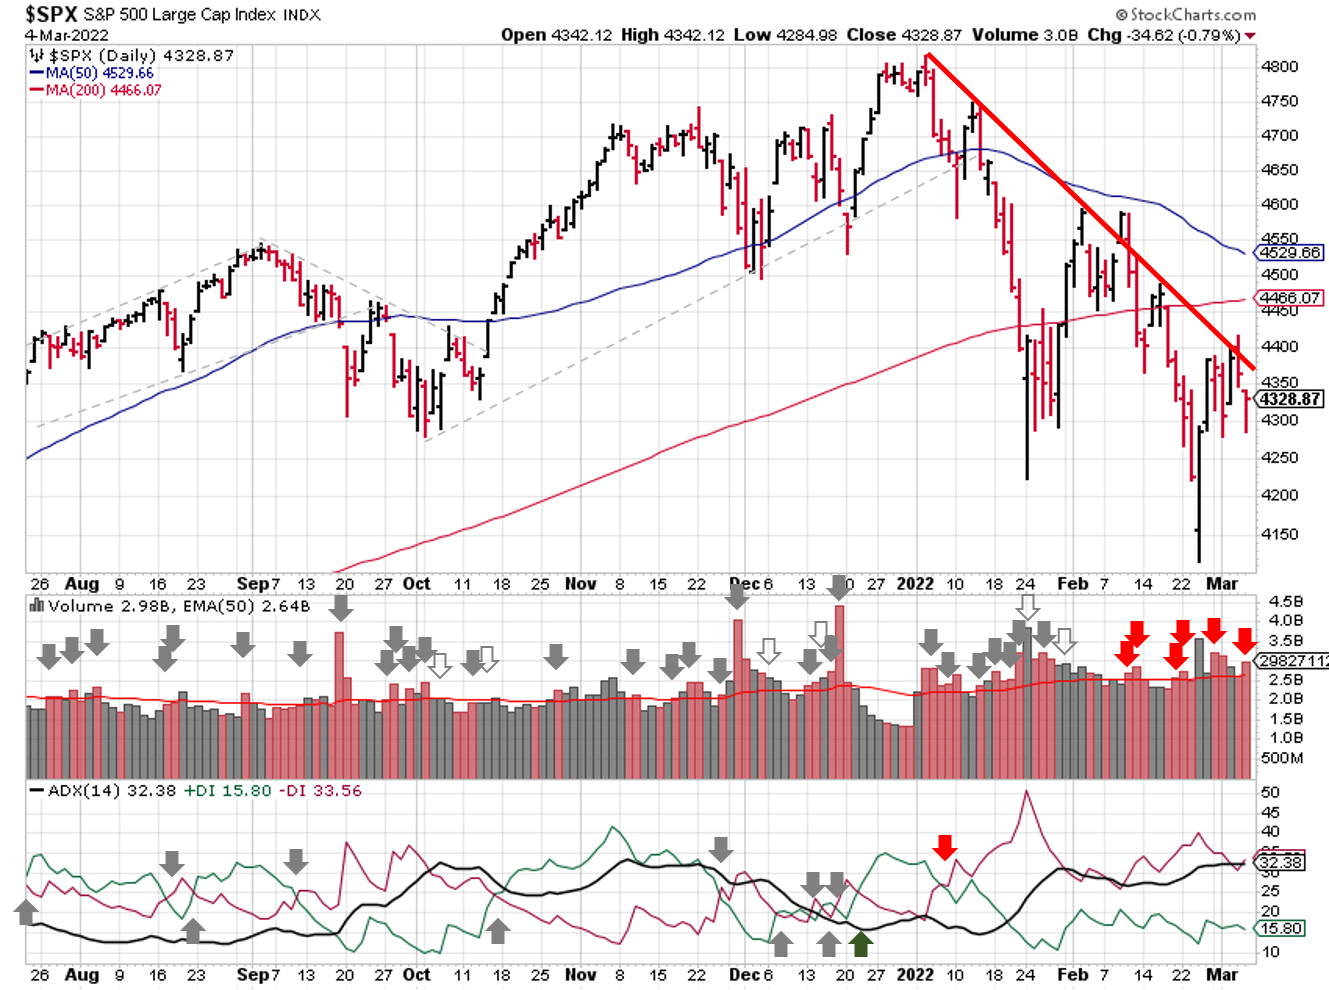
2022-03-06-SPX Trendline Analysis - Daily
The ADX signal is still in a downtrend with a strong bearish trend. Price and volume continues to show a downtrend as well, with the SPX below the 50-day moving average, several distributions days, and limited signs of accumulation from institutions.
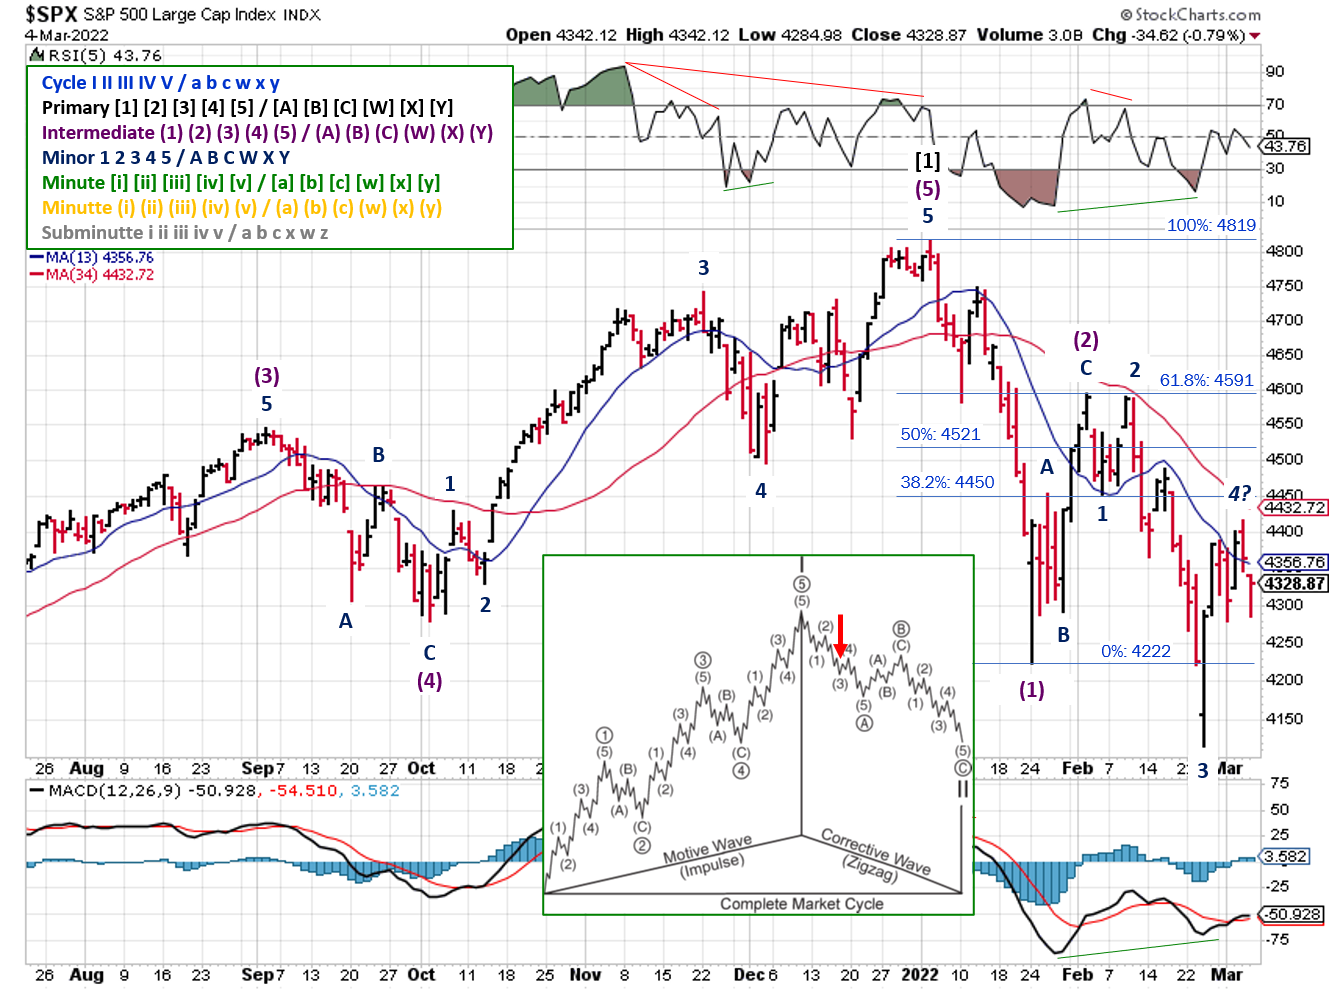
2022-03-06- SPX Elliott Wave Analysis - Daily - Primary 2
Elliott Wave continues to show a downtrend. The Minor 4 wave may have ended Thursday. That count would be invalidated if the SPX rallies above the Minor 1 low at 4451.5. Positive divergences developed in the RSI and MACD; the first “green shoots” we’ve seen this spring. As mentioned last week, the current bearish count are invalidated if the SPX rises above 4450.
COMMENTARY
Russia intensified its attack on Ukraine last week. Since we live in a connected society, instability in one region affects us all more acutely than in years past. Most of the world is concerned about the humanitarian impact the conflict, and looking for ways to help. I've read stories about using AirBnB to rent rooms and homes in Eastern Europe as a way to get quickly get money directly to people in need.
On the economic front, the immediate reaction to the war is the mooning of energy and commodity prices. Oil jumped 25%, copper rose ~10%, the Energy Select Sector SPDR Fund (XLE) was up 9.2%.

A different type of inflation than we've seen recently, but inflation nonetheless. Utilities (XLU) also benefit, but otherwise there's a LOT of red out there.
The U.S. jobs report showed 678,ooo jobs were added to the rolls in February; consensus estimates were looking for 390,000. That's a pretty big beat, and brought the unemployment rate down to 3.8%. U.S. Fed Chairman testified also last week, and did about as much as humanly possible to announce a 0.25% rate hike without announcing it.
At this point, the March 15-16 rate hike announcement is probably a non-event. But all signs point to the Fed increasing interest rates into an economic slowdown, which would create even more headwinds for markets to overcome.
Investing during the early 2020s has required a different mindset than investing in the 2010s. It's not clear when sanctions will be lifted; they could get worse before they get better. We're still dealing with supply chain issues from the pandemic that started 2 years ago, so it's quite possible that we're still dealing with the ripple effects of the war long after the shooting stops.
The only thing that is certain is that our path forward is uncertain. Uncertainty breeds volatility, and volatility is not something we had a lot of in the past decade. You'll need to revisit your position sizing rules, in terms of how much you're willing to lose before exiting a trade. You may need to lower your position size to feel comfortably weathering larger swings.
Best To Your Week!
If you find this research helpful, please tell a friend. If you don't find it helpful, tell an enemy.
I regularly share articles and other news of interest via on Twitter (@investsafely), Facebook, Linkedin, and Instagram (@investsafely)

How to Make Money in Stocks: A Winning System in Good Times and Bad.
It's one of my favorites.
Invest Safely, LLC is an independent investment research and online financial media company. Use of Invest Safely, LLC and any other products available through invest-safely.com are subject to our Terms of Service and Privacy Policy. Not a recommendation to buy or sell any security.
Charts provided courtesy of stockcharts.com.
For historical Elliott Wave Analysis, go to ELLIOTT WAVE lives on by Tony Caldaro. Other interpretations can be found at: Pretzel Logic, and 12345ABCDEWXYZ
Once a year, I review the market outlook signals as if they were a mechanical trading system, while pointing out issues and making adjustments. The goal is to give you to give you an example of how to analyze and continuously improve your own systems.
- 2015 Performance - Stock Market Outlook
- 2016 Performance - Stock Market Outlook
- 2017 Performance - Stock Market Outlook
- 2018 Performance - Stock Market Outlook
- 2019 Performance - Stock Market Outlook
- 2020 Performance - Stock Market Outlook
IMPORTANT DISCLOSURE INFORMATION
This material is for general communication and is provided for informational and/or educational purposes only. None of the content should be viewed as a suggestion that you take or refrain from taking any action nor as a recommendation for any specific investment product, strategy, or other such purpose. Certain information contained herein has been obtained from third-party sources believed to be reliable, but we cannot guarantee its accuracy or completeness.
To the extent that a reader has any questions regarding the applicability of any specific issue discussed above to his/her individual situation, he/she is encouraged to consult with the professional advisors of his/her choosing. Invest Safely, LLC is not a law firm, certified public accounting firm, or registered investment advisor and no portion of its content should be construed as legal, accounting, or investment advice.
The material is not to be construed as an offer or a recommendation to buy or sell a security nor is it to be construed as investment advice. Additionally, the material accessible through this website does not constitute a representation that the investments described herein are suitable or appropriate for any person.
Hypothetical Presentations:
Any referenced performance is “as calculated” using the referenced funds and has not been independently verified. This presentation does not discuss, directly or indirectly, the amount of the profits or losses, realized or unrealized, by any reader or contributor, from any specific funds or securities.
The author and/or any reader may have experienced materially different performance based upon various factors during the corresponding time periods. To the extent that any portion of the content reflects hypothetical results that were achieved by means of the retroactive application of a back-tested model, such results have inherent limitations, including:
Model results do not reflect the results of actual trading using assets, but were achieved by means of the retroactive application of the referenced models, certain aspects of which may have been designed with the benefit of hindsight
Back-tested performance may not reflect the impact that any material market or economic factors might have had on the use of a trading model if the model had been used during the period to actually manage assets
Actual investment results during the corresponding time periods may have been materially different from those portrayed in the model
Past performance may not be indicative of future results. Therefore, no one should assume that future performance will be profitable, or equal to any corresponding historical index.
The S&P 500 Composite Total Return Index (the "S&P") is a market capitalization-weighted index of 500 widely held stocks often used as a proxy for the stock market. Standard & Poor's chooses the member companies for the S&P based on market size, liquidity, and industry group representation. Included are the common stocks of industrial, financial, utility, and transportation companies. The S&P is not an index into which an investor can directly invest. The historical S&P performance results (and those of all other indices) are provided exclusively for comparison purposes only, so as to provide general comparative information to assist an individual in determining whether the performance of a specific portfolio or model meets, or continues to meet investment objective(s). The model and indices performance results do not reflect the impact of taxes.
Investing involves risk (even the “safe” kind)! Past performance does not guarantee or indicate future results. Different types of investments involve varying degrees of underlying risk. Therefore, do not assume that future performance of any specific investment or investment strategy be suitable for your portfolio or individual situation, will be profitable, equal any historical performance level(s), or prove successful (including the investments and/or investment strategies describe on this site).
Investing Process Links
Stabilize- Organize your $$$
- Manage your $$$
Plan
- Why You Invest
- Ways to Invest
- Where to Invest
- What to Invest In
Execute
- When to Invest
- How Much to Invest
- Buying & Selling
Monitor
- Track The Market
- Track Your Returns
Reflect & Adjust
- Improve Your Returns
- Adjust your Holdings
Popular Pages
- Jim Cramer- Personal Incomes Statements
- Hyperinflation
- Calculating Beta
- SMART Financial Goals
Blogroll
- Advisor Perspectives- Dividend Growth Investor
- Elliott Wave Lives On
- On My Radar | CMG Wealth
- Sure Dividend
- The Big Picture
- The Fat Pitch
- Thoughts from the Frontline
- Trader Feed
Sponsored Links
Invest Safely provides valuable, time-saving info about personal finance, money management, and investing.


