Stock Market Outlook
For The Week Of January 30th = Downtrend
INDICATORS
-
ADX Directional Indicators: Downtrend
Price & Volume Action: Downtrend
Elliott Wave Analysis: Downtrend
The S&P500 ($SPX) actually gained just under 1% last week, closing near the top of it's trading range. The index spent the entire week below the 200-day moving average, but rallied Friday to close the day and the week at that level.
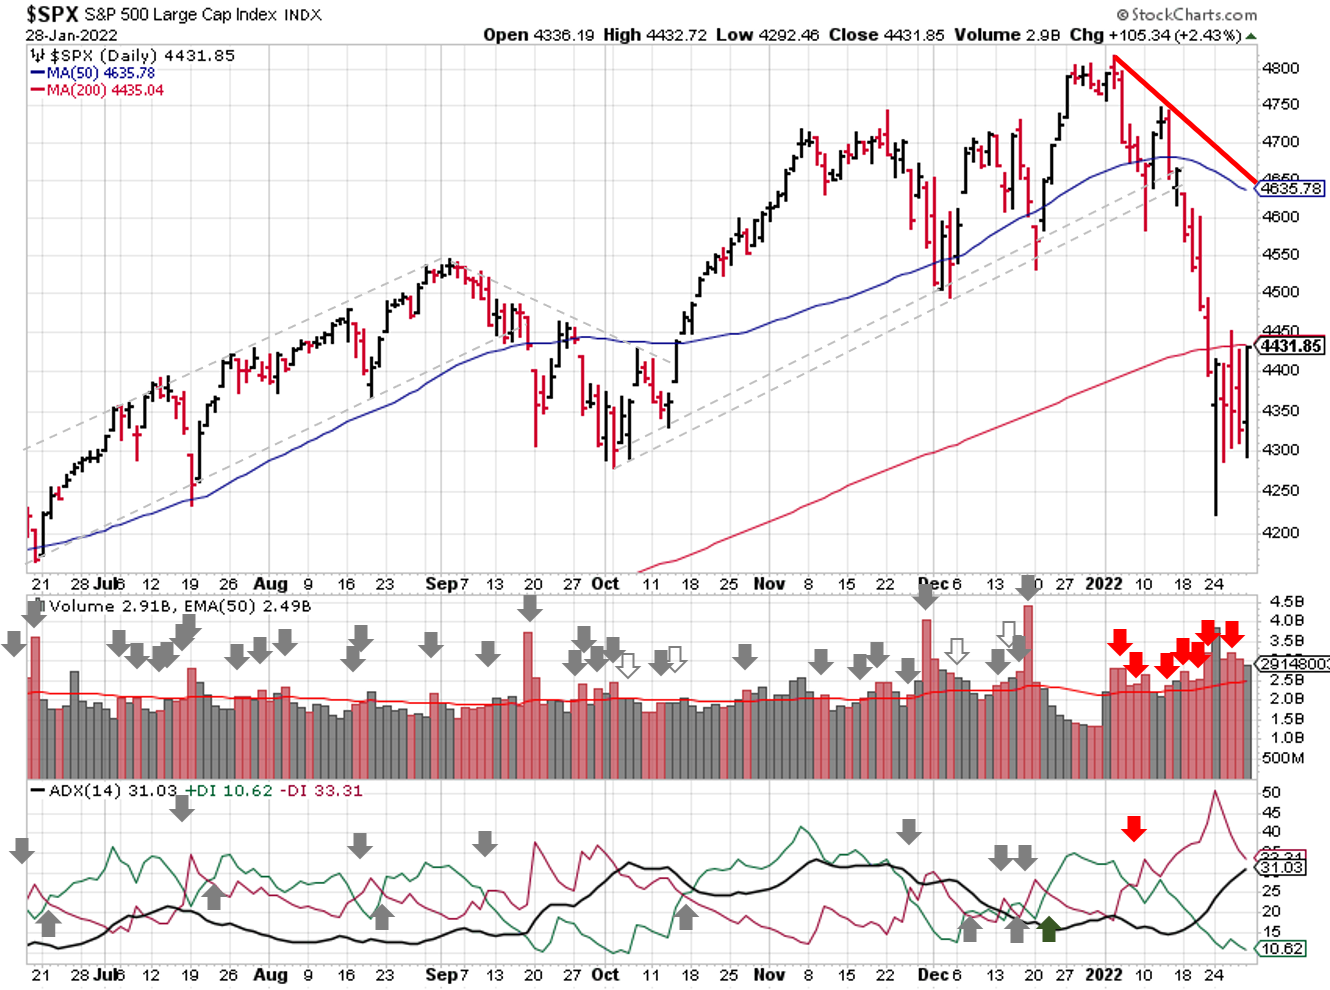
2022-01-30-SPX Trendline Analysis - Daily
The ADX and price/volume are both showing bearish price action.
For Elliott Wave, the remaining "uptrend" count bit the dust when price fell below 4279 Monday. That leaves the Primary [2], "crying Jordan" correction.
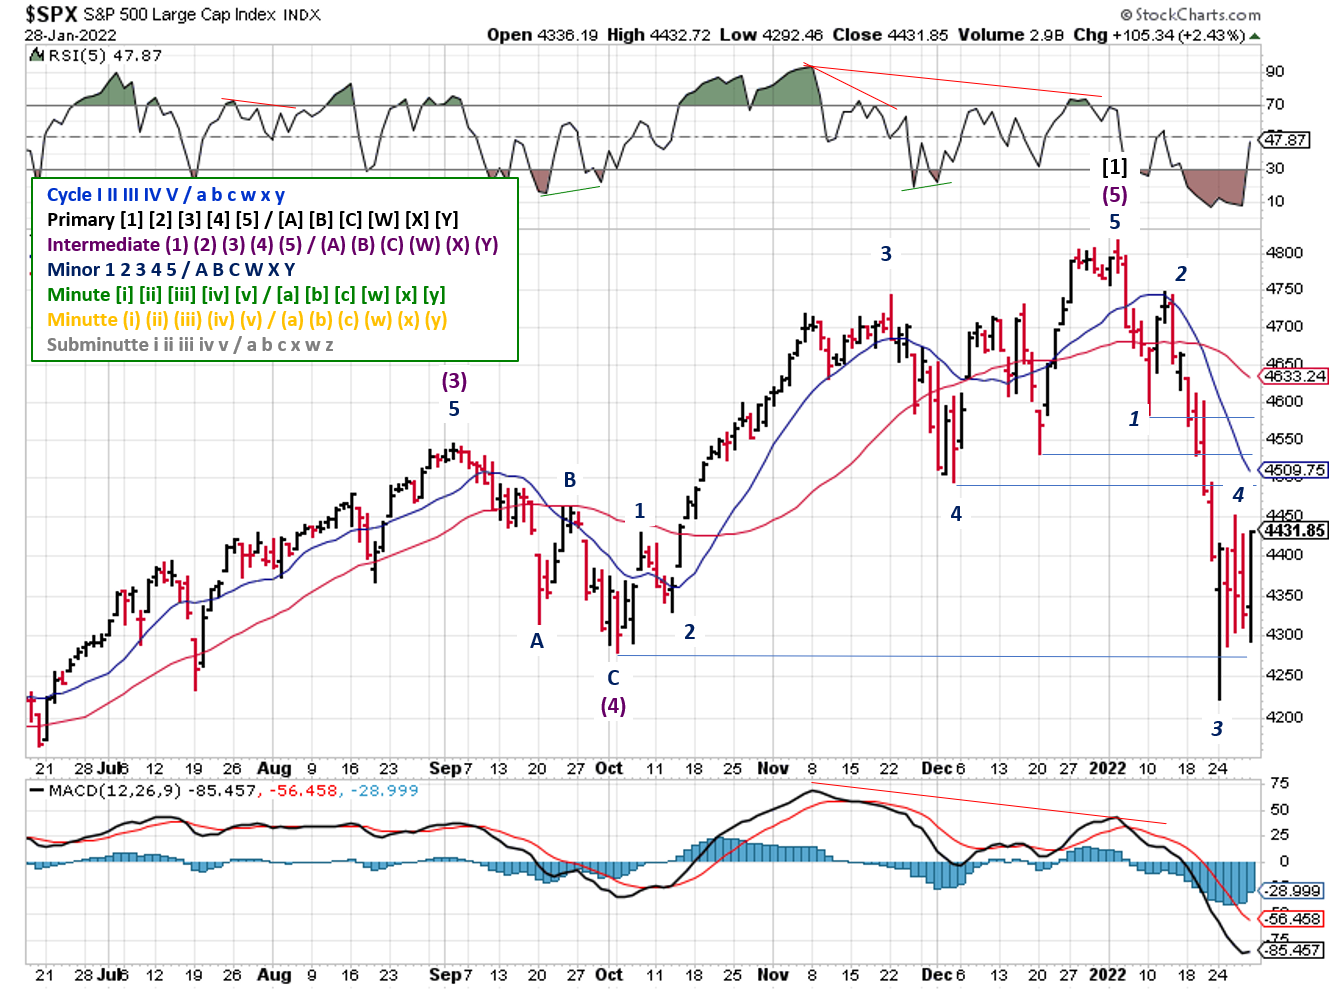
2022-01-30-SPX Elliott Wave Analysis - Daily - Primary 2
The current count is Minor Wave 5 of Intermediate (1) of Primary [2]. If it holds, I’d expect the price to fall below the Jan 24th low to complete Intermediate (1), and then rally back towards the Jan 3rd high, retracing 38% to 61% of the entire Intermediate (1) wave. Important to note that during down waves (2,4), the numbered waves (i.e. impulse waves) are to the downside and lettered waves (i.e. corrective waves) are the uptrends.
One thing to note about downtrends, thanks to the fractal nature of market moves, is time compression during periods of high volatility. When price moves rapidly, time compresses. So you’ll need to look at multiple timeframes (daily --> hourly or 15 minute) to see some of the waves more clearly on price charts (e.g. Minutte/Minute).
COMMENTARY
A wild week in the markets, with more on the way. Caution will be the word of the month in February, as investors and traders position themselves for March and beyond.
Barring something catastrophic, March will see Fed-sponsored stimulus end and the first interest rate hike in a LONG time. The Fed is doing it's best to give investors a lot of advanced warning. Based on the market response, they weren't exactly thrilled.
As we've discussed before, less liquidity means more volatility. Higher interest rates mean a lower value for future cashflows. The NASDAQs P/E ratio has already fallen from a high near 35 to something closer to 27 on the announcement alone.
There are A LOT of theories about how many hikes in 2022; some are projecting 5! The number of rate hikes will likely be determined by the overall size of rate hikes. Five 0.25% rate hikes probably won't happen...but it's a lot more probable than five 1% rate hikes. A 1% rate hike, by itself, is also unlikely.
We know interest rates will rise, so watch GDP. A combination of rising interest rates and falling GDP is a bearish environment for equities, and add to that the fact that earnings are likely to disappoint because the year over year comparisons now include last year's reopening trades.
Best To Your Week!
If you find this research helpful, please tell a friend. If you don't find it helpful, tell an enemy.
I regularly share articles and other news of interest via on Twitter (@investsafely), Facebook, Linkedin, and Instagram (@investsafely)

How to Make Money in Stocks: A Winning System in Good Times and Bad.
It's one of my favorites.
Invest Safely, LLC is an independent investment research and online financial media company. Use of Invest Safely, LLC and any other products available through invest-safely.com are subject to our Terms of Service and Privacy Policy. Not a recommendation to buy or sell any security.
Charts provided courtesy of stockcharts.com.
For historical Elliott Wave Analysis, go to ELLIOTT WAVE lives on by Tony Caldaro. Other interpretations can be found at: Pretzel Logic, and 12345ABCDEWXYZ
Once a year, I review the market outlook signals as if they were a mechanical trading system, while pointing out issues and making adjustments. The goal is to give you to give you an example of how to analyze and continuously improve your own systems.
- 2015 Performance - Stock Market Outlook
- 2016 Performance - Stock Market Outlook
- 2017 Performance - Stock Market Outlook
- 2018 Performance - Stock Market Outlook
- 2019 Performance - Stock Market Outlook
- 2020 Performance - Stock Market Outlook
IMPORTANT DISCLOSURE INFORMATION
This material is for general communication and is provided for informational and/or educational purposes only. None of the content should be viewed as a suggestion that you take or refrain from taking any action nor as a recommendation for any specific investment product, strategy, or other such purpose. Certain information contained herein has been obtained from third-party sources believed to be reliable, but we cannot guarantee its accuracy or completeness.
To the extent that a reader has any questions regarding the applicability of any specific issue discussed above to his/her individual situation, he/she is encouraged to consult with the professional advisors of his/her choosing. Invest Safely, LLC is not a law firm, certified public accounting firm, or registered investment advisor and no portion of its content should be construed as legal, accounting, or investment advice.
The material is not to be construed as an offer or a recommendation to buy or sell a security nor is it to be construed as investment advice. Additionally, the material accessible through this website does not constitute a representation that the investments described herein are suitable or appropriate for any person.
Hypothetical Presentations:
Any referenced performance is “as calculated” using the referenced funds and has not been independently verified. This presentation does not discuss, directly or indirectly, the amount of the profits or losses, realized or unrealized, by any reader or contributor, from any specific funds or securities.
The author and/or any reader may have experienced materially different performance based upon various factors during the corresponding time periods. To the extent that any portion of the content reflects hypothetical results that were achieved by means of the retroactive application of a back-tested model, such results have inherent limitations, including:
Model results do not reflect the results of actual trading using assets, but were achieved by means of the retroactive application of the referenced models, certain aspects of which may have been designed with the benefit of hindsight
Back-tested performance may not reflect the impact that any material market or economic factors might have had on the use of a trading model if the model had been used during the period to actually manage assets
Actual investment results during the corresponding time periods may have been materially different from those portrayed in the model
Past performance may not be indicative of future results. Therefore, no one should assume that future performance will be profitable, or equal to any corresponding historical index.
The S&P 500 Composite Total Return Index (the "S&P") is a market capitalization-weighted index of 500 widely held stocks often used as a proxy for the stock market. Standard & Poor's chooses the member companies for the S&P based on market size, liquidity, and industry group representation. Included are the common stocks of industrial, financial, utility, and transportation companies. The S&P is not an index into which an investor can directly invest. The historical S&P performance results (and those of all other indices) are provided exclusively for comparison purposes only, so as to provide general comparative information to assist an individual in determining whether the performance of a specific portfolio or model meets, or continues to meet investment objective(s). The model and indices performance results do not reflect the impact of taxes.
Investing involves risk (even the “safe” kind)! Past performance does not guarantee or indicate future results. Different types of investments involve varying degrees of underlying risk. Therefore, do not assume that future performance of any specific investment or investment strategy be suitable for your portfolio or individual situation, will be profitable, equal any historical performance level(s), or prove successful (including the investments and/or investment strategies describe on this site).
Investing Process Links
Stabilize- Organize your $$$
- Manage your $$$
Plan
- Why You Invest
- Ways to Invest
- Where to Invest
- What to Invest In
Execute
- When to Invest
- How Much to Invest
- Buying & Selling
Monitor
- Track The Market
- Track Your Returns
Reflect & Adjust
- Improve Your Returns
- Adjust your Holdings
Popular Pages
- Jim Cramer- Personal Incomes Statements
- Hyperinflation
- Calculating Beta
- SMART Financial Goals
Blogroll
- Advisor Perspectives- Dividend Growth Investor
- Elliott Wave Lives On
- On My Radar | CMG Wealth
- Sure Dividend
- The Big Picture
- The Fat Pitch
- Thoughts from the Frontline
- Trader Feed
Sponsored Links
Invest Safely provides valuable, time-saving info about personal finance, money management, and investing.


