Stock Market Outlook
For The Week Of January 16th = Uptrend
INDICATORS
-
ADX Directional Indicators: Downtrend
Price & Volume Action: Mixed
Elliott Wave Analysis: Uptrend
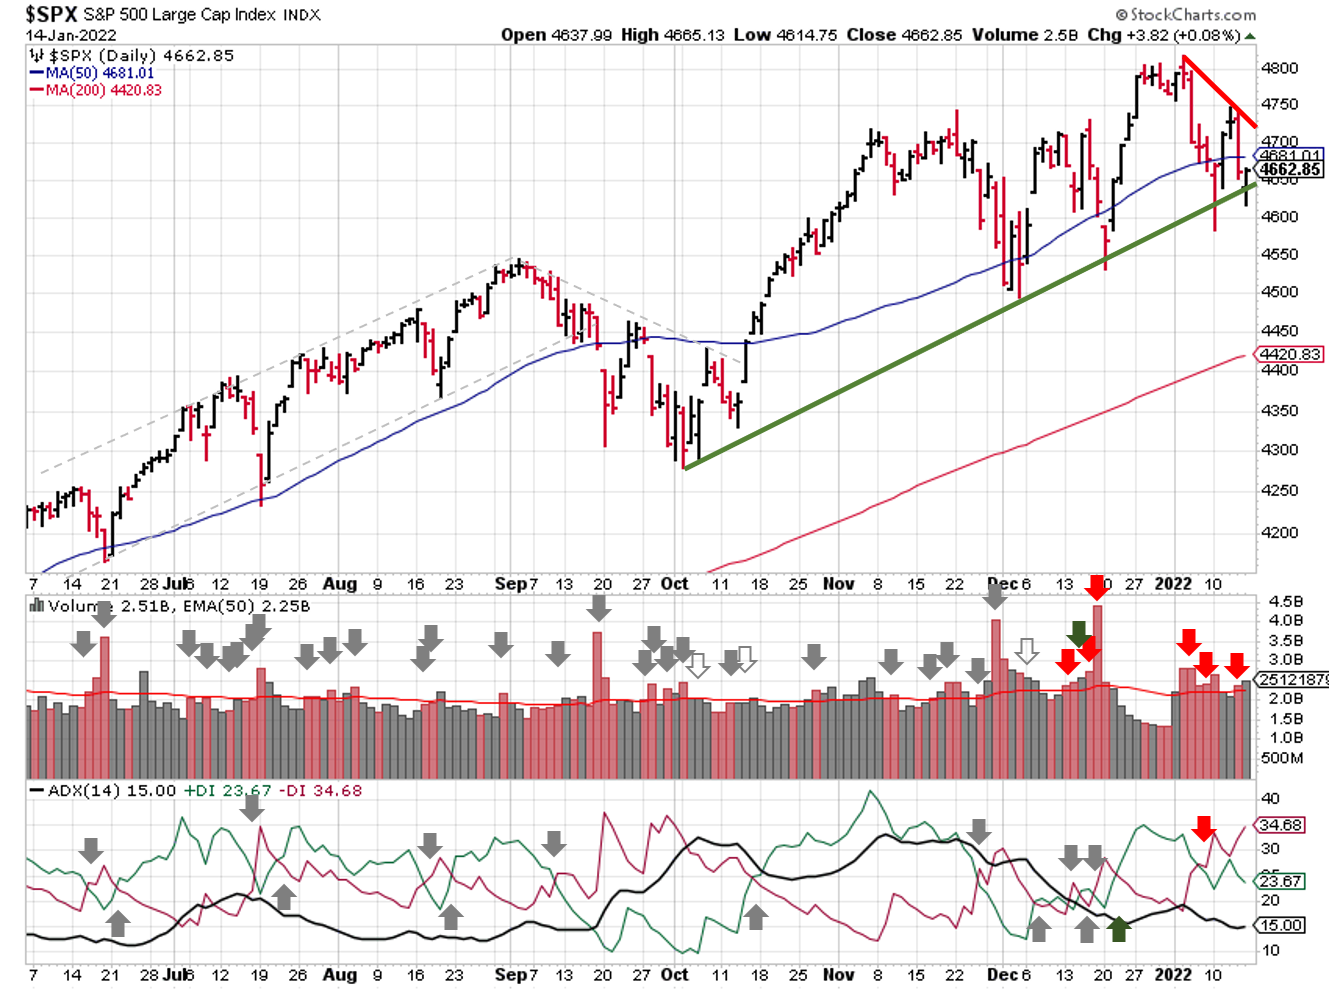
No all-time high's last week. Instead, the S&P500 ($SPX) struggled to clear its 50-day moving average. The index continues to create higher lows (bullish), so the trendline from the early October / early December lows remains in place, but it's taken a couple of shots this month. Last week's lower high is bearish, as is the bearish trendline it creates.
2022-01-16-SPX Trendline Analysis - Daily
The ADX directional indicators continue to show bearish price action coupled with a weak trend.
For price & volume, the signal is mixed. The SPX broke through the 50-day on higher volume, and failed to recover. But the distribution days remain subdued. Half of the current count is 5 weeks old and will drop out during the coming week.
2022-01-16-SPX Elliott Wave Analysis - Daily - Primary 1
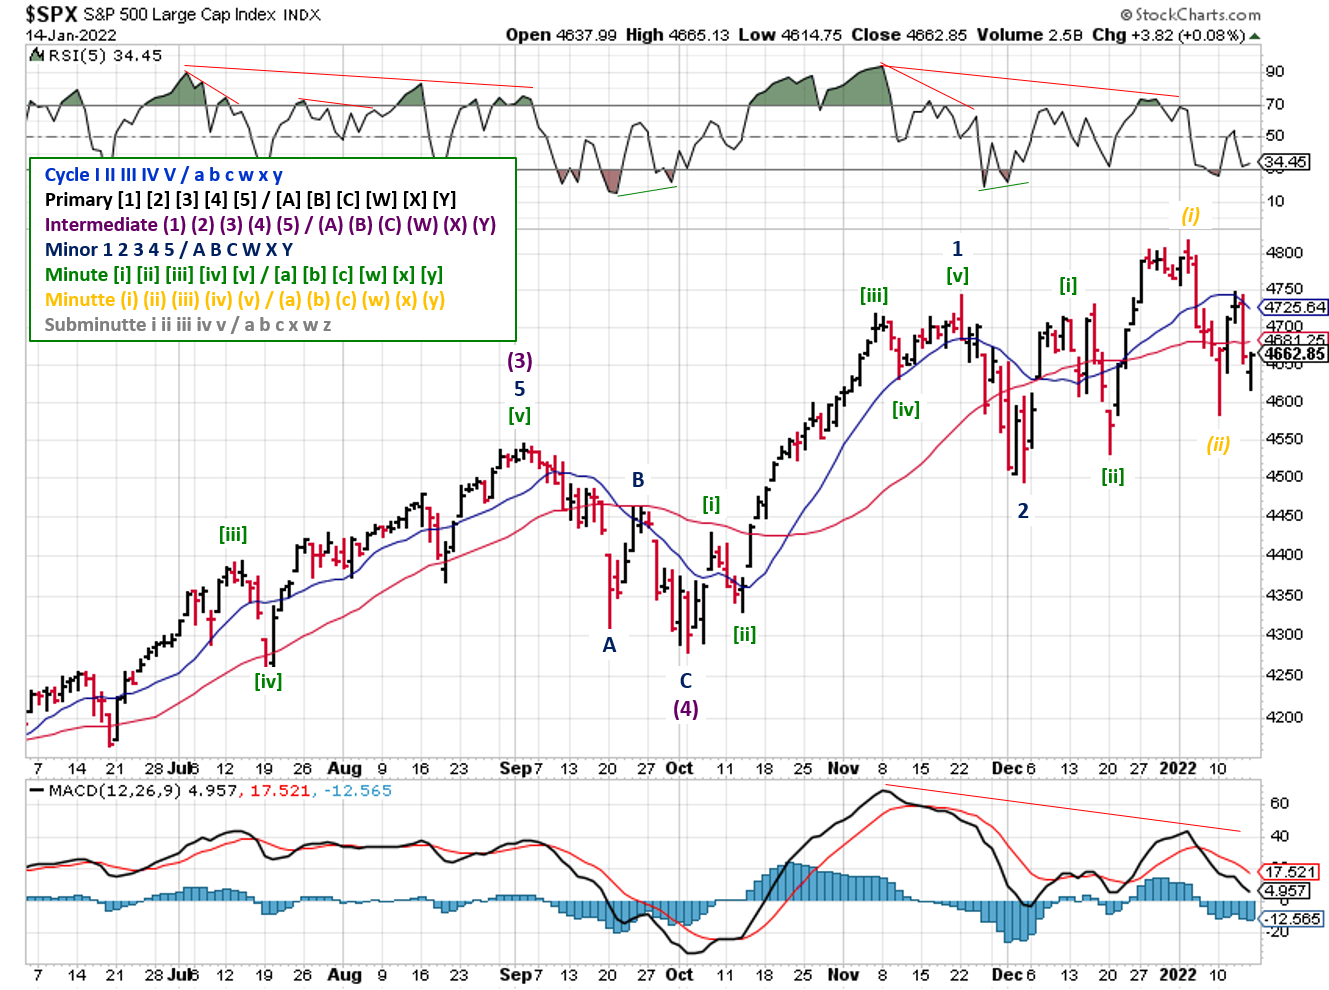
The Elliott Wave count remains unchanged from last week, but there's a lot of room for alternate counts at the moment.
COMMENTARY
I received a few emails this week regarding the signals, so I thought I’d provide some answers in this week’s commentary.
Several related to the trendlines; how to draw them and why they’re still green after prices go below the line. For how to draw them, I've heard a lot arguments about the "right" way. Some people use the highs/lows, some use the opening/closing price, and some use “clusters” of both opens/closes and highs/lows and aim for the middle.
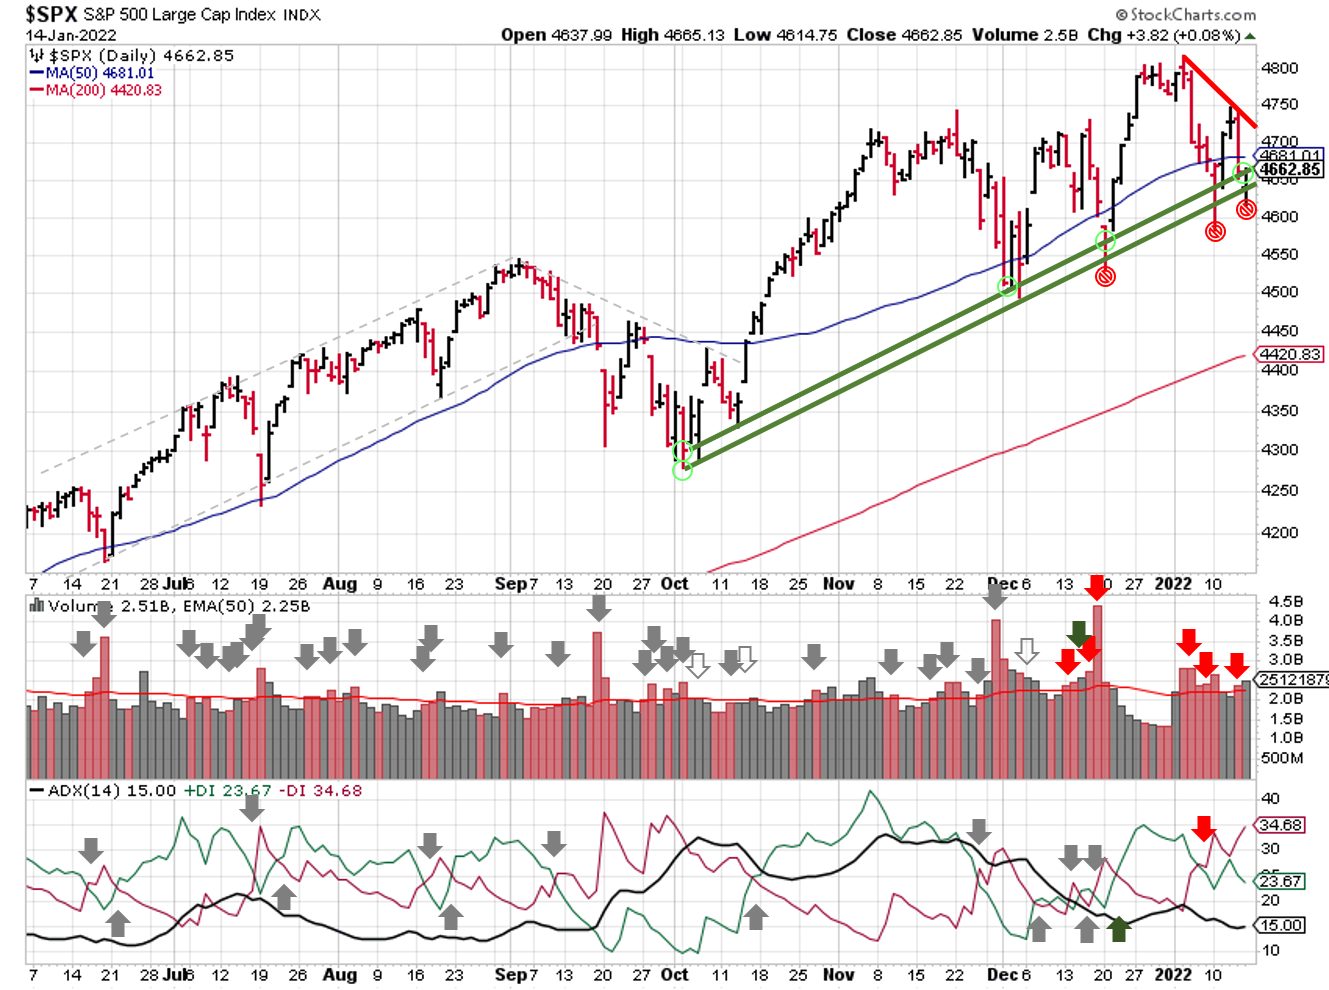
SPX Price & Volume Chart for the Week of January 16 2022[
For example, in the chart above there are two bullish trendlines:
- Off the closes/opens - October 4th close to December 2nd close (4300 to 4513)
- Off the lows - October 4th to December 3rd (4279 to 4495)
Both show support and lack of support, but the SPX continues to moving higher.
Like all things investing, the problem lies in the exceptions, not the rules. At best, trendlines are general guides, sort of like trail maps. They give you a sense of where you’re headed, but don’t tell you every hill, valley, stream or rock you’ll encounter on along the way. Use them as a quick visual aid to confirm or contradict your analysis, and don't worry too much about the method. Just pick one and consistently apply it. As you develop your edge, you'll find the method that works for you, or maybe even decide they aren't for you at all!
Another set of questions related to Elliott Wave counts and associated price targets. I don't use Elliott Wave to predict price targets, because we can't predict...only prepare. And Elliott Wave counts get violated and readjusted all the time!
That said, Elliott Wave helps visualize major market moves (i.e. 3rd waves), and combined with the two other signals, increases the probability that I'll catch those major moves in either direction.
Right now, several different counts offer different interpretations of the "current state" of the markets. Based on those starting points, each represents possible market price movements, ranging from bullish to bearish.
2022-01-16-SPX Elliott Wave Analysis - Primary 1 - Minutte iii
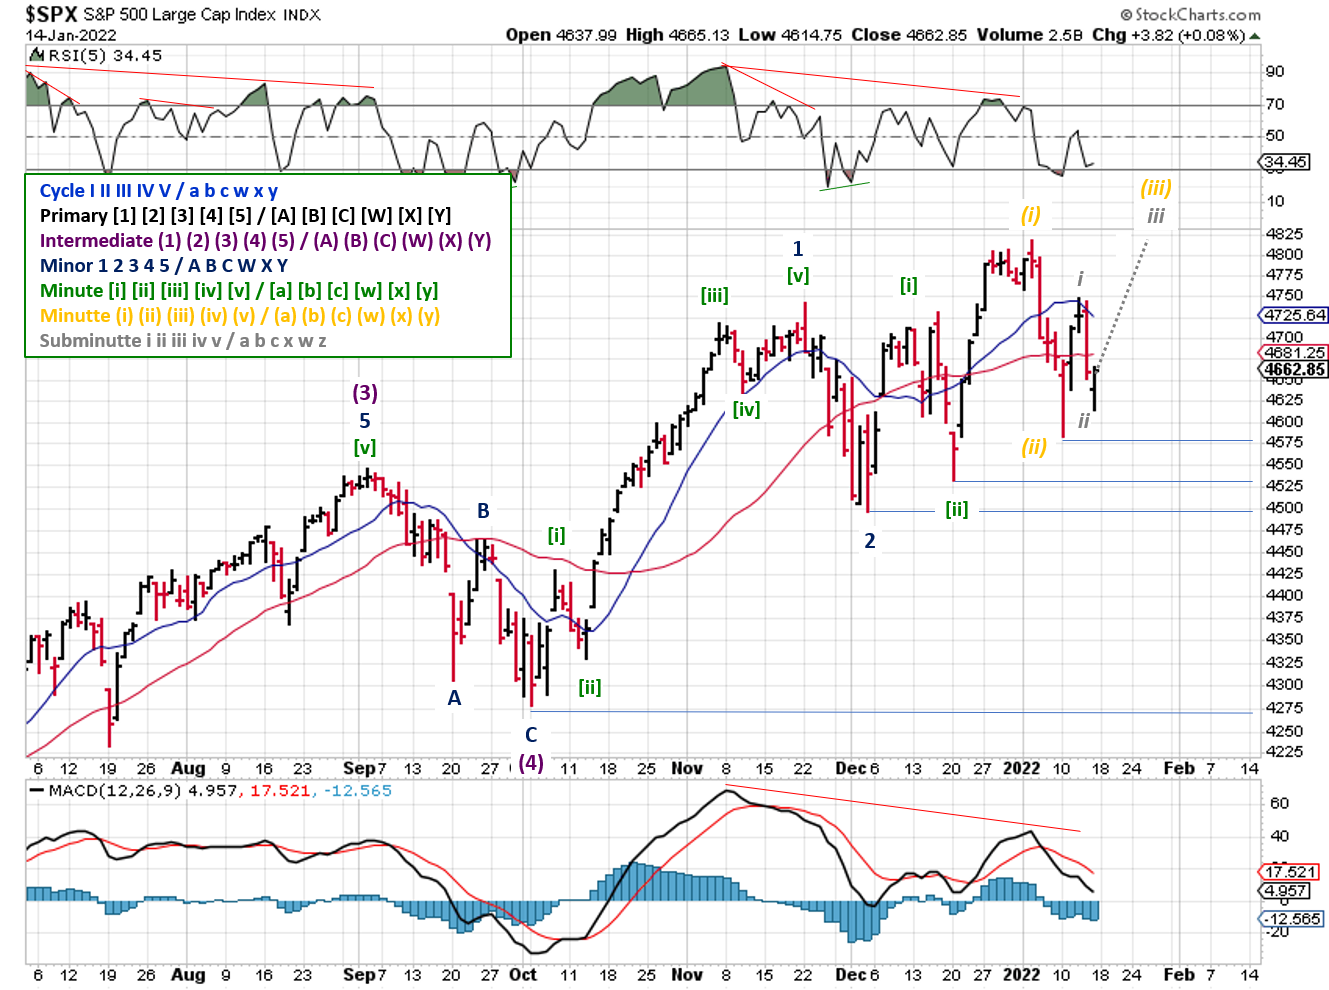
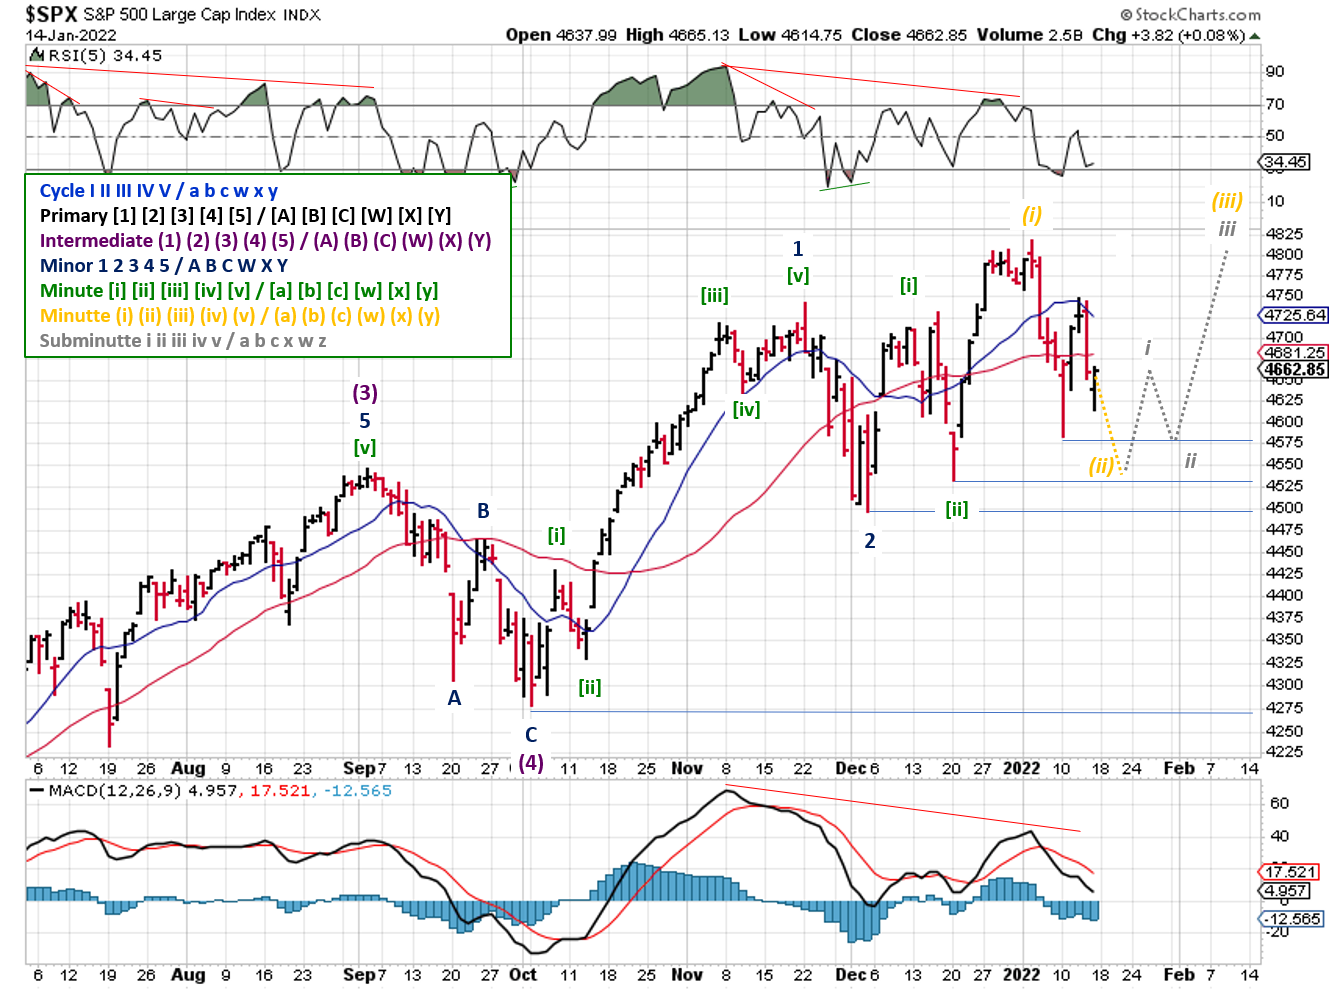
The current count (Bullish / Uptrend) shows the current wave is subdividing, with the SPX hitting a low ( subminutte ii ) on Friday. This suggests the market will rally higher this week ( Minutte (iii) ), but at a minimum staying above the January 10th low of 4582
2022-01-16-SPX Elliott Wave Analysis - Primary 1 - Minutte ii
Another bullish interpretation shows the ( Minutte (ii) ) wave continuing, and the SPX correcting through the January 10th low, but staying above the December 20th low of 4531 and THEN rising higher.
2022-01-16-SPX Elliott Wave Analysis - Primary 1 - Minute c
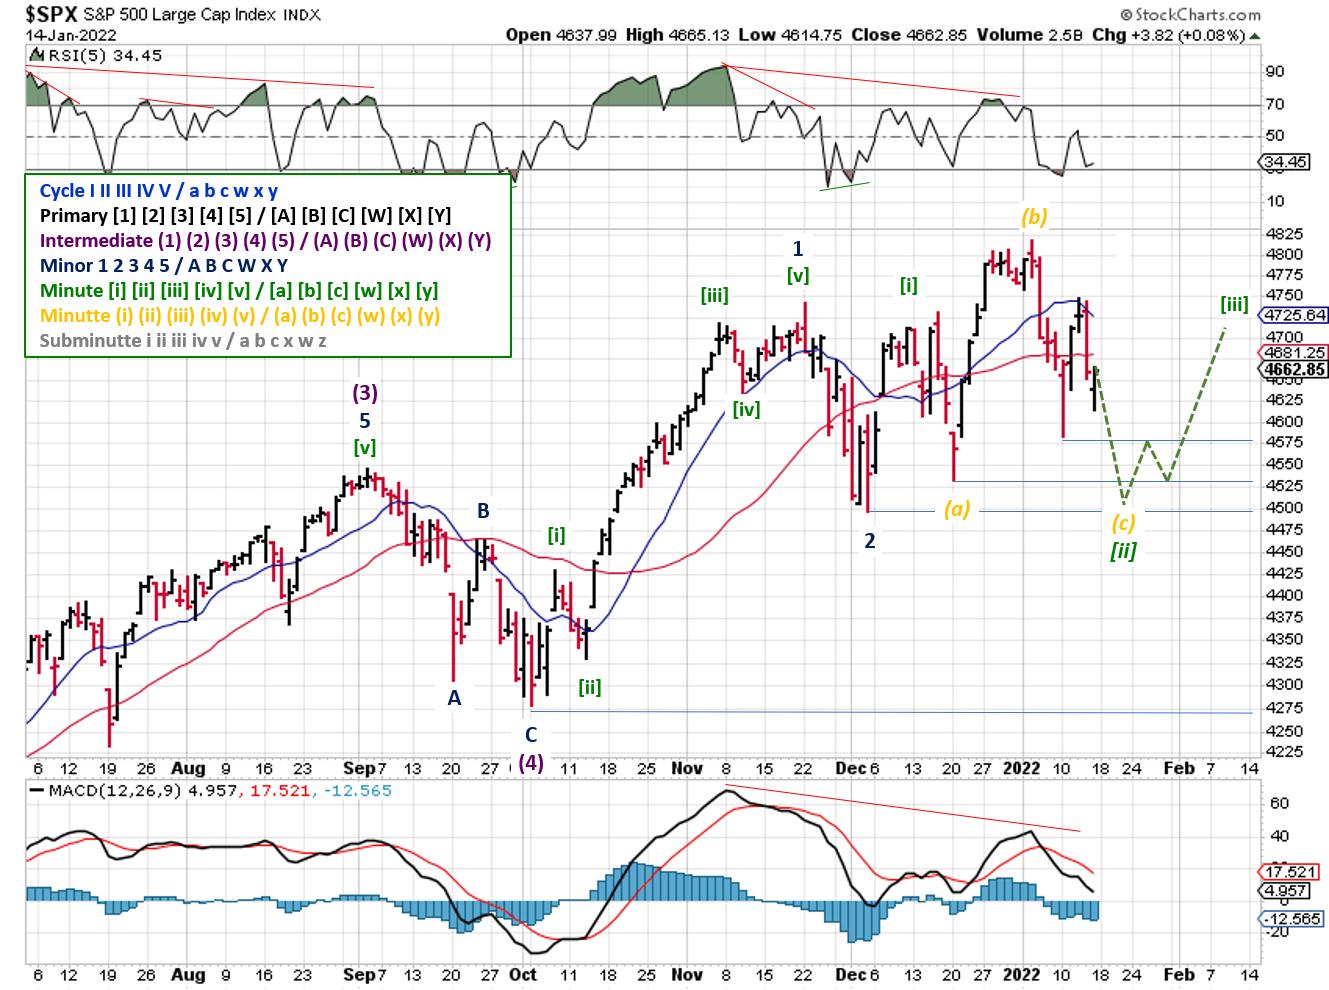
A 3rd count shows the uptrend in place, but it isn't as bullish for this month. Here, the Minute [ii] wave correction didn't end at the December 20th low. Instead, that was just the first leg down ( Minutte (a) ), with the SPX then seeing a counter-trend rally into year end ( Minutte (b) ). Now, the SPX continues lower ( Minutte (c) ), falling past the December 20th low, but staying above the December 3rd low of 4495 to complete Minute [ii], and THEN rallies.
2022-01-16-SPX Elliott Wave Analysis - Primary 1 - Minor2
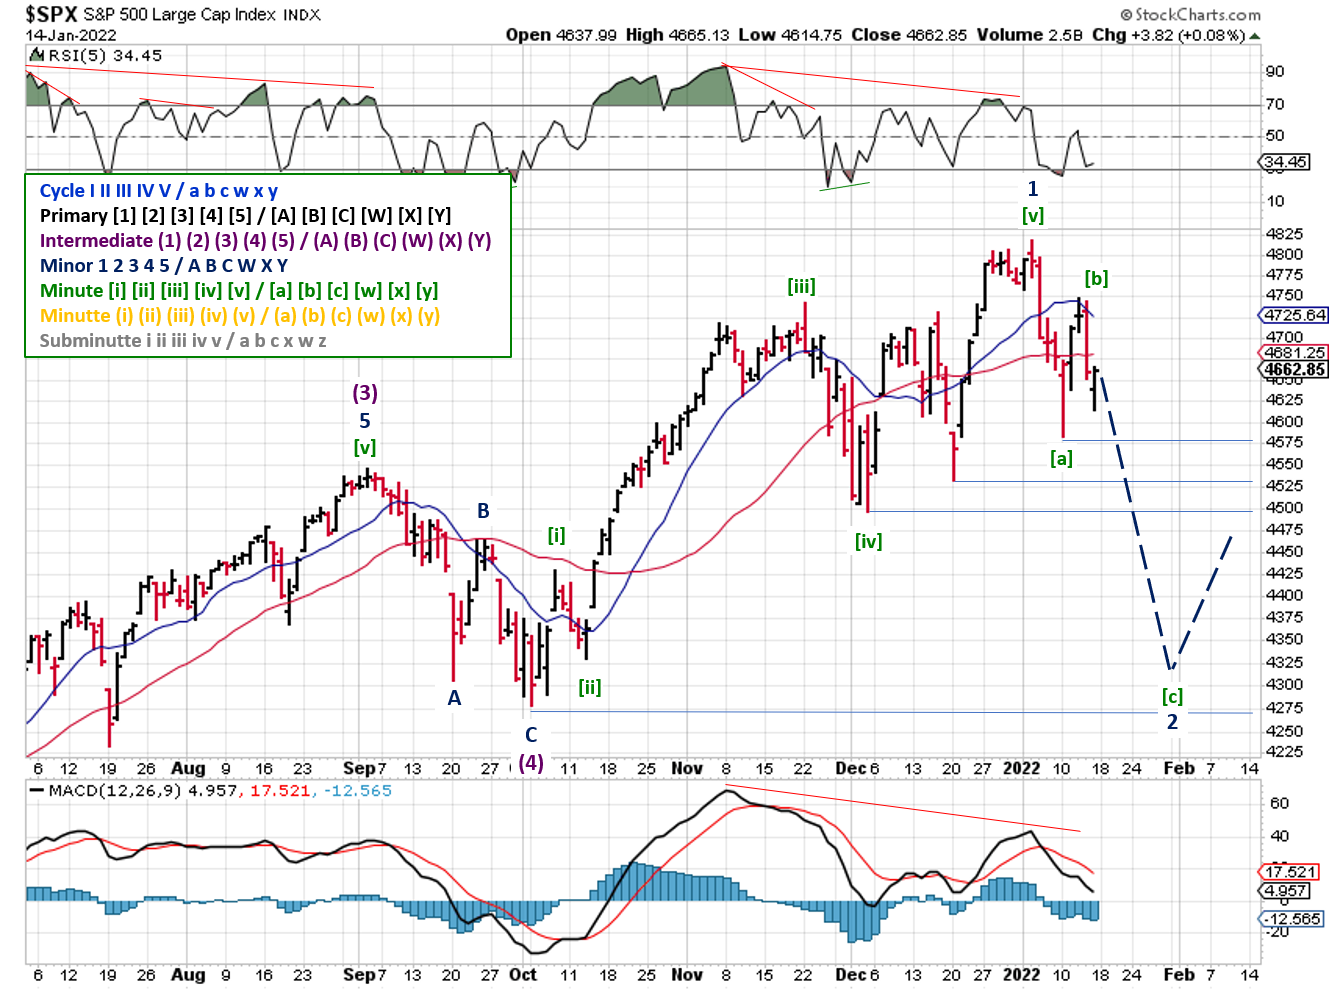
The 4th potential count is decidedly more bearish near-term (remainder of January), but still bullish longer-term (Q1). In this case, the December 3rd low was part of the Minor 1 uptrend (vs the completion of Minor 2 shown in the charts above). The January 10th low was actually the first leg ( Minute [a] ) of the Minor 2 correction. In this case, the SPX has a lot more downside, but still stays above the October 4th low of 4279.
2022-01-16-SPX Elliott Wave Analysis - Primary 2
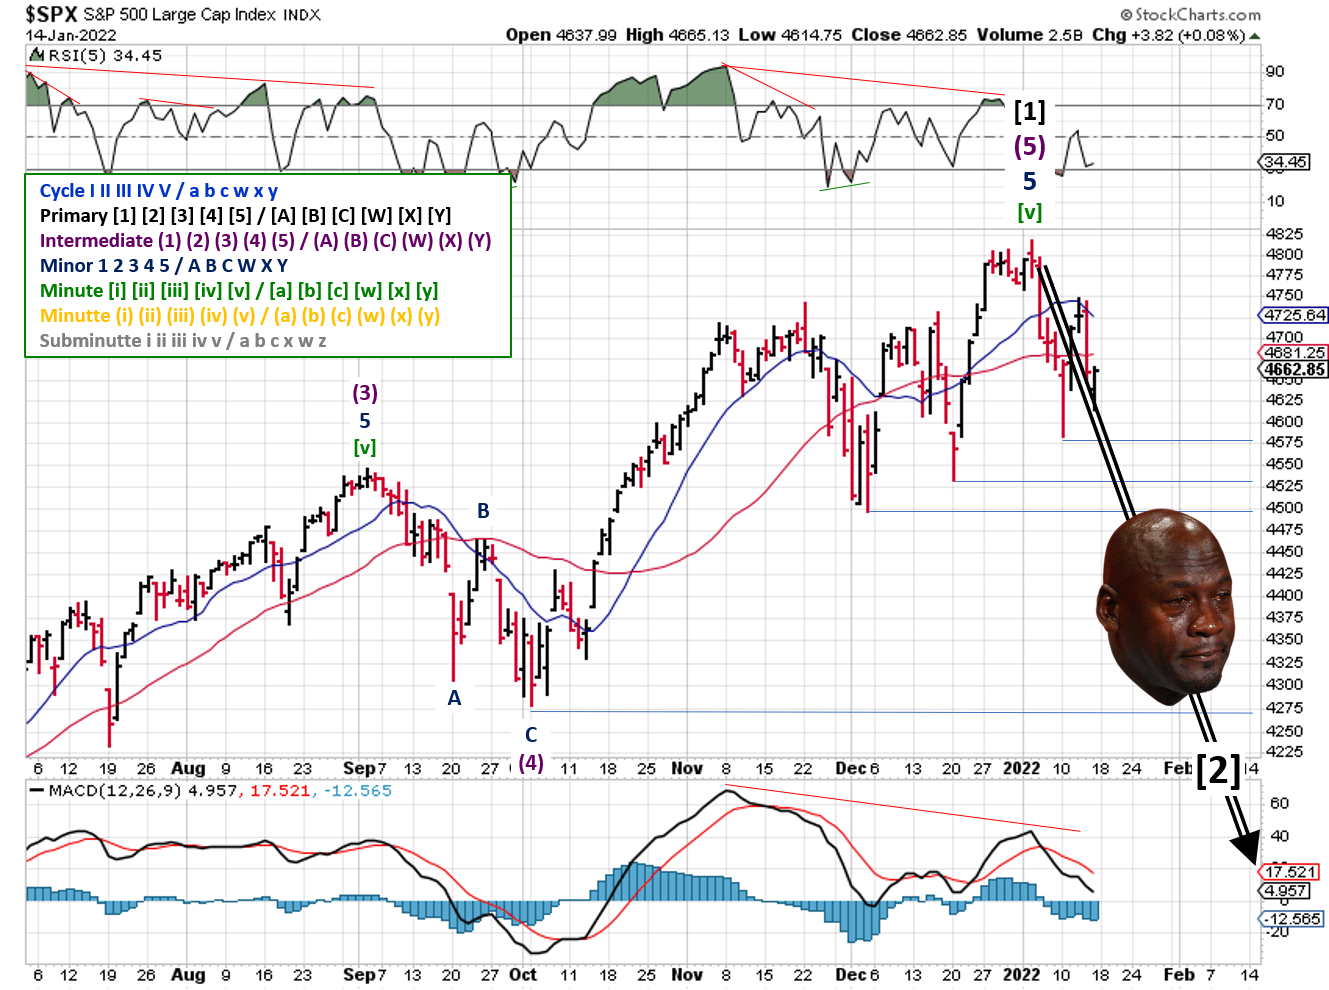
And finally, the 5th potential count is the most bearish possibility, for both January and beyond. Here, the prior counts were incorrect and the entire Primary [1] wave actually ended at the January 4th high. That puts the SPX in Primary [2], which could retrace 50% to 61.8% of Primary [1] (3505 to 3195 respectively).
Whether it's Elliott Wave, trendlines, or any other technical analysis, there are always multiple settings and timeframes that lead to different interpretations. For example, if you just relied on Elliott Wave, you could be bullish until the SPX fell below 4279 (~8% from Friday's close).
If the market sells-off from here and approaches the December 3rd low, I'd expect distribution days to pile up and flip the price/volume signal to a downtrend. In turn, this would shift the overall stock market outlook to a downtrend, in spite of a longer term bullish view from Elliott Wave. Not a prediction or a call, just a look at how a 3-signal system works.
There's no one signal that will be correct 100% of the time. It's why these weekly stock market outlook posts were set-up with three signals. In additional to backtesting whatever signals you use, the "majority rules" approach helps avoid a mistake in signal cause you to misread market conditions.
Best To Your Week!
If you find this research helpful, please tell a friend. If you don't find it helpful, tell an enemy.
I regularly share articles and other news of interest via on Twitter (@investsafely), Facebook, Linkedin, and Instagram (@investsafely)

How to Make Money in Stocks: A Winning System in Good Times and Bad.
It's one of my favorites.
Invest Safely, LLC is an independent investment research and online financial media company. Use of Invest Safely, LLC and any other products available through invest-safely.com are subject to our Terms of Service and Privacy Policy. Not a recommendation to buy or sell any security.
Charts provided courtesy of stockcharts.com.
For historical Elliott Wave Analysis, go to ELLIOTT WAVE lives on by Tony Caldaro. Other interpretations can be found at: Pretzel Logic, and 12345ABCDEWXYZ
Once a year, I review the market outlook signals as if they were a mechanical trading system, while pointing out issues and making adjustments. The goal is to give you to give you an example of how to analyze and continuously improve your own systems.
- 2015 Performance - Stock Market Outlook
- 2016 Performance - Stock Market Outlook
- 2017 Performance - Stock Market Outlook
- 2018 Performance - Stock Market Outlook
- 2019 Performance - Stock Market Outlook
- 2020 Performance - Stock Market Outlook
IMPORTANT DISCLOSURE INFORMATION
This material is for general communication and is provided for informational and/or educational purposes only. None of the content should be viewed as a suggestion that you take or refrain from taking any action nor as a recommendation for any specific investment product, strategy, or other such purpose. Certain information contained herein has been obtained from third-party sources believed to be reliable, but we cannot guarantee its accuracy or completeness.
To the extent that a reader has any questions regarding the applicability of any specific issue discussed above to his/her individual situation, he/she is encouraged to consult with the professional advisors of his/her choosing. Invest Safely, LLC is not a law firm, certified public accounting firm, or registered investment advisor and no portion of its content should be construed as legal, accounting, or investment advice.
The material is not to be construed as an offer or a recommendation to buy or sell a security nor is it to be construed as investment advice. Additionally, the material accessible through this website does not constitute a representation that the investments described herein are suitable or appropriate for any person.
Hypothetical Presentations:
Any referenced performance is “as calculated” using the referenced funds and has not been independently verified. This presentation does not discuss, directly or indirectly, the amount of the profits or losses, realized or unrealized, by any reader or contributor, from any specific funds or securities.
The author and/or any reader may have experienced materially different performance based upon various factors during the corresponding time periods. To the extent that any portion of the content reflects hypothetical results that were achieved by means of the retroactive application of a back-tested model, such results have inherent limitations, including:
Model results do not reflect the results of actual trading using assets, but were achieved by means of the retroactive application of the referenced models, certain aspects of which may have been designed with the benefit of hindsight
Back-tested performance may not reflect the impact that any material market or economic factors might have had on the use of a trading model if the model had been used during the period to actually manage assets
Actual investment results during the corresponding time periods may have been materially different from those portrayed in the model
Past performance may not be indicative of future results. Therefore, no one should assume that future performance will be profitable, or equal to any corresponding historical index.
The S&P 500 Composite Total Return Index (the "S&P") is a market capitalization-weighted index of 500 widely held stocks often used as a proxy for the stock market. Standard & Poor's chooses the member companies for the S&P based on market size, liquidity, and industry group representation. Included are the common stocks of industrial, financial, utility, and transportation companies. The S&P is not an index into which an investor can directly invest. The historical S&P performance results (and those of all other indices) are provided exclusively for comparison purposes only, so as to provide general comparative information to assist an individual in determining whether the performance of a specific portfolio or model meets, or continues to meet investment objective(s). The model and indices performance results do not reflect the impact of taxes.
Investing involves risk (even the “safe” kind)! Past performance does not guarantee or indicate future results. Different types of investments involve varying degrees of underlying risk. Therefore, do not assume that future performance of any specific investment or investment strategy be suitable for your portfolio or individual situation, will be profitable, equal any historical performance level(s), or prove successful (including the investments and/or investment strategies describe on this site).
Investing Process Links
Stabilize- Organize your $$$
- Manage your $$$
Plan
- Why You Invest
- Ways to Invest
- Where to Invest
- What to Invest In
Execute
- When to Invest
- How Much to Invest
- Buying & Selling
Monitor
- Track The Market
- Track Your Returns
Reflect & Adjust
- Improve Your Returns
- Adjust your Holdings
Popular Pages
- Jim Cramer- Personal Incomes Statements
- Hyperinflation
- Calculating Beta
- SMART Financial Goals
Blogroll
- Advisor Perspectives- Dividend Growth Investor
- Elliott Wave Lives On
- On My Radar | CMG Wealth
- Sure Dividend
- The Big Picture
- The Fat Pitch
- Thoughts from the Frontline
- Trader Feed
Sponsored Links
Invest Safely provides valuable, time-saving info about personal finance, money management, and investing.


