Stock Market Outlook
For The Week Of November 14th = Uptrend
INDICATORS
-
ADX Directional Indicators: Uptrend
Price & Volume Action: Uptrend
Elliott Wave Analysis: Uptrend
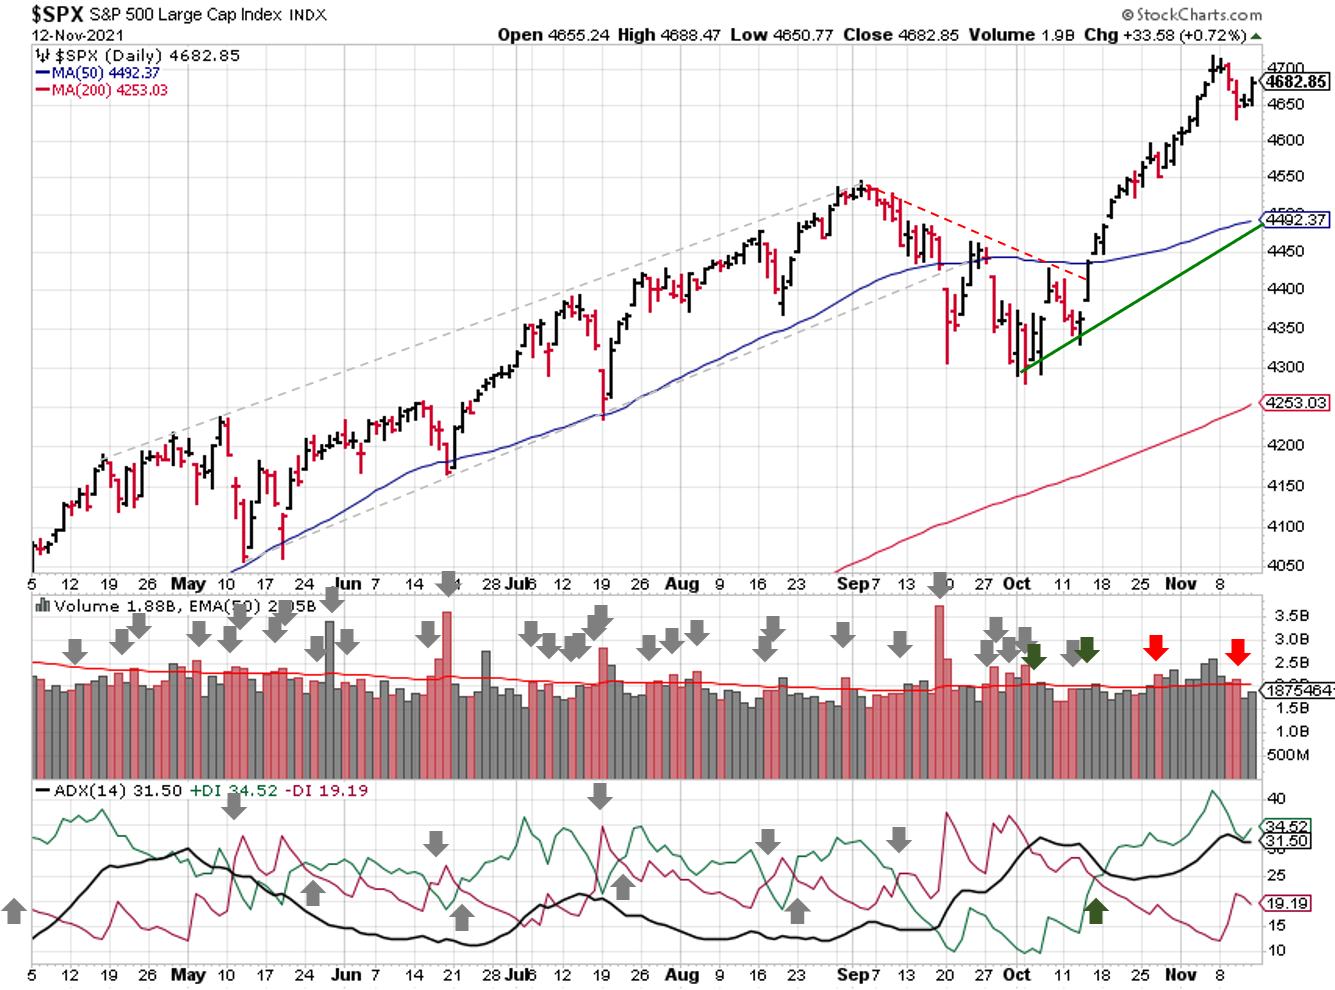
2021-11-14-SPX Trendline Analysis - Daily
The ADX continues to highlight bullish price action and trend, as does price/volume. Elliott Wave maintains an uptrend. The Nov 5 high could be the end of Wave [iii]...that said, the low last Wednesday could have been the end of Wave [iv] as well. Once the first minor wave completes, we’ll have a better idea of potential targets.
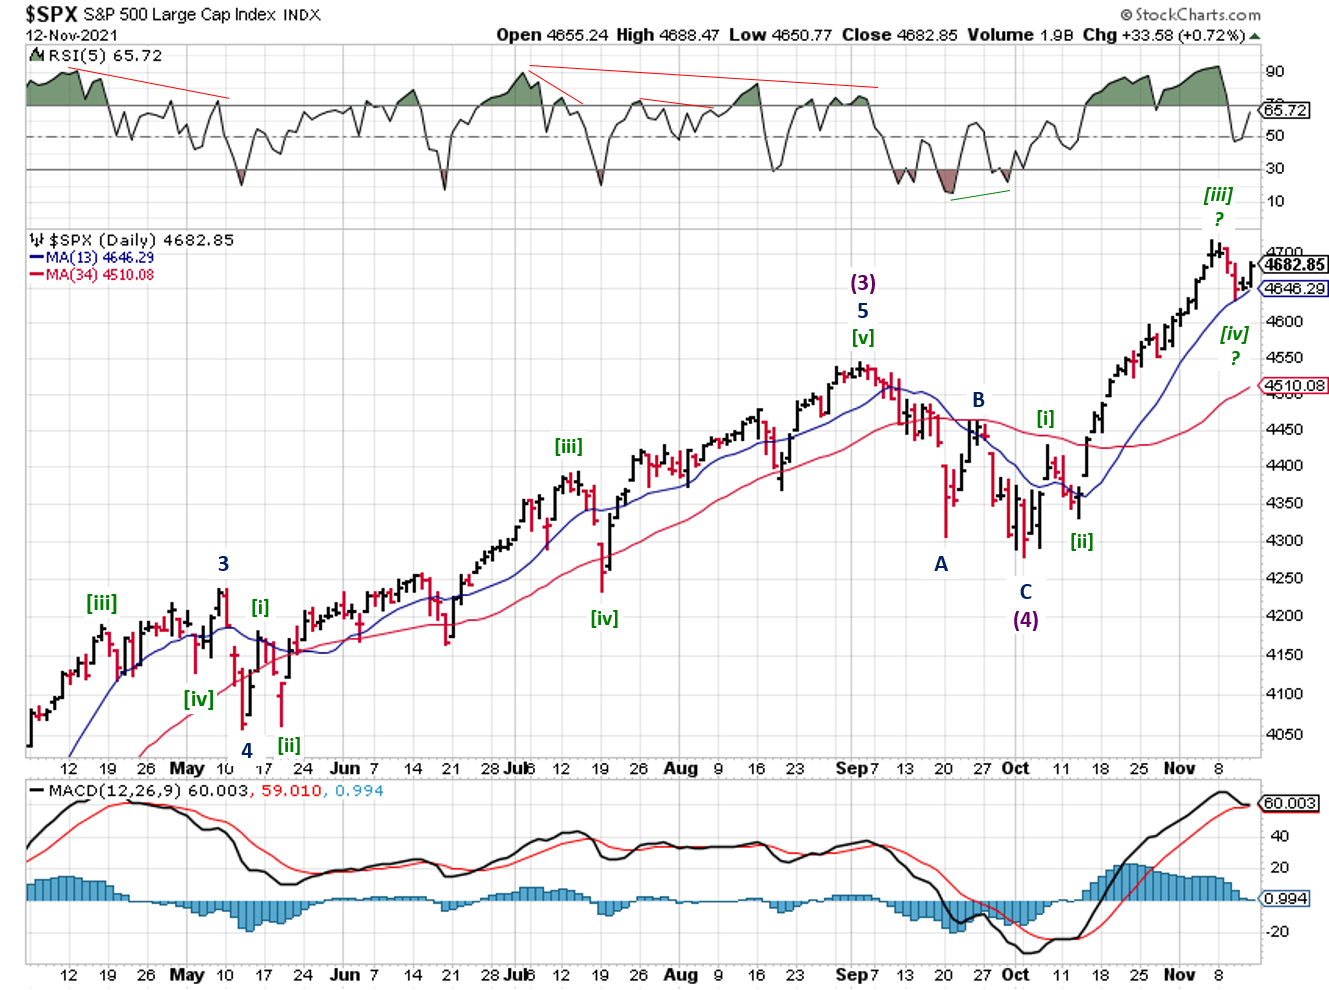
2021-11-14-SPX Elliott Wave Analysis - Daily - Primary 1
COMMENTARY
Inflation? Inflation.
As expected (at least if you read this blog), inflation readings continue to come in above expectations on both ends of the economic spectrum. The Producer Price Index (PPI), which measures the inflation seen by people that make something, came in at a whopping 8.6% year over year. The Consumer Price Index (CPI), which measures the price increases that you and I see when we buy something, increased 6.2% y-o-y. This figure is referred to as the "headline" CPI number or "total" inflation.
When you hear or read about the U.S. Fed's inflation target of 2%, that refers to "Core CPI". Core CPI excludes food and energy prices from the calculation, because those goods tend to have volatile prices. This omission usually provides the Fed some wiggle room, because inflation levels are almost always lower when you remove two of the biggest components. But even Core CPI rose 4.6% y-o-y, so that measure doesn't provide the Fed any cover at the moment.
The insidious part about inflation is the impact; what it leaves in its wake. Next year, prices could be just slightly above today's level, which would show something like 1% inflation y-o-y. The Fed could claim that all is well! Prices have stopped going up, and inflation was indeed transitory.
For consumers, the sting of inflation remains, because the prices that we pay are still "high"; they're just not getting any "higher". The actual impact of inflation is only transitory for you and me if prices go back down to earlier levels, which requires deflation and deflationary policy.
What does all this mean for your investments?
Near-term, the U.S. economy and inflation are likely to continue their rise. In that type of environment, stocks and commodities would continue doing well. As far as sectors are concerned, industrial, technology, and energy would benefit.
Eventually, the inflation numbers will begin to decline, if for other reason than the comparison with 2021's higher than normal increases. At that point, growth will be the wildcard. If economic growth continues, then stocks remain good plays. If growth slows, then equities aren't as attractive overall, and defensive sectors like utilities likely to outperform. In both cases, your asset allocation strategy is key (assets, sectors within asset classes, strategies, etc.).
Best to Your Week!
If you find this research helpful, please tell a friend. If you don't find it helpful, tell an enemy.
I regularly share articles and other news of interest via on Twitter (@investsafely), Facebook, Linkedin, and Instagram (@investsafely)

How to Make Money in Stocks: A Winning System in Good Times and Bad.
It's one of my favorites.
Invest Safely, LLC is an independent investment research and online financial media company. Use of Invest Safely, LLC and any other products available through invest-safely.com are subject to our Terms of Service and Privacy Policy. Not a recommendation to buy or sell any security.
Charts provided courtesy of stockcharts.com.
For historical Elliott Wave Analysis, go to ELLIOTT WAVE lives on by Tony Caldaro. Other interpretations can be found at: Pretzel Logic, and 12345ABCDEWXYZ
Once a year, I review the market outlook signals as if they were a mechanical trading system, while pointing out issues and making adjustments. The goal is to give you to give you an example of how to analyze and continuously improve your own systems.
- 2015 Performance - Stock Market Outlook
- 2016 Performance - Stock Market Outlook
- 2017 Performance - Stock Market Outlook
- 2018 Performance - Stock Market Outlook
- 2019 Performance - Stock Market Outlook
- 2020 Performance - Stock Market Outlook
IMPORTANT DISCLOSURE INFORMATION
This material is for general communication and is provided for informational and/or educational purposes only. None of the content should be viewed as a suggestion that you take or refrain from taking any action nor as a recommendation for any specific investment product, strategy, or other such purpose. Certain information contained herein has been obtained from third-party sources believed to be reliable, but we cannot guarantee its accuracy or completeness.
To the extent that a reader has any questions regarding the applicability of any specific issue discussed above to his/her individual situation, he/she is encouraged to consult with the professional advisors of his/her choosing. Invest Safely, LLC is not a law firm, certified public accounting firm, or registered investment advisor and no portion of its content should be construed as legal, accounting, or investment advice.
The material is not to be construed as an offer or a recommendation to buy or sell a security nor is it to be construed as investment advice. Additionally, the material accessible through this website does not constitute a representation that the investments described herein are suitable or appropriate for any person.
Hypothetical Presentations:
Any referenced performance is “as calculated” using the referenced funds and has not been independently verified. This presentation does not discuss, directly or indirectly, the amount of the profits or losses, realized or unrealized, by any reader or contributor, from any specific funds or securities.
The author and/or any reader may have experienced materially different performance based upon various factors during the corresponding time periods. To the extent that any portion of the content reflects hypothetical results that were achieved by means of the retroactive application of a back-tested model, such results have inherent limitations, including:
Model results do not reflect the results of actual trading using assets, but were achieved by means of the retroactive application of the referenced models, certain aspects of which may have been designed with the benefit of hindsight
Back-tested performance may not reflect the impact that any material market or economic factors might have had on the use of a trading model if the model had been used during the period to actually manage assets
Actual investment results during the corresponding time periods may have been materially different from those portrayed in the model
Past performance may not be indicative of future results. Therefore, no one should assume that future performance will be profitable, or equal to any corresponding historical index.
The S&P 500 Composite Total Return Index (the "S&P") is a market capitalization-weighted index of 500 widely held stocks often used as a proxy for the stock market. Standard & Poor's chooses the member companies for the S&P based on market size, liquidity, and industry group representation. Included are the common stocks of industrial, financial, utility, and transportation companies. The S&P is not an index into which an investor can directly invest. The historical S&P performance results (and those of all other indices) are provided exclusively for comparison purposes only, so as to provide general comparative information to assist an individual in determining whether the performance of a specific portfolio or model meets, or continues to meet investment objective(s). The model and indices performance results do not reflect the impact of taxes.
Investing involves risk (even the “safe” kind)! Past performance does not guarantee or indicate future results. Different types of investments involve varying degrees of underlying risk. Therefore, do not assume that future performance of any specific investment or investment strategy be suitable for your portfolio or individual situation, will be profitable, equal any historical performance level(s), or prove successful (including the investments and/or investment strategies describe on this site).
Investing Process Links
Stabilize- Organize your $$$
- Manage your $$$
Plan
- Why You Invest
- Ways to Invest
- Where to Invest
- What to Invest In
Execute
- When to Invest
- How Much to Invest
- Buying & Selling
Monitor
- Track The Market
- Track Your Returns
Reflect & Adjust
- Improve Your Returns
- Adjust your Holdings
Popular Pages
- Jim Cramer- Personal Incomes Statements
- Hyperinflation
- Calculating Beta
- SMART Financial Goals
Blogroll
- Advisor Perspectives- Dividend Growth Investor
- Elliott Wave Lives On
- On My Radar | CMG Wealth
- Sure Dividend
- The Big Picture
- The Fat Pitch
- Thoughts from the Frontline
- Trader Feed
Sponsored Links
Invest Safely provides valuable, time-saving info about personal finance, money management, and investing.


