Stock Market Outlook
For The Week Of October 10th = Downtrend
INDICATORS
-
ADX Directional Indicators: Downtrend
Price & Volume Action: Mixed
Elliott Wave Analysis: Mixed
The S&P500 ($SPX) tried to break a bearish trendline last week, but was unable to do so.
The ADX shows that downtrend strength peaked last week. That’s good news for bullish investors, even though the signal remains in a downtrend.
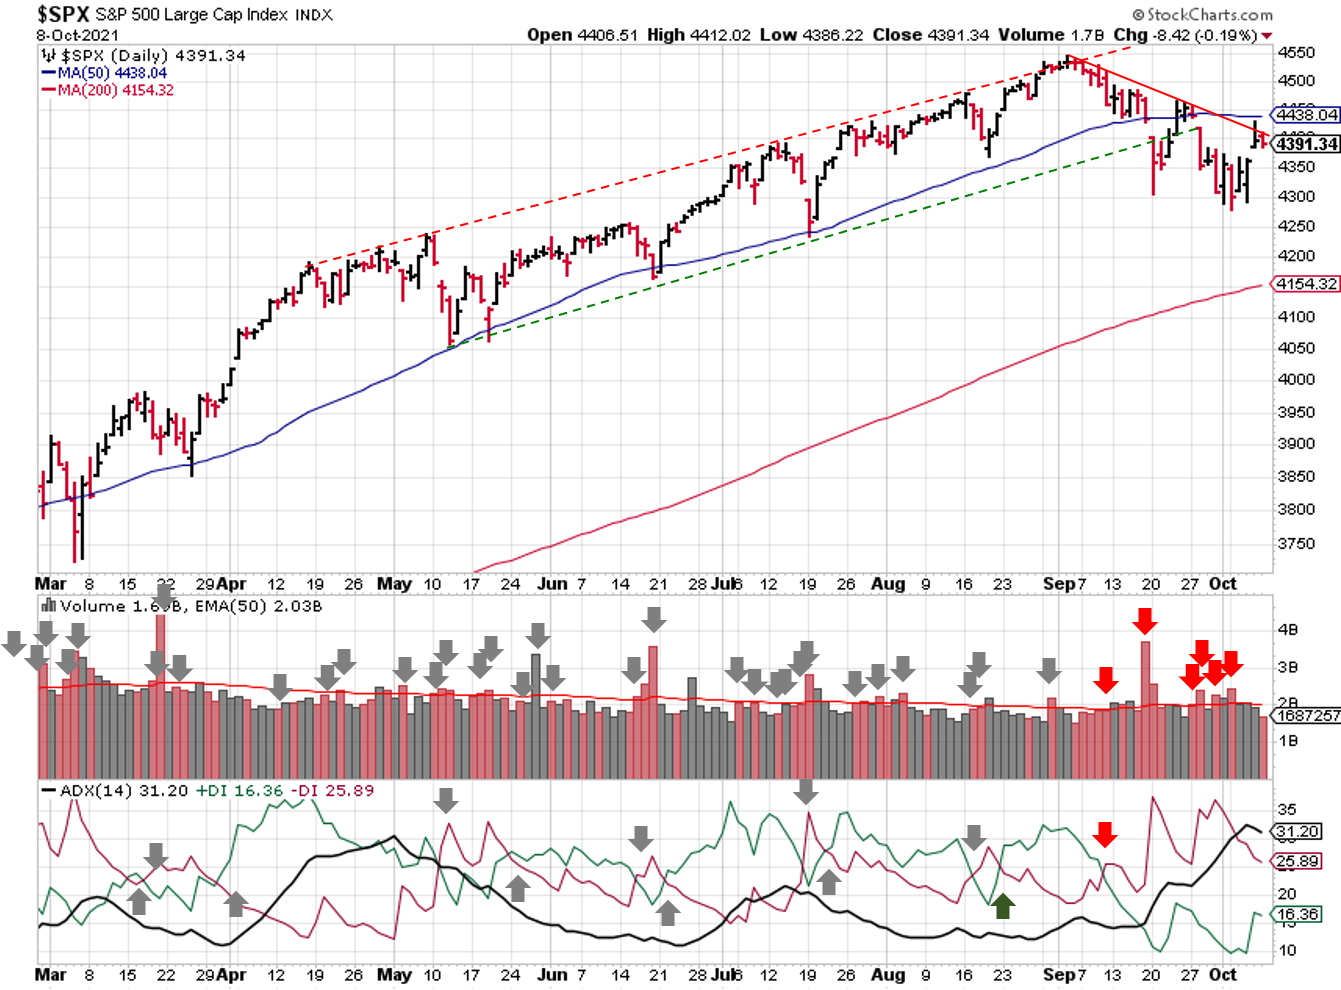
2021-10-10-SPX Trendline Analysis - Daily
From a price and volume perspective, the signal remains mixed. The S&P picked up another distribution day last week, and price remains below the 50-day moving average.
The total count of distribution days stands at 6, which is a bit elevated, but not too severe. Of more concern is the cluster of 4 showing high levels of institutional selling the last week of September. Since we're testing the bearish trendline again, another burst of high volume selling would indicate the correction isn't over.
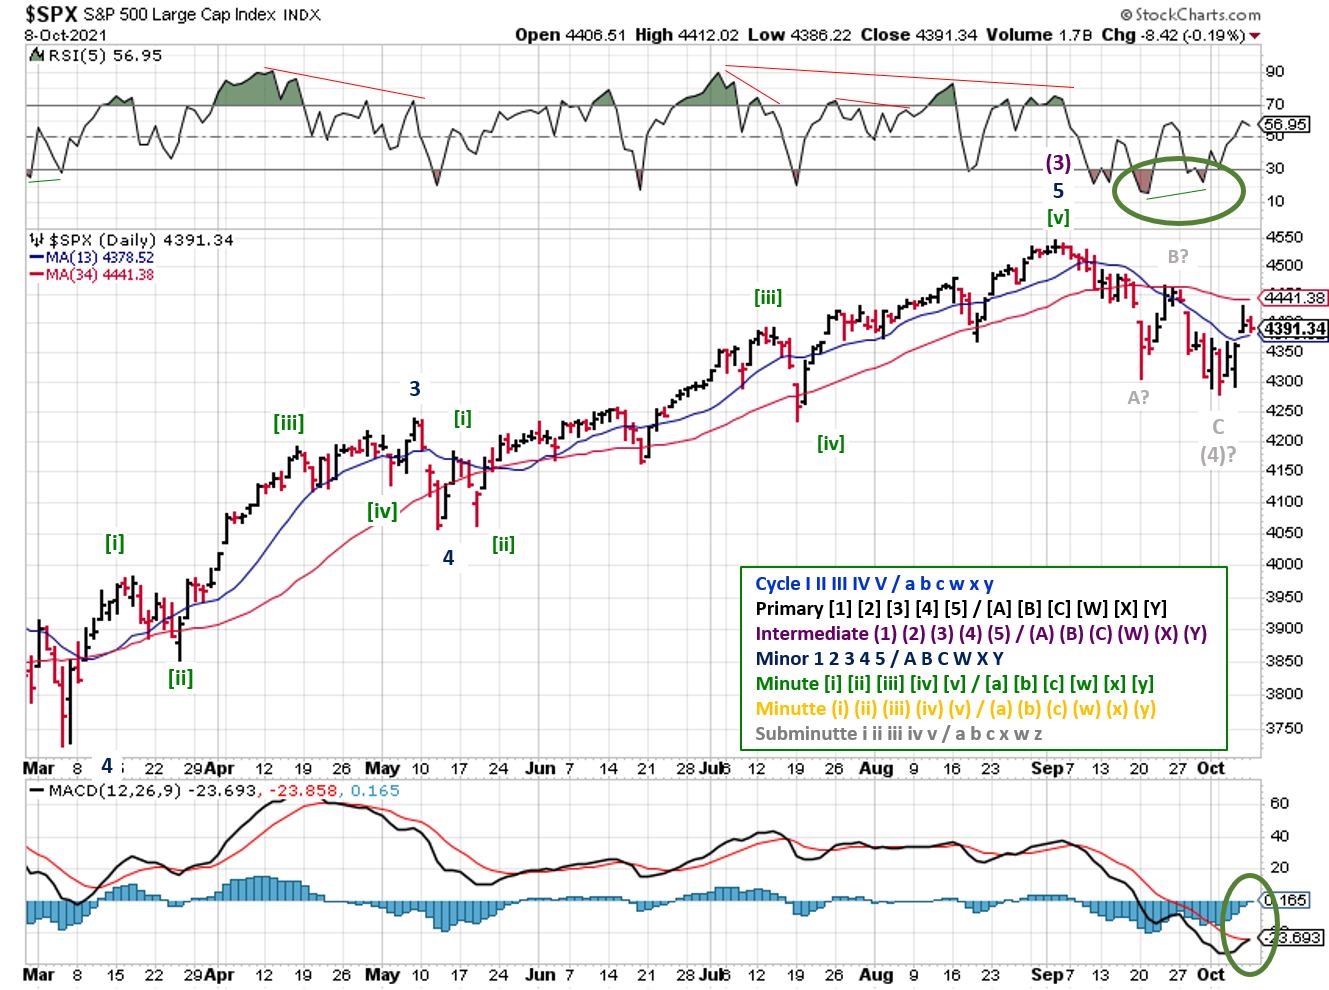
2021-10-10-SPX Elliott Wave Analysis - Daily - Primary 1
For Elliott Wave, the ABC corrective pattern appears to be complete, and along with it Intermediate (4). The technical indicators support this hypothesis; a positive divergence** in the RSI and a cross-over of the MACD histogram (both circled in green).
I'm watching for a break above the Wave B high or a test of the Wave C low before a signal change. If the correction is over, the S&P won’t drop below that low, and the S&P500 has moved into Intermediate (5), which could last ~5 months if it mirrors Intermediate (1).
**A positive divergence is a higher low on the RSI, with a corresponding lower low in price, which suggests that traders weren’t as eager to sell at the lower price level.
COMMENTARY
Commodities, particularly energy, are in the news lately, as the price of oil, natural gas, and coal rocket higher. But if you take a peak below the surface, these trends have been in a place for a while...they just haven't been dramatic enough to reach headline status!

Price chart for Natural Gas | Source: https://tradingeconomics.com/commodity/natural-gas
In the case of natural gas, the price began trending higher back in June of 2020, and really began accelerating in June of this year.
Likewise, coal began it's uptrend early in 2020, but really began moving in September of that year. The move over the past two months looks like a blow-off top. The move in coal could be over, and you're just hearing about it now.

Price chart for Coal | Source: https://tradingeconomics.com/commodity/coal
Obviously, neither of these trends are sustainable. But both of them highlight the need to do your own research, rather than wait for headline news. There's a reason traders say "Buy the rumor, sell the news".
On the political front, the U.S. Congress agreed to a temporary deal that raises the debt ceiling and avoiding default. The next round of posturing will pickup again in a month or so. It's hard to know what the next Fed meeting will bring; will they or won't they begin to taper their quantitative easing. Inflation is running hot, while labor shortages and supply chain issues continue to stress the economy.
And lets not overlook the recent sabre rattling in the sky over Taiwan. A small misstep could have global implications and render most of our current narrative moot.
10 weeks until Christmas! Given the current environment, now might be a great time to start shopping!
Best to Your Week!
If you find this research helpful, please tell a friend. If you don't find it helpful, tell an enemy.
I regularly share articles and other news of interest via on Twitter (@investsafely), Facebook, Linkedin, and Instagram (@investsafely)

How to Make Money in Stocks: A Winning System in Good Times and Bad.
It's one of my favorites.
Invest Safely, LLC is an independent investment research and online financial media company. Use of Invest Safely, LLC and any other products available through invest-safely.com are subject to our Terms of Service and Privacy Policy. Not a recommendation to buy or sell any security.
Charts provided courtesy of stockcharts.com.
For historical Elliott Wave Analysis, go to ELLIOTT WAVE lives on by Tony Caldaro. Other interpretations can be found at: Pretzel Logic, and 12345ABCDEWXYZ
Once a year, I review the market outlook signals as if they were a mechanical trading system, while pointing out issues and making adjustments. The goal is to give you to give you an example of how to analyze and continuously improve your own systems.
- 2015 Performance - Stock Market Outlook
- 2016 Performance - Stock Market Outlook
- 2017 Performance - Stock Market Outlook
- 2018 Performance - Stock Market Outlook
- 2019 Performance - Stock Market Outlook
- 2020 Performance - Stock Market Outlook
IMPORTANT DISCLOSURE INFORMATION
This material is for general communication and is provided for informational and/or educational purposes only. None of the content should be viewed as a suggestion that you take or refrain from taking any action nor as a recommendation for any specific investment product, strategy, or other such purpose. Certain information contained herein has been obtained from third-party sources believed to be reliable, but we cannot guarantee its accuracy or completeness.
To the extent that a reader has any questions regarding the applicability of any specific issue discussed above to his/her individual situation, he/she is encouraged to consult with the professional advisors of his/her choosing. Invest Safely, LLC is not a law firm, certified public accounting firm, or registered investment advisor and no portion of its content should be construed as legal, accounting, or investment advice.
The material is not to be construed as an offer or a recommendation to buy or sell a security nor is it to be construed as investment advice. Additionally, the material accessible through this website does not constitute a representation that the investments described herein are suitable or appropriate for any person.
Hypothetical Presentations:
Any referenced performance is “as calculated” using the referenced funds and has not been independently verified. This presentation does not discuss, directly or indirectly, the amount of the profits or losses, realized or unrealized, by any reader or contributor, from any specific funds or securities.
The author and/or any reader may have experienced materially different performance based upon various factors during the corresponding time periods. To the extent that any portion of the content reflects hypothetical results that were achieved by means of the retroactive application of a back-tested model, such results have inherent limitations, including:
Model results do not reflect the results of actual trading using assets, but were achieved by means of the retroactive application of the referenced models, certain aspects of which may have been designed with the benefit of hindsight
Back-tested performance may not reflect the impact that any material market or economic factors might have had on the use of a trading model if the model had been used during the period to actually manage assets
Actual investment results during the corresponding time periods may have been materially different from those portrayed in the model
Past performance may not be indicative of future results. Therefore, no one should assume that future performance will be profitable, or equal to any corresponding historical index.
The S&P 500 Composite Total Return Index (the "S&P") is a market capitalization-weighted index of 500 widely held stocks often used as a proxy for the stock market. Standard & Poor's chooses the member companies for the S&P based on market size, liquidity, and industry group representation. Included are the common stocks of industrial, financial, utility, and transportation companies. The S&P is not an index into which an investor can directly invest. The historical S&P performance results (and those of all other indices) are provided exclusively for comparison purposes only, so as to provide general comparative information to assist an individual in determining whether the performance of a specific portfolio or model meets, or continues to meet investment objective(s). The model and indices performance results do not reflect the impact of taxes.
Investing involves risk (even the “safe” kind)! Past performance does not guarantee or indicate future results. Different types of investments involve varying degrees of underlying risk. Therefore, do not assume that future performance of any specific investment or investment strategy be suitable for your portfolio or individual situation, will be profitable, equal any historical performance level(s), or prove successful (including the investments and/or investment strategies describe on this site).
Investing Process Links
Stabilize- Organize your $$$
- Manage your $$$
Plan
- Why You Invest
- Ways to Invest
- Where to Invest
- What to Invest In
Execute
- When to Invest
- How Much to Invest
- Buying & Selling
Monitor
- Track The Market
- Track Your Returns
Reflect & Adjust
- Improve Your Returns
- Adjust your Holdings
Popular Pages
- Jim Cramer- Personal Incomes Statements
- Hyperinflation
- Calculating Beta
- SMART Financial Goals
Blogroll
- Advisor Perspectives- Dividend Growth Investor
- Elliott Wave Lives On
- On My Radar | CMG Wealth
- Sure Dividend
- The Big Picture
- The Fat Pitch
- Thoughts from the Frontline
- Trader Feed
Sponsored Links
Invest Safely provides valuable, time-saving info about personal finance, money management, and investing.


