No-Advice Disclaimer: This analysis is for informational purposes only and not a recommendation to buy or sell any security.
Stock Market Outlook: August 23rd =
Uptrend
Author: J.Wenger ---- Published: August 23, 2026 ---- Last Updated: 2026-08-23
Disclosure: The author holds no material positions in the securities mentioned. See Editorial Policy & Disclosures for details.
TREND ANALYSIS
The S&P500 ( $SPX ) fell 1.4% last week. The index is:- ~2% above the 50-day moving average
- ~8% above the 200-day moving average
- Average Directional Index: Neutral
- No change
- Institutional Activity: Bullish
- Two distribution days cropped up last week, but the overall count is low and price remains above key moving averages
- On-Balance Volume: Neutral
- No change
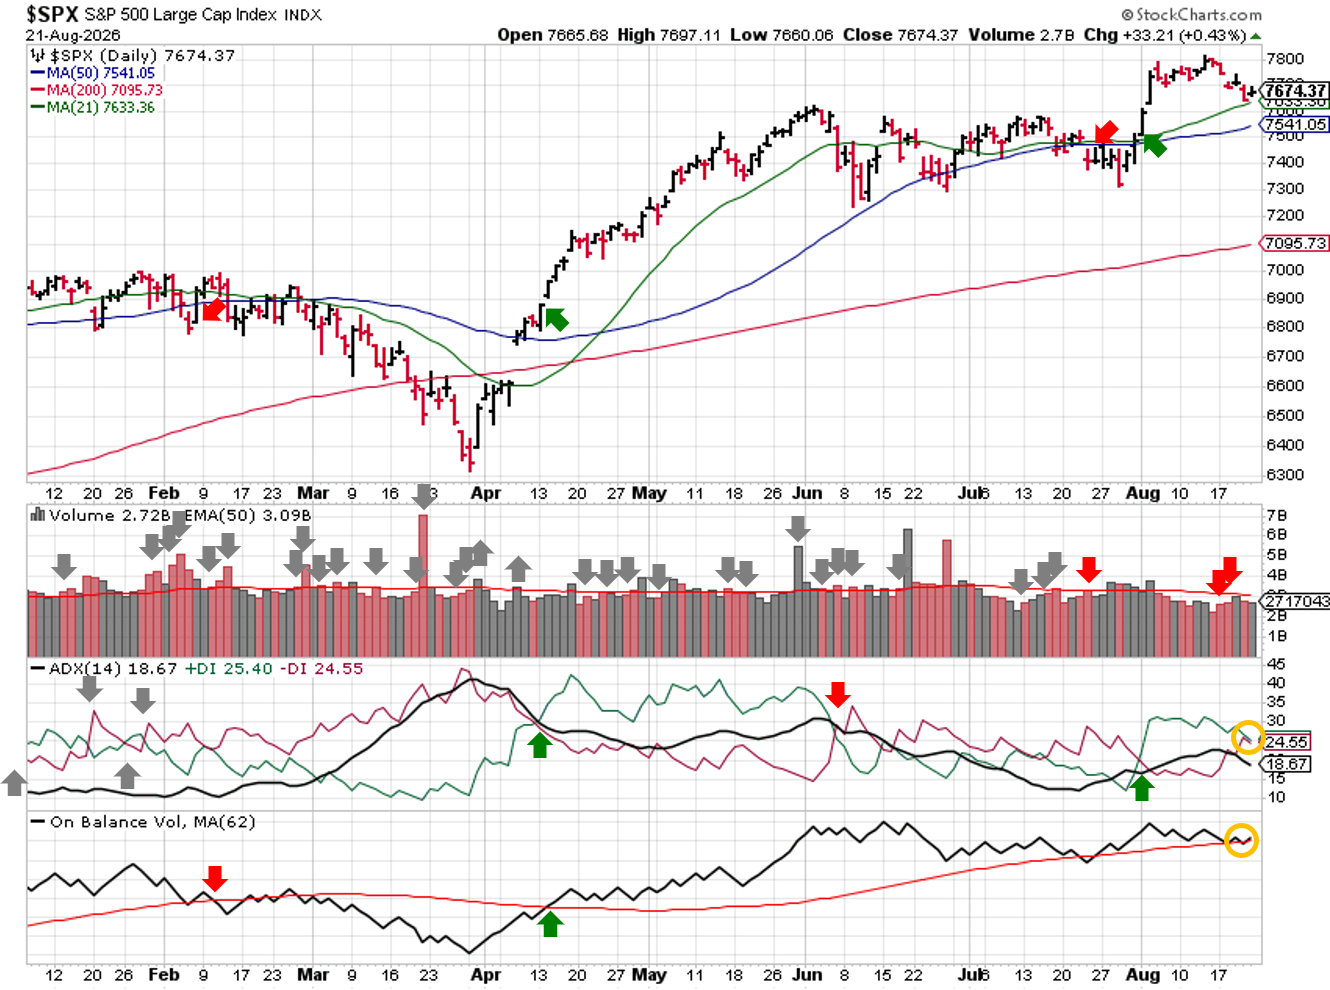
Technical Analysis – $SPX – 2026-08-23
PERFORMANCE HIGHLIGHTS & COMPARISONS
Asset Classes
Bitcoin ( $IBIT ) roared back to life last week, easily providing the highest gains and jumping back to bullish bias. U.S. Equities were the worst asset class. Bitcoin was the worst performer. Emerging Market Equities moved to bullish bias as well.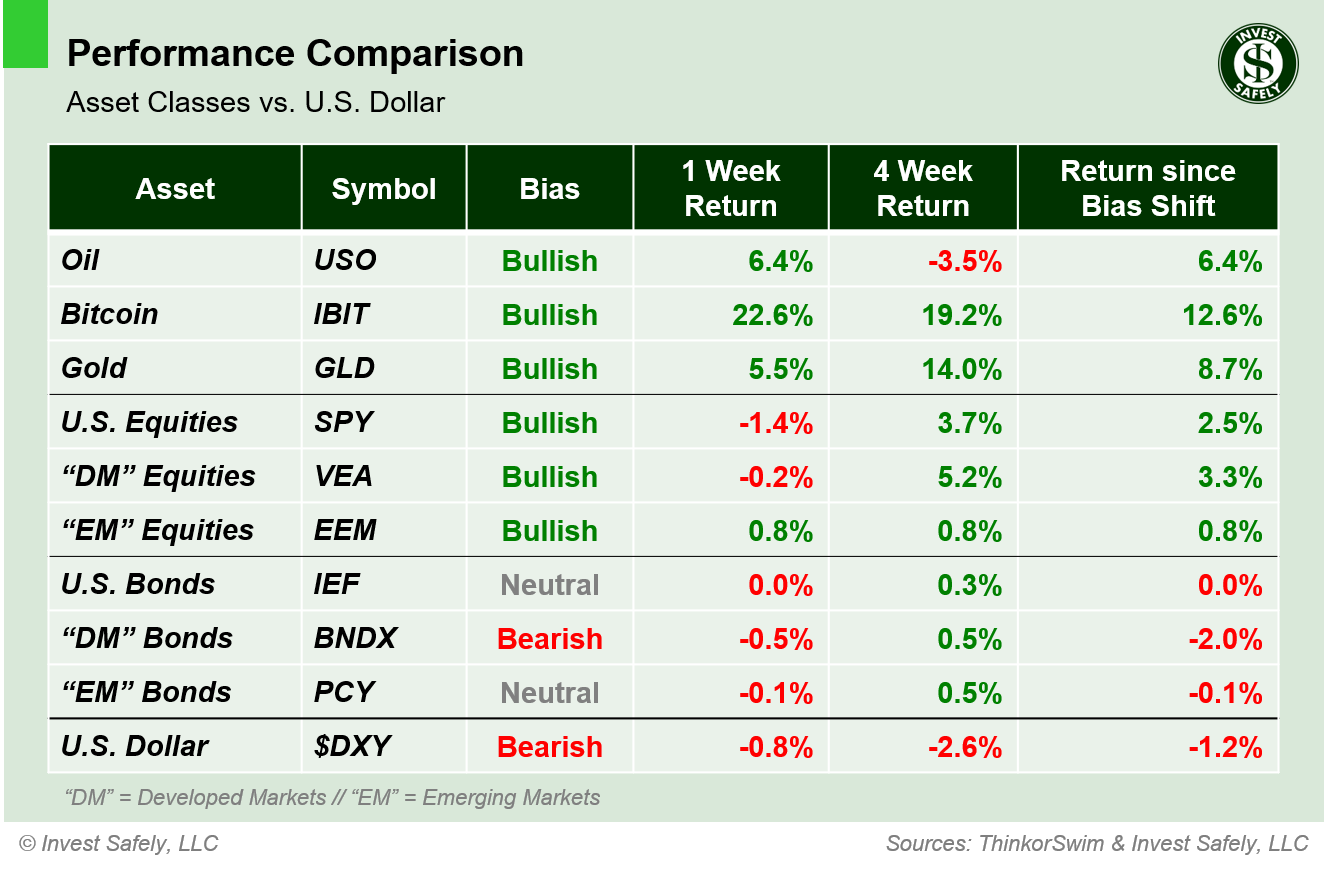
Asset Class Performance vs. U.S. Dollar – 2026-08-23
S&P500 Sectors
Healthcare ( $XLV ) outperformed other sectors last week, thanks to the gains by Moderna. Industrials, Technology, and Utilities ( $XLI, $XLK, $XLU ) basically tied for the worst sector. Both Industrials and Technology also eased to neutral bias.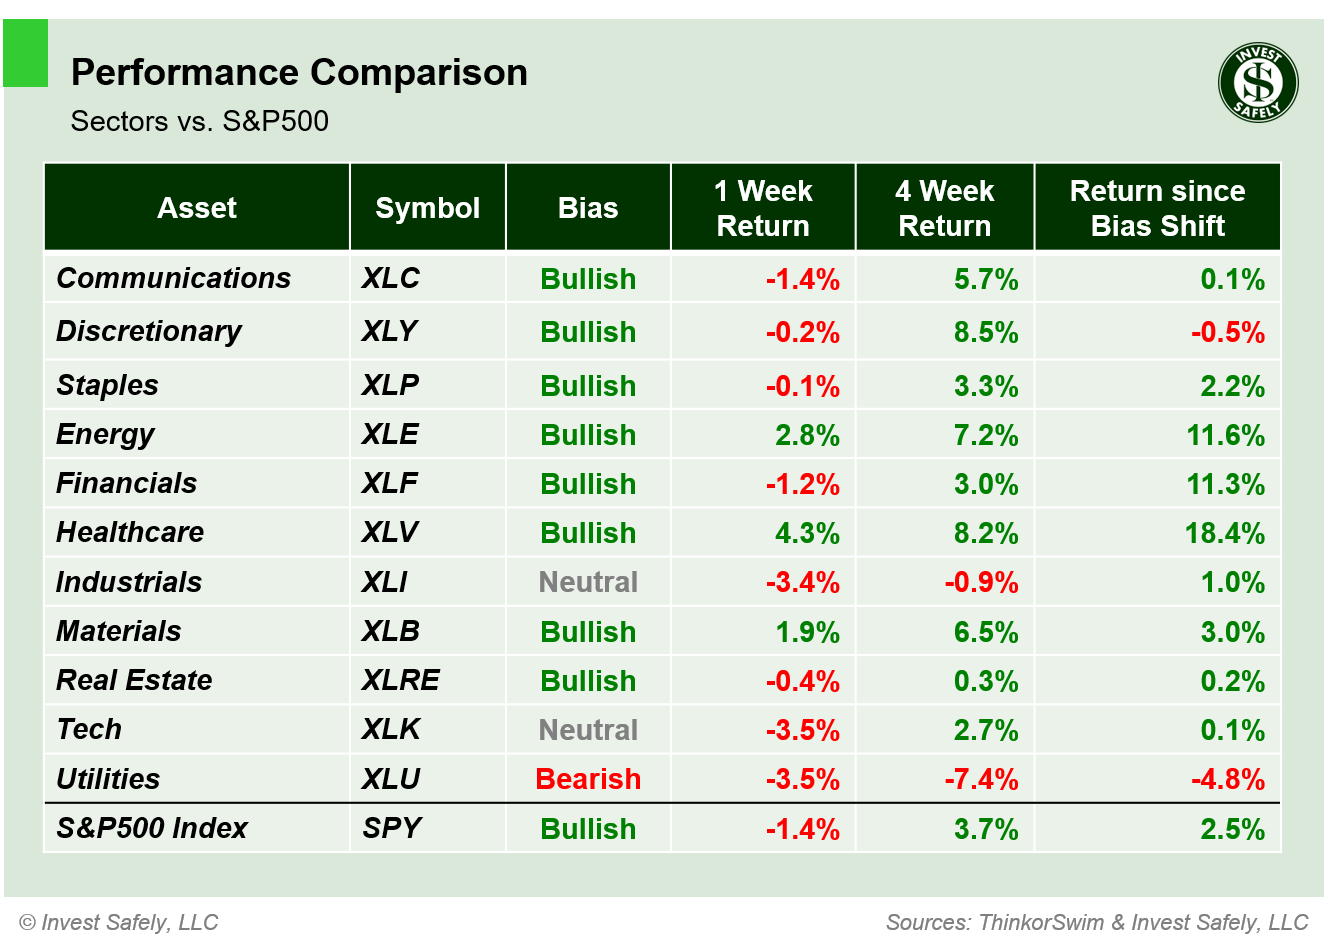
S&P500 Sector Performance – 2026-08-23
S&P500 Investing Styles
All investing styles were in the red last week; High Dividend ( $SPHD ) was the "best performer", while Momentum ( $MTUM ) was the worst. Momentum also dropped back to bearish bias, one week after returning to bullish. Low Volatility and Large Cap Growth ( $SPLV, $IEF ) eased to neutral.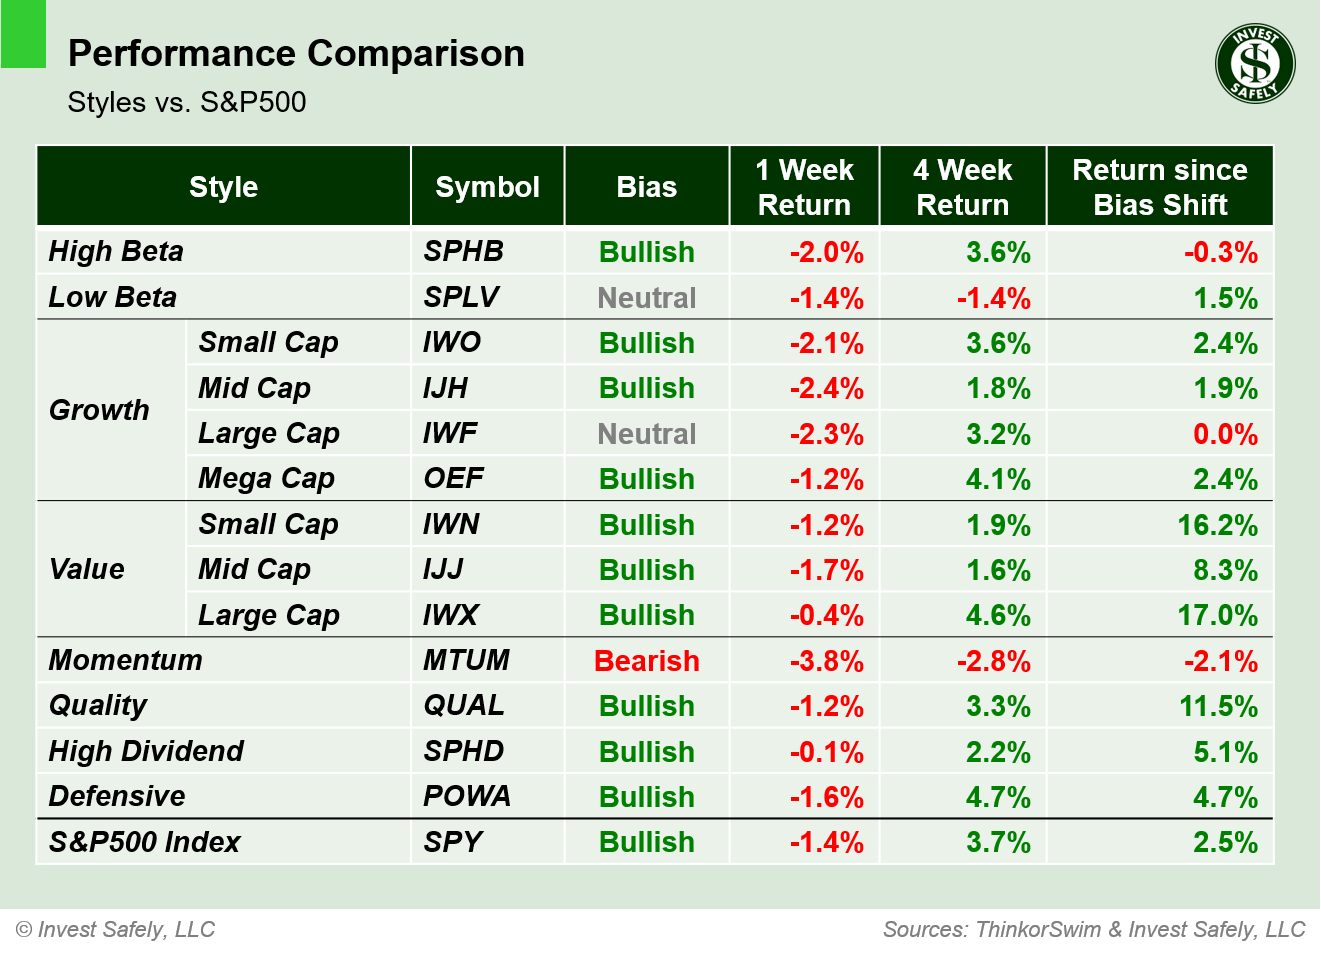
Style Performance vs. S&P500 – 2026-08-23
COMMENTARY
Markets
Equities took a backseat to the debt market last week, at least in terms of catalysts (see below). The big winner, so far, has been crypto, as bitcoin catapulted 20%+ during the week. Gold prices also rallied, while bonds and the dollar sank, which is the typical response to the interventions we've seen so far this summer.Macroeconomic Data and Policy
The U.S. national debt passed the $40 trillion mark last week, generating lots of headlines about the deficit and pushing long-term borrowing costs (i.e. yields) higher. The 30-year U.S. Treasury reached its highest level since June 2007, meaning you have to go back prior to the financial crisis and Great Recession to find rates as high. In an attempt to reverse the recent trend in long-term yields, the U.S. Treasury Department announced a market intervention (yes, another one). It will double its maximum buyback per month, from $2 billion to at least $4 billion per operation, running from September 9th to November 4th. Further action, if needed, will be announced at the next Quarterly Refunding Announcement, also scheduled for November 4th. The FOMC meeting minutes from July revealed that half of the committee penciled in rate hikes sometime in 2026.Geopolitics
The formal ceasefire MOU between the U.S. and Iran expired last Monday, without any further progress. Traffic through the Strait of Hormuz remains limited, keeping the pressure on oil prices. Trade negotiations between the U.S. and Canada collapsed on Friday, leading the Trump administration to place 50% tariffs on certain Canadian goods. The following day, Prime Minister Mark Carney declared that Canada is "at war" with the U.S. economically and announced retaliatory, dollar-for-dollar tariffs (effective September 8). President Trump also signed an executive order, aimed at reducing food prices. The U.S. plans to import up to 300,000 metric tons of ground beef, tariff-free, with importers agreeing to drop the price 25% below current market rates.EYES ON THE HORIZON
Key decision-making data, in the form of PCE and GDP, comes out midweek. It's also the week of the FOMC's annual meeting in Jackson Hole, so there's light week of economic data, with the only "real" catalyst related to the last FOMC meeting. And we've just added a speech from US Treasury Secretary Bessent on Monday afternoon to navigate.- Monday: Bessent Speech
- Tuesday: --
- Wednesday: July PCE, Q2 GDP (2nd Estimate)
- Thursday: --
- Friday: Warsh Speech, Annual NFP Revisions
P.S. If you find this research helpful, please tell a friend.
If you don't, tell an enemy.
Share this post on social media:
Facebook (@InvestSafely)
X / Twitter (@investsafely)
LinkedIn (@Invest-Safely)
Instagram (@investsafely)
Content Sources:
Bloomberg, CNBC, Federal Reserve Bank of St. Louis (FRED), Hedgeye, StockCharts.com,
TradingEconomics.com, U.S. Bureau of Economic Analysis, U.S. Bureau of Labor Statistics.
Price and Volume charts provided courtesy of stockcharts.com.
Performance Methodology: All sector performance data is sourced from ThinkorSwim and reflects price‑only returns calculated using end‑of‑week closing data. Bias classifications follow a proprietary Invest Safely, LLC model and update only when trend conditions meet predefined thresholds. All calculations are consistent across every chart on this page.
Disclaimer:
Invest Safely, LLC is an independent investment research and online financial media company.
Use of Invest Safely, LLC and any products available through Invest‑Safely.com is subject to
our Terms of Service and Privacy Policy.
 If you're interested in learning more about the relationship between price and volume, or how to find and trade the best stocks for your growth strategy, check out this book via the following Amazon affiliate link:
How to Make Money in Stocks: A Winning System in Good Times and Bad.
It's one of my favorites.
Looking for more information on the Stock Market Outlook Signals? You'll find it here:
In the past, I reviewed market outlook signals as if they were a mechanical trading system, while pointing out issues and making adjustments. The goal is to give you to give you an example of how to analyze and continuously improve your own systems.
- 2015 Performance - Stock Market Outlook
- 2016 Performance - Stock Market Outlook
- 2017 Performance - Stock Market Outlook
- 2018 Performance - Stock Market Outlook
- 2019 Performance - Stock Market Outlook
- 2020 Performance - Stock Market Outlook
For historical Elliott Wave commentary and analysis, go to ELLIOTT WAVE lives on by Tony Caldaro.
IMPORTANT DISCLOSURE INFORMATION
This material is for general communication and is provided for informational and/or educational purposes only. None of the content should be viewed as a suggestion that you take or refrain from taking any action nor as a recommendation for any specific investment product, strategy, or other such purpose. Certain information contained herein has been obtained from third-party sources believed to be reliable, but we cannot guarantee its accuracy or completeness.
To the extent that a reader has any questions regarding the applicability of any specific issue discussed above to his/her individual situation, he/she is encouraged to consult with the professional advisors of his/her choosing. Invest Safely, LLC is not a law firm, certified public accounting firm, or registered investment advisor and no portion of its content should be construed as legal, accounting, or investment advice.
The material is not to be construed as an offer or a recommendation to buy or sell a security nor is it to be construed as investment advice. Additionally, the material accessible through this website does not constitute a representation that the investments described herein are suitable or appropriate for any person.
Hypothetical Presentations:
Any referenced performance is “as calculated” using the referenced funds and has not been independently verified. This presentation does not discuss, directly or indirectly, the amount of the profits or losses, realized or unrealized, by any reader or contributor, from any specific funds or securities.
The author and/or any reader may have experienced materially different performance based upon various factors during the corresponding time periods. To the extent that any portion of the content reflects hypothetical results that were achieved by means of the retroactive application of a back-tested model, such results have inherent limitations, including:
Model results do not reflect the results of actual trading using assets, but were achieved by means of the retroactive application of the referenced models, certain aspects of which may have been designed with the benefit of hindsight
Back-tested performance may not reflect the impact that any material market or economic factors might have had on the use of a trading model if the model had been used during the period to actually manage assets
Actual investment results during the corresponding time periods may have been materially different from those portrayed in the model
Past performance may not be indicative of future results. Therefore, no one should assume that future performance will be profitable, or equal to any corresponding historical index.
The S&P 500 Composite Total Return Index (the "S&P") is a market capitalization-weighted index of 500 widely held stocks often used as a proxy for the stock market. Standard & Poor's chooses the member companies for the S&P based on market size, liquidity, and industry group representation. Included are the common stocks of industrial, financial, utility, and transportation companies. The S&P is not an index into which an investor can directly invest. The historical S&P performance results (and those of all other indices) are provided exclusively for comparison purposes only, so as to provide general comparative information to assist an individual in determining whether the performance of a specific portfolio or model meets, or continues to meet investment objective(s). The model and indices performance results do not reflect the impact of taxes.
Investing involves risk (even the “safe” kind)! Past performance does not guarantee or indicate future results. Different types of investments involve varying degrees of underlying risk. Therefore, do not assume that future performance of any specific investment or investment strategy be suitable for your portfolio or individual situation, will be profitable, equal any historical performance level(s), or prove successful (including the investments and/or investment strategies describe on this site).
Investing Process Links
Stabilize- Organize your $$$
- Manage your $$$
Plan
- Why You Invest
- Ways to Invest
- Where to Invest
- What to Invest In
Execute
- When to Invest
- How Much to Invest
- Buying & Selling
Monitor
- Track The Market
- Track Your Returns
Reflect & Adjust
- Improve Your Returns
- Adjust your Holdings
Popular Pages
- Jim Cramer- Personal Incomes Statements
- Hyperinflation
- Calculating Beta
- SMART Financial Goals
Blogroll
- Advisor Perspectives- Dividend Growth Investor
- Elliott Wave Lives On
- On My Radar | CMG Wealth
- Sure Dividend
- The Big Picture
- The Fat Pitch
- Thoughts from the Frontline
- Trader Feed
Sponsored Links
Invest Safely provides valuable, time-saving info about personal finance, money management, and investing.


