No-Advice Disclaimer: This analysis is for informational purposes only and not a recommendation to buy or sell any security.
Stock Market Outlook: May 17th =
Uptrend
Author: J.Wenger ---- Published: May 17, 2026 ---- Last Updated: 2026-05-17
Disclosure: The author holds no material positions in the securities mentioned. See Editorial Policy & Disclosures for details.
Oil, Energy, and Large Cap Growth outperformed; Emerging Markets, Consumer Discretionary, and Small/MidCap value underperformed. Inflation data was much higher than expected, pushing interest rates above long-term levels and pressuring other assets.
TREND ANALYSIS
The S&P500 ( $SPX ) rose 0.1% last week. The index is:- ~8% above the 50-day moving average
- ~10% above the 200-day moving average
- Average Directional Index: Bullish
- No change
- Institutional Activity: Bullish
- Another distribution day added to the count ( 4 )
- On-Balance Volume: Bullish
- No change
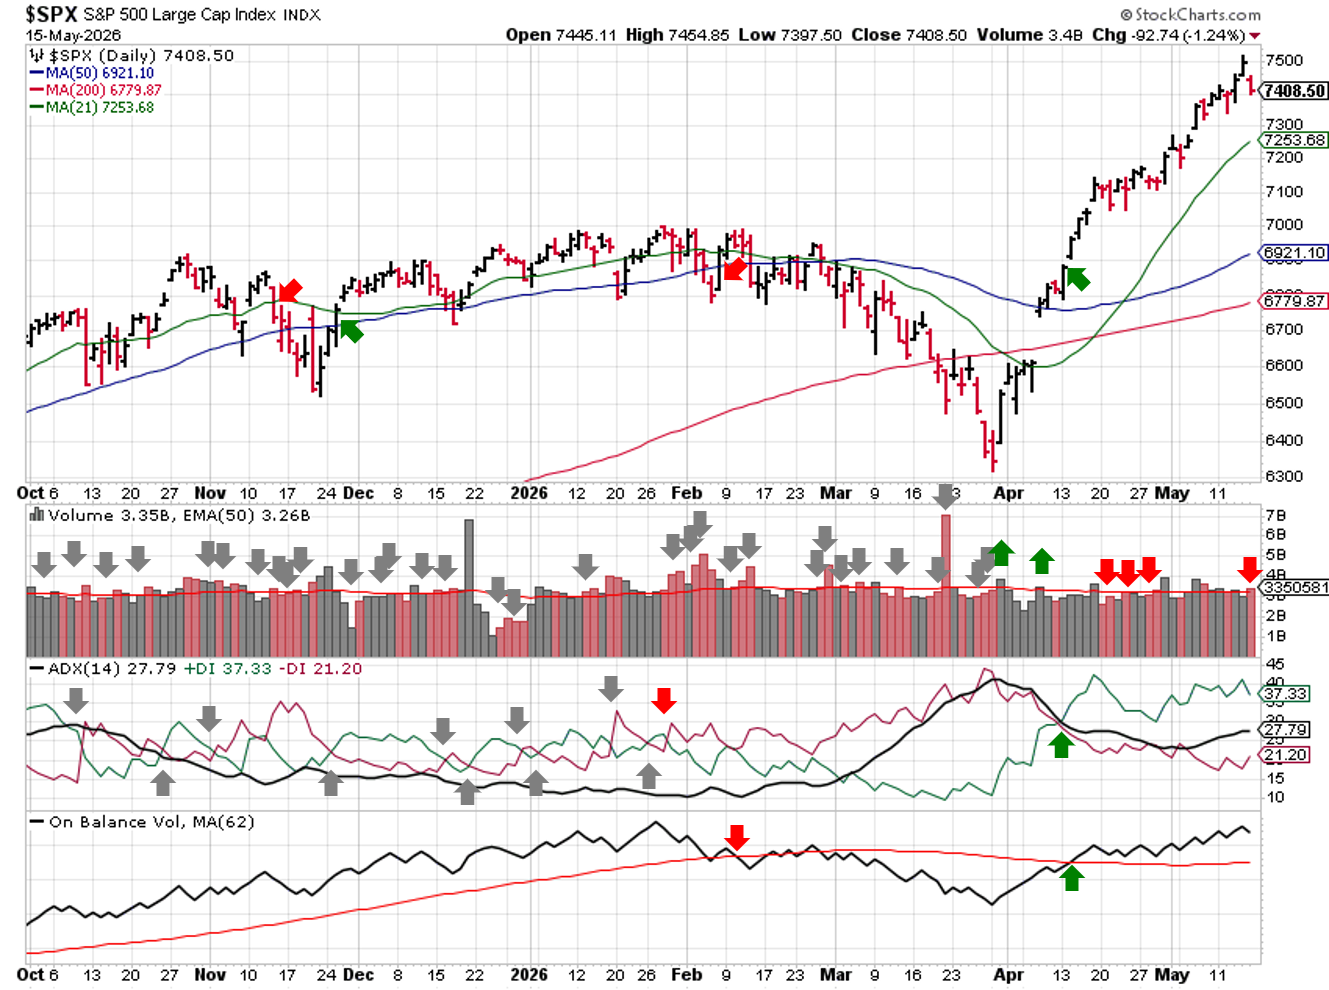
Technical Analysis – $SPX – 2026-05-17
PERFORMANCE HIGHLIGHTS & COMPARISONS
Asset Classes
Oil ( $USO ) led to the upside last week. Emerging Market Equities ( $EEM) reversed the prior weeks win and led to the downside. U.S. and Development Market Bonds ( $IEF, $BNDX ) fell to bearish bias after a strong move in long-dated interest rates, while the US Dollar ( $DXY ) moved up to neutral bias.
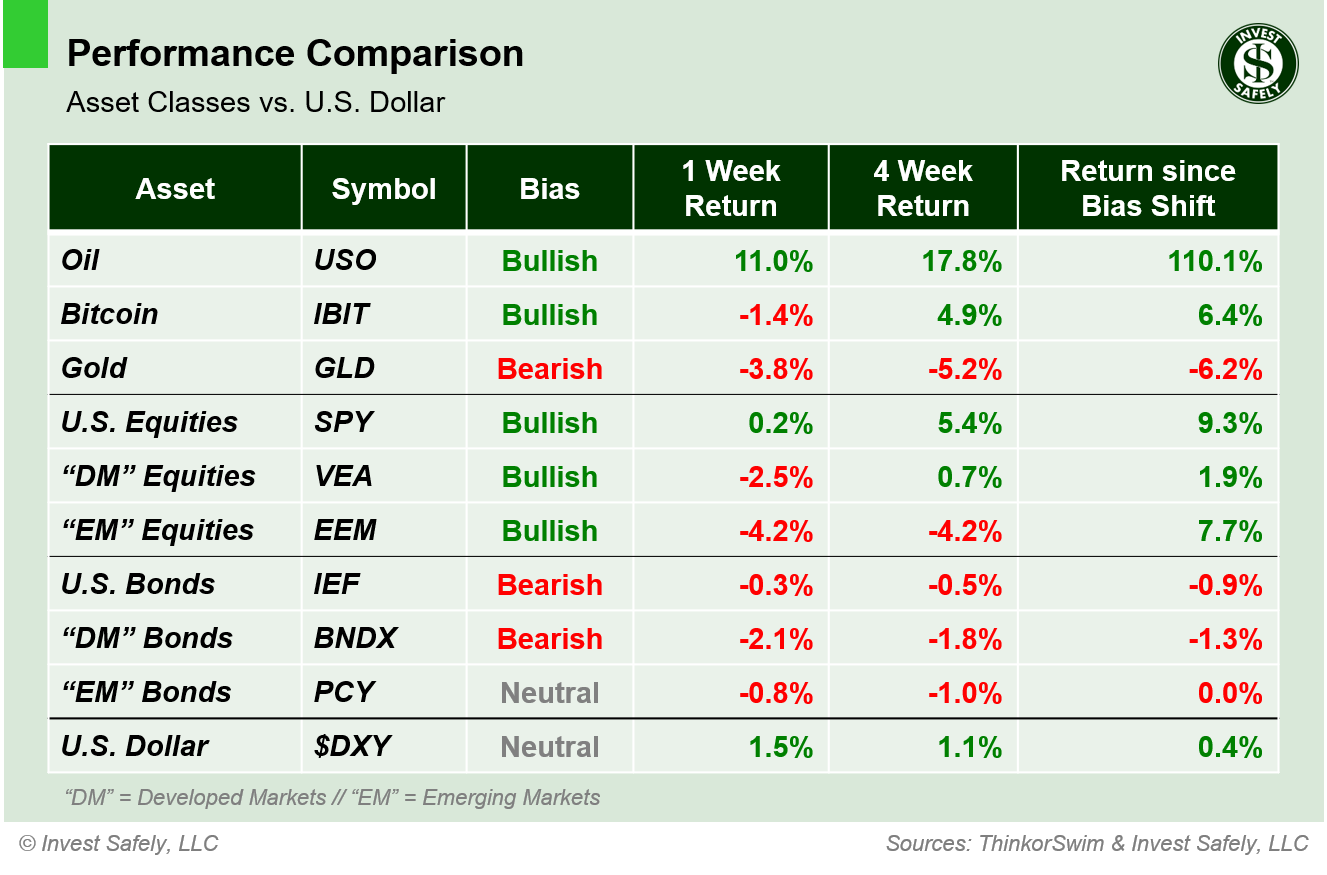
Asset Class Performance vs. U.S. Dollar – 2026-05-17
S&P500 Sectors
A week after leading to the downside and falling to bearish bias, Energy ( $XLE ) outperformed all other sectors in dramatic fashion, bested the index by than 6%, and reclaimed bullish bias. Consumer Discretionary ( $XLY ) was the worst sector. Consumer Staples ( $XLP ) shifted back to neutral bias, while Industrials ( $XLI ) fell to bearish.
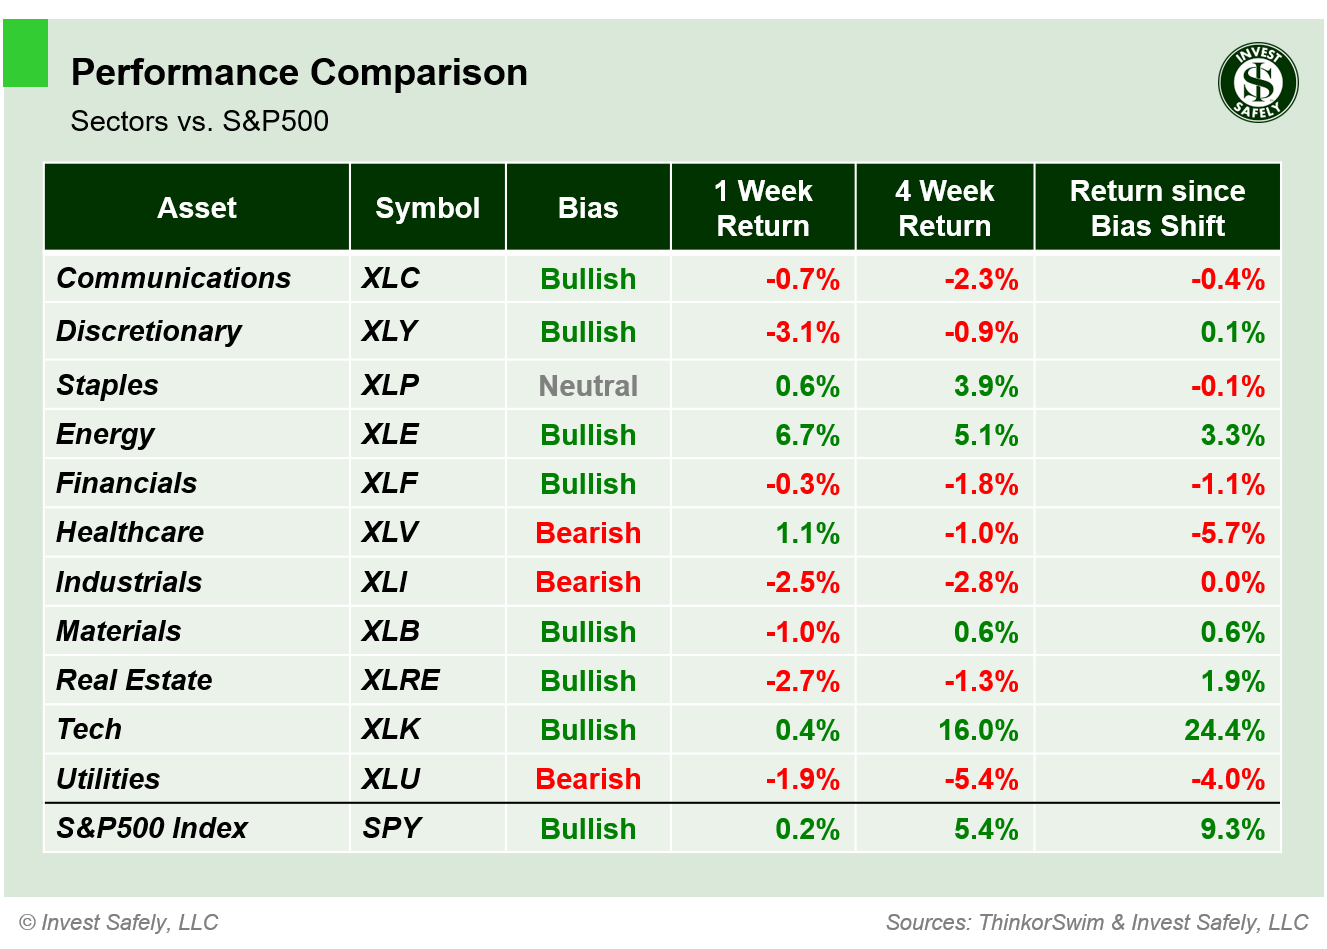
S&P500 Sector Performance – 2026-05-17
S&P500 Investing Styles
Large Cap Growth ( $IEF ) led to the upside, one of two outperformers. Small and Mid Cap Value ( $IWN, $IJJ ) tied for the worst performance, though High Beta, Mid Cap Growth, and Defensives ( $SPHB, $IJH, $POWA ) weren't far behind. There were no bias changes.
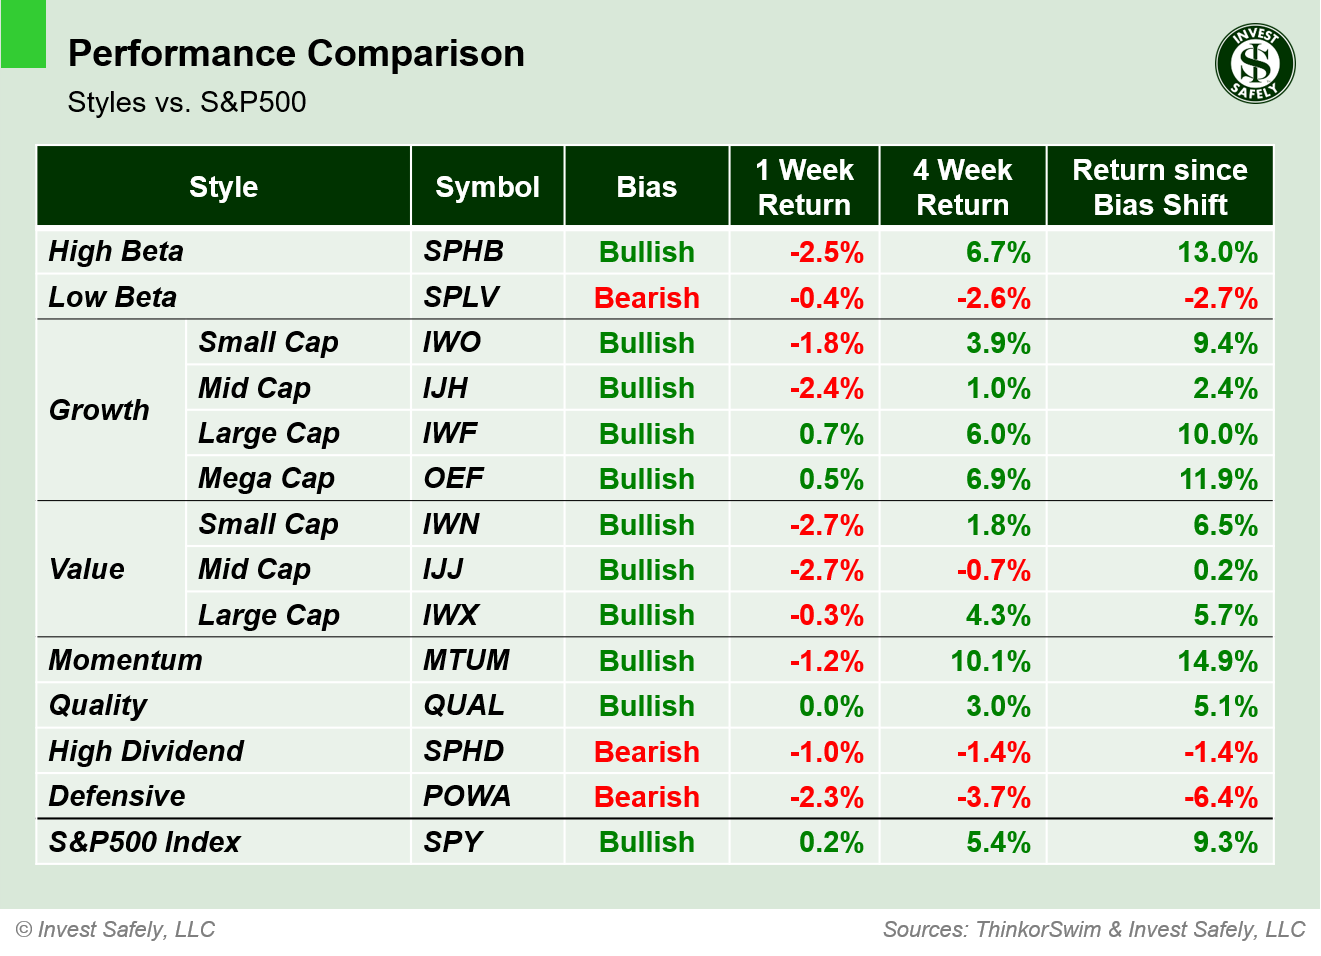
Style Performance vs. S&P500 – 2026-05-17
COMMENTARY
Markets
The jump in inflation data ( more below ) sent interest rates up, particularly on the long-end of the curve, with renewed fears of a "higher for longer" environment. 30-year U.S. Treasuries hit 5.12% on Friday, the highest level since July of 2007. Resurgent oil prices and a stronger dollar added to the downward pressure on other asset classes.According to the International Energy Agency ( IEA ), the crude oil in storage tanks and tanker ships is dwindling at a record pace. They warned that even with a reopened Hormuz , the market could remain undersupplied until October and raising probabilities of global shortages.
Macroeconomic Data and Policy
CPI inflation hit +3.8% in April; up 1.5% verses last years April reading of +2.3%! That's a big move. Interestingly, Core CPI was flat during the same time period, showing the impact of food and energy prices over the past 12 months.It was the PPI reading that surprised market participants, hitting +6% in April...up from +2.4% at this time last year (yes, that means PPI is more than double last years figure). Even the month over month was much higher than expected, and that includes an increased to March figures. Core increased to +5.2%, not quite double last years figure of +3.1%, but nothing to celebrate.
Geopolitics
A quiet week in the U.S.-Iran "Maritime Conflict & Ceasefire" saga, as investors focused on the Trump-Xi summit in Beijing. The meetings generated corporate headlines and photo ops, but didn't not result in any major policy agreements...but be on the lookout for social media diplomacy nonetheless.
EYES ON THE HORIZON
This week is light on high impact news: FOMC meeting minutes on Tuesday. Lower impact data sets includes pending home sales, the Philly Fed Manufacturing Index, and Flash PMI.- Monday: --
- Tuesday: FOMC Meeting Minutes
- Wednesday: --
- Thursday: --
- Friday: --
Best to Your Week!
P.S. If you find this research helpful, please tell a friend.
If you don't, tell an enemy.
Share this post on social media:
Facebook (@InvestSafely)
X / Twitter (@investsafely)
LinkedIn (@Invest-Safely)
Instagram (@investsafely)
Content Sources: Bloomberg, CNBC, Federal Reserve Bank of St. Louis (FRED), Hedgeye, StockCharts.com, TradingEconomics.com, U.S. Bureau of Economic Analysis, U.S. Bureau of Labor Statistics.
Price and Volume charts provided courtesy of stockcharts.com.
Performance Methodology: All sector performance data is sourced from ThinkorSwim and reflects price‑only returns calculated using end‑of‑week closing data. Bias classifications follow a proprietary Invest Safely, LLC model and update only when trend conditions meet predefined thresholds. All calculations are consistent across every chart on this page.
Disclaimer: Invest Safely, LLC is an independent investment research and online financial media company. Use of Invest Safely, LLC and any products available through Invest‑Safely.com is subject to our Terms of Service and Privacy Policy.
Not a recommendation to buy or sell any security.
Looking for more information on the Stock Market Outlook Signals? You'll find it here:
 If you're interested in learning more about the relationship between price and volume, or how to find and trade the best stocks for your growth strategy, check out this book via the following Amazon affiliate link:
How to Make Money in Stocks: A Winning System in Good Times and Bad.
It's one of my favorites.
In the past, I reviewed market outlook signals as if they were a mechanical trading system, while pointing out issues and making adjustments. The goal is to give you to give you an example of how to analyze and continuously improve your own systems.
- 2015 Performance - Stock Market Outlook
- 2016 Performance - Stock Market Outlook
- 2017 Performance - Stock Market Outlook
- 2018 Performance - Stock Market Outlook
- 2019 Performance - Stock Market Outlook
- 2020 Performance - Stock Market Outlook
For historical Elliott Wave commentary and analysis, go to ELLIOTT WAVE lives on by Tony Caldaro.
IMPORTANT DISCLOSURE INFORMATION
This material is for general communication and is provided for informational and/or educational purposes only. None of the content should be viewed as a suggestion that you take or refrain from taking any action nor as a recommendation for any specific investment product, strategy, or other such purpose. Certain information contained herein has been obtained from third-party sources believed to be reliable, but we cannot guarantee its accuracy or completeness.
To the extent that a reader has any questions regarding the applicability of any specific issue discussed above to his/her individual situation, he/she is encouraged to consult with the professional advisors of his/her choosing. Invest Safely, LLC is not a law firm, certified public accounting firm, or registered investment advisor and no portion of its content should be construed as legal, accounting, or investment advice.
The material is not to be construed as an offer or a recommendation to buy or sell a security nor is it to be construed as investment advice. Additionally, the material accessible through this website does not constitute a representation that the investments described herein are suitable or appropriate for any person.
Hypothetical Presentations:
Any referenced performance is “as calculated” using the referenced funds and has not been independently verified. This presentation does not discuss, directly or indirectly, the amount of the profits or losses, realized or unrealized, by any reader or contributor, from any specific funds or securities.
The author and/or any reader may have experienced materially different performance based upon various factors during the corresponding time periods. To the extent that any portion of the content reflects hypothetical results that were achieved by means of the retroactive application of a back-tested model, such results have inherent limitations, including:
Model results do not reflect the results of actual trading using assets, but were achieved by means of the retroactive application of the referenced models, certain aspects of which may have been designed with the benefit of hindsight
Back-tested performance may not reflect the impact that any material market or economic factors might have had on the use of a trading model if the model had been used during the period to actually manage assets
Actual investment results during the corresponding time periods may have been materially different from those portrayed in the model
Past performance may not be indicative of future results. Therefore, no one should assume that future performance will be profitable, or equal to any corresponding historical index.
The S&P 500 Composite Total Return Index (the "S&P") is a market capitalization-weighted index of 500 widely held stocks often used as a proxy for the stock market. Standard & Poor's chooses the member companies for the S&P based on market size, liquidity, and industry group representation. Included are the common stocks of industrial, financial, utility, and transportation companies. The S&P is not an index into which an investor can directly invest. The historical S&P performance results (and those of all other indices) are provided exclusively for comparison purposes only, so as to provide general comparative information to assist an individual in determining whether the performance of a specific portfolio or model meets, or continues to meet investment objective(s). The model and indices performance results do not reflect the impact of taxes.
Investing involves risk (even the “safe” kind)! Past performance does not guarantee or indicate future results. Different types of investments involve varying degrees of underlying risk. Therefore, do not assume that future performance of any specific investment or investment strategy be suitable for your portfolio or individual situation, will be profitable, equal any historical performance level(s), or prove successful (including the investments and/or investment strategies describe on this site).
Investing Process Links
Stabilize- Organize your $$$
- Manage your $$$
Plan
- Why You Invest
- Ways to Invest
- Where to Invest
- What to Invest In
Execute
- When to Invest
- How Much to Invest
- Buying & Selling
Monitor
- Track The Market
- Track Your Returns
Reflect & Adjust
- Improve Your Returns
- Adjust your Holdings
Popular Pages
- Jim Cramer- Personal Incomes Statements
- Hyperinflation
- Calculating Beta
- SMART Financial Goals
Blogroll
- Advisor Perspectives- Dividend Growth Investor
- Elliott Wave Lives On
- On My Radar | CMG Wealth
- Sure Dividend
- The Big Picture
- The Fat Pitch
- Thoughts from the Frontline
- Trader Feed
Sponsored Links
Invest Safely provides valuable, time-saving info about personal finance, money management, and investing.


