No-Advice Disclaimer: This analysis is for informational purposes only and not a recommendation to buy or sell any security.
Stock Market Outlook: April 19th =
Uptrend
Author: J.Wenger ---- Published: April 19, 2026 ---- Last Updated: 2026-04-19
Disclosure: The author holds no material positions in the securities mentioned. See Editorial Policy & Disclosures for details.
Bitcoin, Emerging Markets, Technology and High Beta names led assets higher, while Oil, Energy, and Low Beta underperformed. CTAs reversed their recent short positioning, pushing equity prices higher as West Asia headlines took down oil and energy.
TREND ANALYSIS
The S&P500 ( $SPX ) rose 4.8% last week, rallying further from September lows and reclaiming widely followed moving averages. The index is now:- ~5% above the 50-day moving average
- ~7% above the 200-day moving average
- Average Directional Index: Bullish
- Directional indicators crossed on Monday .
- Institutional Activity: Bullish
- No change; trading volume remains subdued
- On-Balance Volume: Bullish
- Back above the long-term average
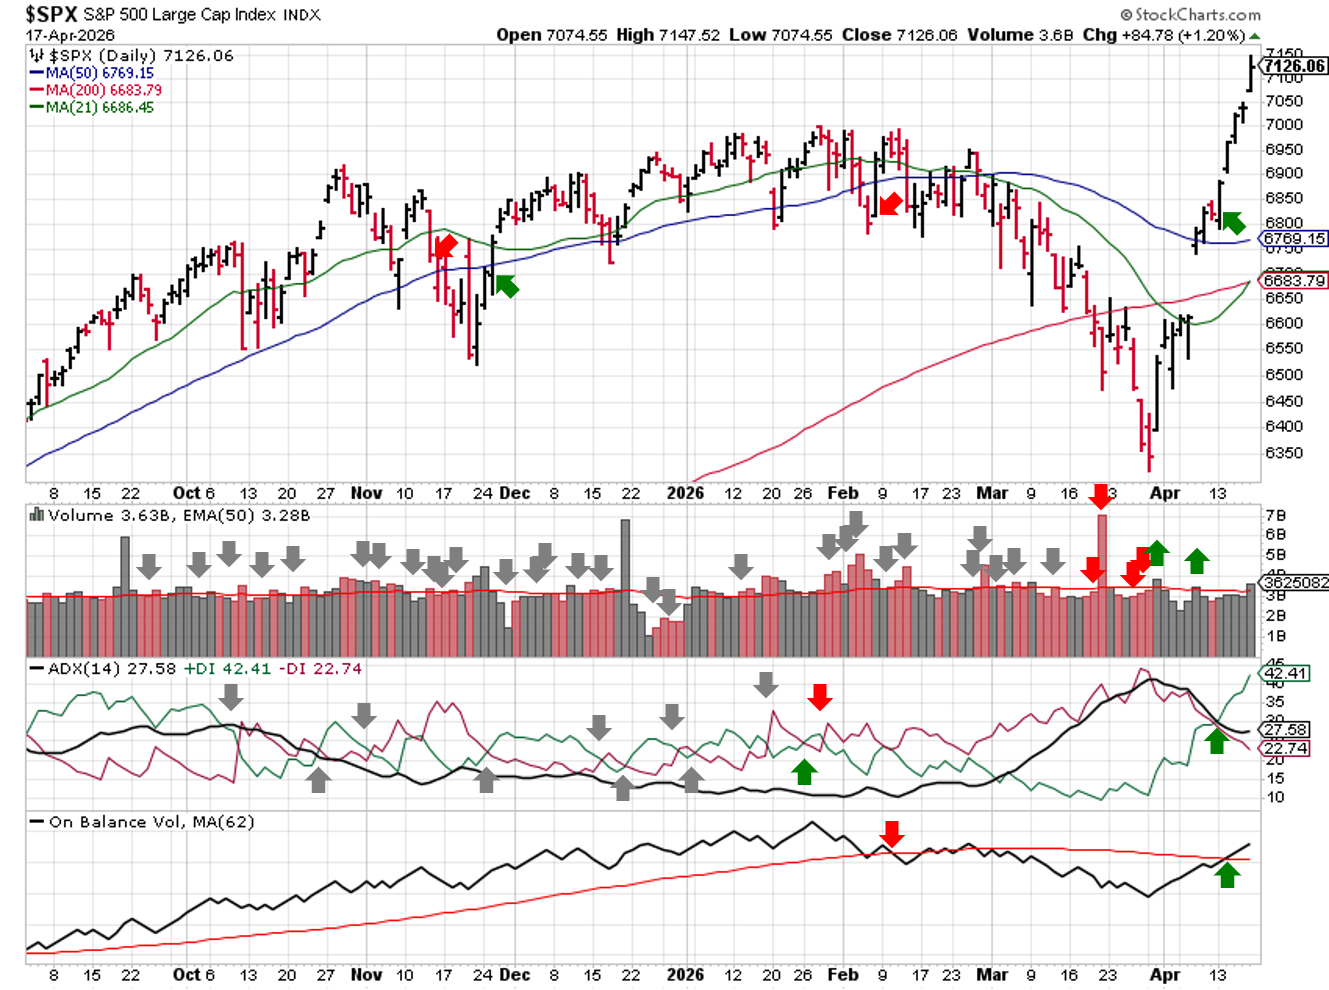
Technical Analysis – $SPX – 2026-04-19
PERFORMANCE HIGHLIGHTS & COMPARISONS
Asset Classes
Bitcoin ( $IBIT ) led assets higher again last week, but Emerging Market Equities were a close second ( $EEM ). Oil ( $USO ) fell on West Asia headlines ( more commentary in the Geopolitics section ), but is still up more than 50% since moving to bullish bias. Bitcoin, Developed Market and Emerging Market Bonds ( $IBIT, $BNDX, $PCY ) regained bullish bias.
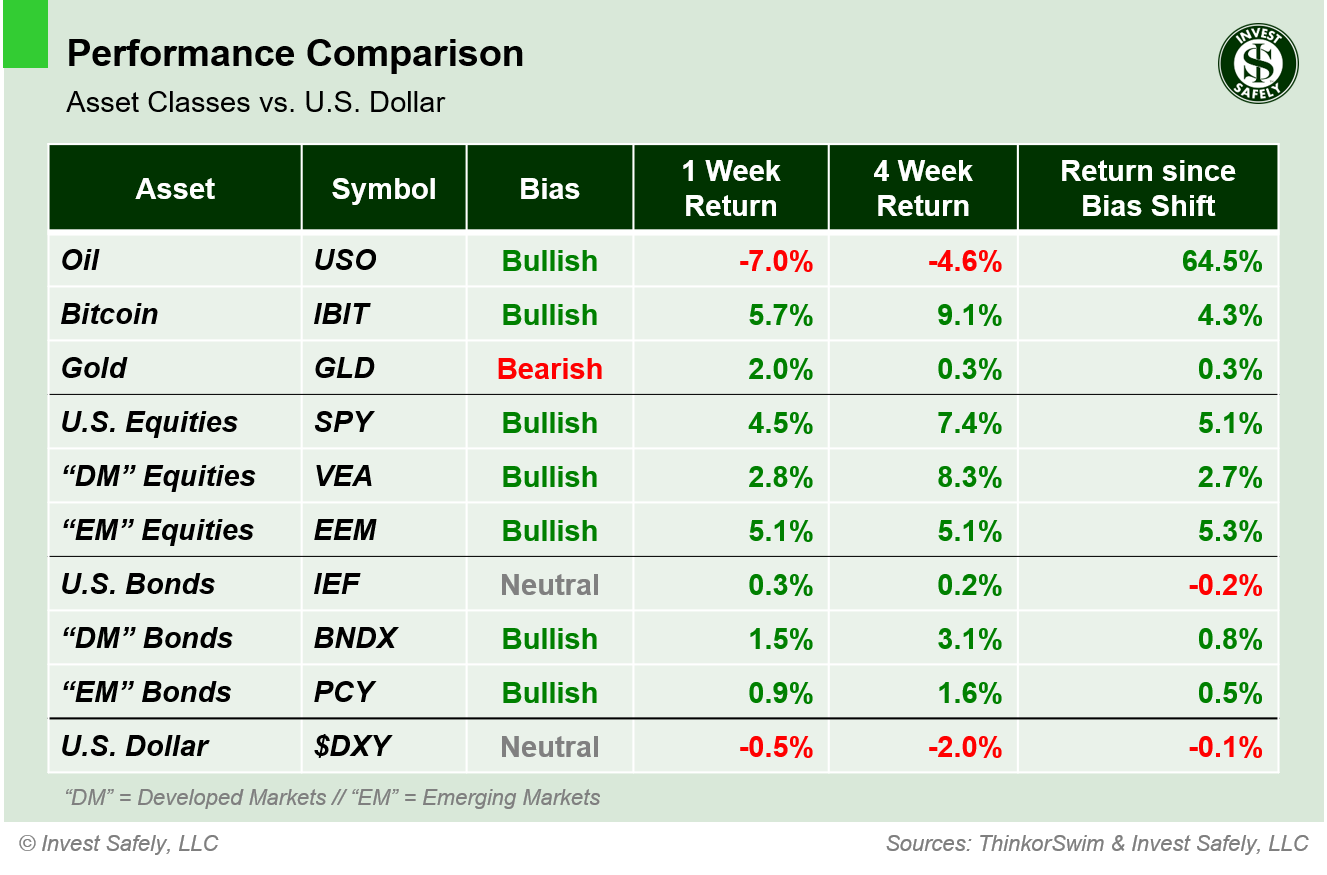
Asset Class Performance vs. U.S. Dollar – 2026-04-19
S&P500 Sectors
Same situation as the last review: Technology ( $XLK ) outperformed and Energy ( $XLE ) sold off. Communications, Consumer Discretionary, and Financials ( $XLC, $XLY, $XLF) reclaimed bullish bias, and Energy ( $XLE ) dropped to bearish.
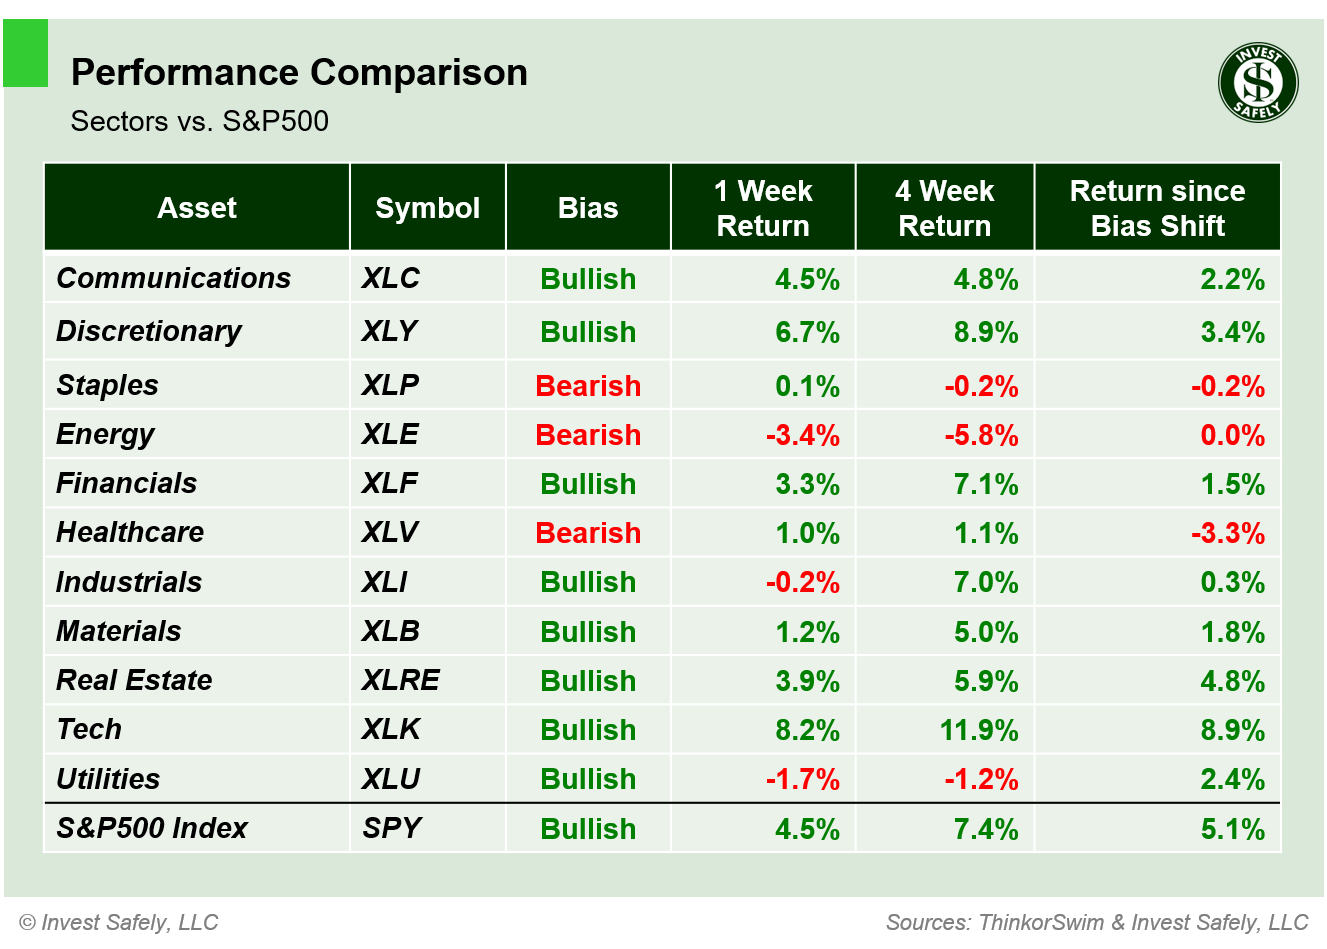
S&P500 Sector Performance – 2026-04-19
S&P500 Investing Styles
All sector styles were higher last week. High Beta ( $SPHB ) led to the upside, while Low Beta ( $SPLV ) brought up the rear. High Dividend ( $SPHD ) was the worst performer and came in flat. Small Cap and Large Cap growth, along with Quality, got back to bullish bias ( $IWO, $IWF, $QUAL ).
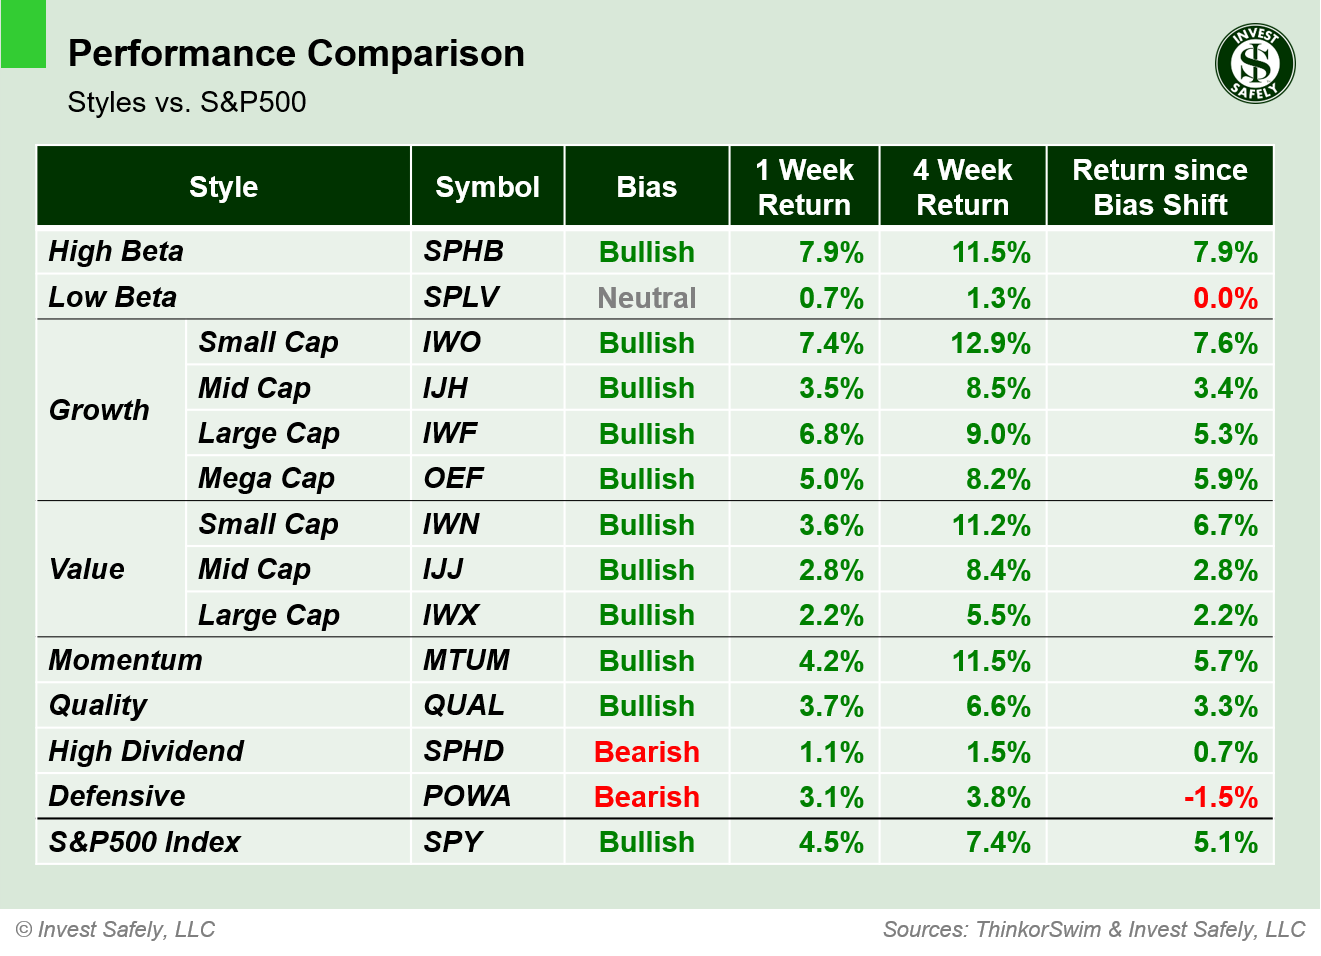
Style Performance vs. S&P500 – 2026-04-19
COMMENTARY
Markets
We've all just experienced a historic run in U.S. equities. The SPX rallied almost 11% in over 11 trading sessions, reversing the correction and moving back to all-time highs. The index has never moved from correction territory to new all time highs that quickly. Not to mention the Nasdaq's 13 session win streak, which is the longest since 2009.Per Goldman Sachs:
The last five sessions have garnered one of "the largest in history" trading demand from CTAs ( Commodity Trading Advisors ), or hedge funds that ride market trends. - Reported by ReutersCTA's were net short U.S. equities as crease-fire and Hormuz rumors began to circulate. So they were offside of any relief rally and needed to reverse course ( probably long oil too, but that's just me making an educated guess ).
During rallies, buyers are typically price insensitive; they buy because they want to get in, regardless of price. During sell-offs, sellers are insensitive; they sell because they want to get out, regardless of price.
The theory is that the CTAs got squeezed, with market participants only willing to sell at higher prices ( i.e. where we are now ) due to expectations an end to hostilities in West Asia. You might think that all that buying would manifest as higher trading volume for the index, but that didn't happen. Despite the large level of CTA buying, other participants were less enthusiastic.
Earnings season kicked off with good showings from major banks, thanks largely to higher interest rates and fees.
Macroeconomic Data and Policy
Inflation remains an issue. March Producer Price index came in at +4.0% y/y, 80 basis points higher than this time last year. Core PPI came in at +3.8% y/y, which is flat versus 2025.
Geopolitics
Despite its uncertain nature, the West Asia ceasefire narrative continues to move global asset prices. High-level peace talks in Islamabad ended without a long-term agreement on April 13th, but equities and commodities responded to Hormuz-related headlines: closures, blockades, re-openings and everything in between. As of this post, the strait is closed again, and there are rumors of a seized Iranian ship.
EYES ON THE HORIZON
Earnings reports pick up steam this week. The income Chairman of the Federal Reserve testifies before the Senate Committee on Banking, Housing, and Urban Affairs on Tuesday, giving observers a taste of his upcoming tenure.- Monday: --
- Tuesday: Retail Sales, Fed Chair-Designate Warsh Testifies
- Wednesday: --
- Thursday: Flash PMIs
- Friday: Revised Consumer Sentiment
Best to Your Week!
P.S. If you find this research helpful, please tell a friend.
If you don't, tell an enemy.
Share this post on social media:
Facebook (@InvestSafely)
X / Twitter (@investsafely)
LinkedIn (@Invest-Safely)
Instagram (@investsafely)
Content Sources: Bloomberg, CNBC, Federal Reserve Bank of St. Louis (FRED), Hedgeye, StockCharts.com, TradingEconomics.com, U.S. Bureau of Economic Analysis, U.S. Bureau of Labor Statistics.
Price and Volume charts provided courtesy of stockcharts.com.
Performance Methodology: All sector performance data is sourced from ThinkorSwim and reflects price‑only returns calculated using end‑of‑week closing data. Bias classifications follow a proprietary Invest Safely, LLC model and update only when trend conditions meet predefined thresholds. All calculations are consistent across every chart on this page.
Disclaimer: Invest Safely, LLC is an independent investment research and online financial media company. Use of Invest Safely, LLC and any products available through Invest‑Safely.com is subject to our Terms of Service and Privacy Policy.
Not a recommendation to buy or sell any security.
Looking for more information on the Stock Market Outlook Signals? You'll find it here:
 If you're interested in learning more about the relationship between price and volume, or how to find and trade the best stocks for your growth strategy, check out this book via the following Amazon affiliate link:
How to Make Money in Stocks: A Winning System in Good Times and Bad.
It's one of my favorites.
In the past, I reviewed market outlook signals as if they were a mechanical trading system, while pointing out issues and making adjustments. The goal is to give you to give you an example of how to analyze and continuously improve your own systems.
- 2015 Performance - Stock Market Outlook
- 2016 Performance - Stock Market Outlook
- 2017 Performance - Stock Market Outlook
- 2018 Performance - Stock Market Outlook
- 2019 Performance - Stock Market Outlook
- 2020 Performance - Stock Market Outlook
For historical Elliott Wave commentary and analysis, go to ELLIOTT WAVE lives on by Tony Caldaro.
IMPORTANT DISCLOSURE INFORMATION
This material is for general communication and is provided for informational and/or educational purposes only. None of the content should be viewed as a suggestion that you take or refrain from taking any action nor as a recommendation for any specific investment product, strategy, or other such purpose. Certain information contained herein has been obtained from third-party sources believed to be reliable, but we cannot guarantee its accuracy or completeness.
To the extent that a reader has any questions regarding the applicability of any specific issue discussed above to his/her individual situation, he/she is encouraged to consult with the professional advisors of his/her choosing. Invest Safely, LLC is not a law firm, certified public accounting firm, or registered investment advisor and no portion of its content should be construed as legal, accounting, or investment advice.
The material is not to be construed as an offer or a recommendation to buy or sell a security nor is it to be construed as investment advice. Additionally, the material accessible through this website does not constitute a representation that the investments described herein are suitable or appropriate for any person.
Hypothetical Presentations:
Any referenced performance is “as calculated” using the referenced funds and has not been independently verified. This presentation does not discuss, directly or indirectly, the amount of the profits or losses, realized or unrealized, by any reader or contributor, from any specific funds or securities.
The author and/or any reader may have experienced materially different performance based upon various factors during the corresponding time periods. To the extent that any portion of the content reflects hypothetical results that were achieved by means of the retroactive application of a back-tested model, such results have inherent limitations, including:
Model results do not reflect the results of actual trading using assets, but were achieved by means of the retroactive application of the referenced models, certain aspects of which may have been designed with the benefit of hindsight
Back-tested performance may not reflect the impact that any material market or economic factors might have had on the use of a trading model if the model had been used during the period to actually manage assets
Actual investment results during the corresponding time periods may have been materially different from those portrayed in the model
Past performance may not be indicative of future results. Therefore, no one should assume that future performance will be profitable, or equal to any corresponding historical index.
The S&P 500 Composite Total Return Index (the "S&P") is a market capitalization-weighted index of 500 widely held stocks often used as a proxy for the stock market. Standard & Poor's chooses the member companies for the S&P based on market size, liquidity, and industry group representation. Included are the common stocks of industrial, financial, utility, and transportation companies. The S&P is not an index into which an investor can directly invest. The historical S&P performance results (and those of all other indices) are provided exclusively for comparison purposes only, so as to provide general comparative information to assist an individual in determining whether the performance of a specific portfolio or model meets, or continues to meet investment objective(s). The model and indices performance results do not reflect the impact of taxes.
Investing involves risk (even the “safe” kind)! Past performance does not guarantee or indicate future results. Different types of investments involve varying degrees of underlying risk. Therefore, do not assume that future performance of any specific investment or investment strategy be suitable for your portfolio or individual situation, will be profitable, equal any historical performance level(s), or prove successful (including the investments and/or investment strategies describe on this site).
Investing Process Links
Stabilize- Organize your $$$
- Manage your $$$
Plan
- Why You Invest
- Ways to Invest
- Where to Invest
- What to Invest In
Execute
- When to Invest
- How Much to Invest
- Buying & Selling
Monitor
- Track The Market
- Track Your Returns
Reflect & Adjust
- Improve Your Returns
- Adjust your Holdings
Popular Pages
- Jim Cramer- Personal Incomes Statements
- Hyperinflation
- Calculating Beta
- SMART Financial Goals
Blogroll
- Advisor Perspectives- Dividend Growth Investor
- Elliott Wave Lives On
- On My Radar | CMG Wealth
- Sure Dividend
- The Big Picture
- The Fat Pitch
- Thoughts from the Frontline
- Trader Feed
Sponsored Links
Invest Safely provides valuable, time-saving info about personal finance, money management, and investing.


