No-Advice Disclaimer: This analysis is for informational purposes only and not a recommendation to buy or sell any security.
Stock Market Outlook: March 29th =
Downtrend
Author: J.Wenger ---- Published: March 29, 2026 ---- Last Updated: 2026-03-29
Disclosure: The author holds no material positions in the securities mentioned. See Editorial Policy & Disclosures for details.
Oil and Energy continue to outperform, and were joined by small cap value this week. Bitcoin, Communications, and Large Cap Growth underperformed. Mixed survey data and a downbeat consumer didn't do anything to combat uncertainty caused by the conflict in West Asia.
TREND ANALYSIS
The S&P500 ( $SPX ) dropped 2.1% last week, falling further below key moving averages. Th index is now:- ~7% below the 50-day moving average
- ~4% below the 200-day moving average
- Average Directional Index: Bearish
- A strong bearish trend is underway
- Institutional Activity: Bearish
- Price continues to drop below key moving averages on elevated volume
- On-Balance Volume: Bearish
- Remains below the long-term average
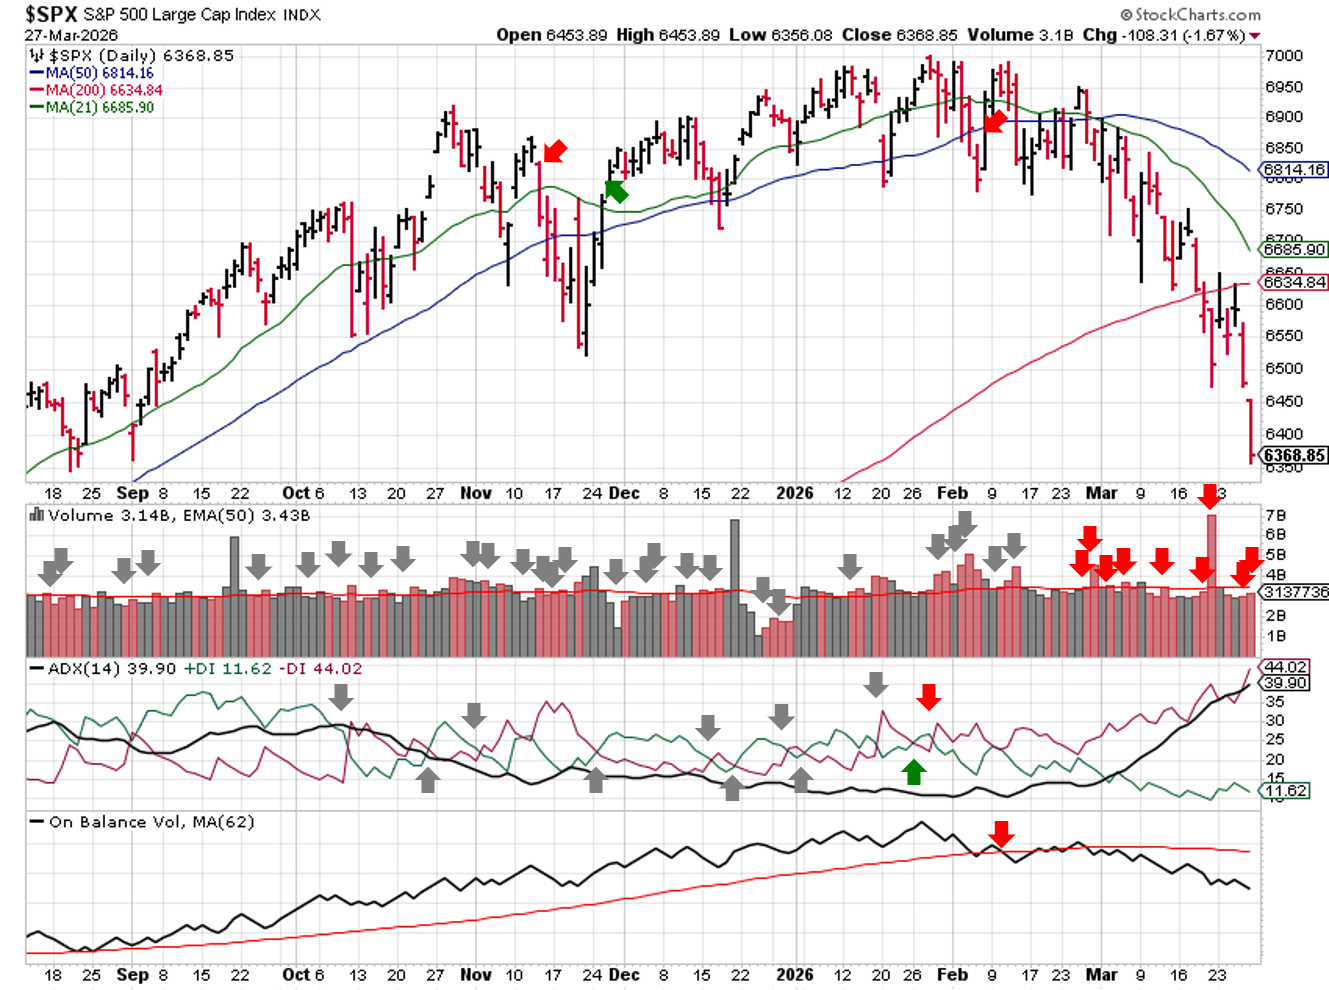
Technical Analysis – $SPX – 2026-03-29
PERFORMANCE HIGHLIGHTS & COMPARISONS
Asset Classes
Oil ( $USO ) continued its recent win streak in weekly performance, while Bitcoin lost the most ground. Only Oil and the U.S. dollar are bullish.
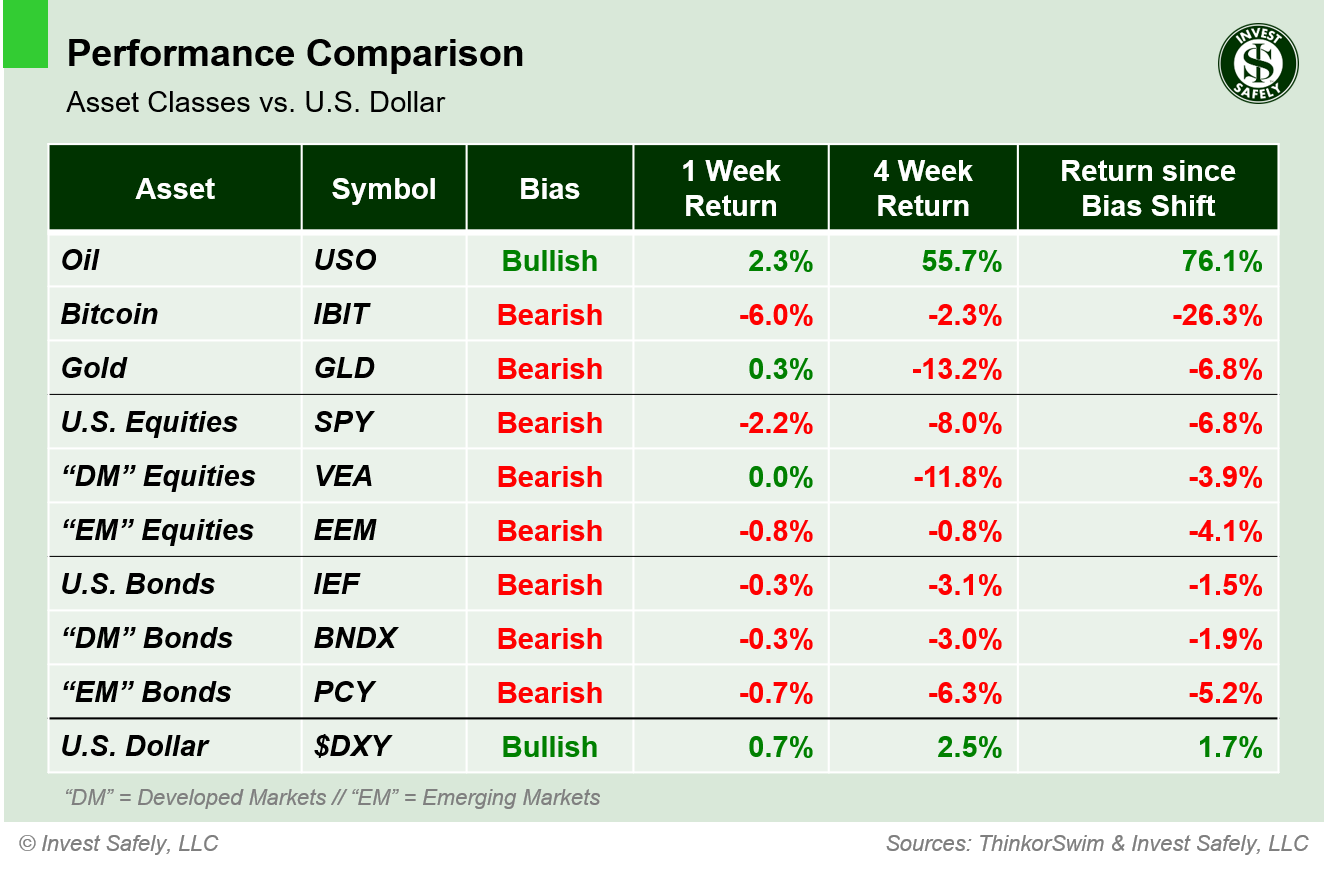
Asset Class Performance vs. U.S. Dollar – 2026-03-29
S&P500 Sectors
Thanks to the strength in Oil, Energy ( $XLE ) continues to resist the selloff, gaining over 5% last week despite the general market dropped more than 2%. Communications was the worst sector ( $XLC ), thanks in large part to declines by Alphabet and Meta ( $GOOGL & $META ). Utilities ( $XLU ) managed to regain bullish bias.
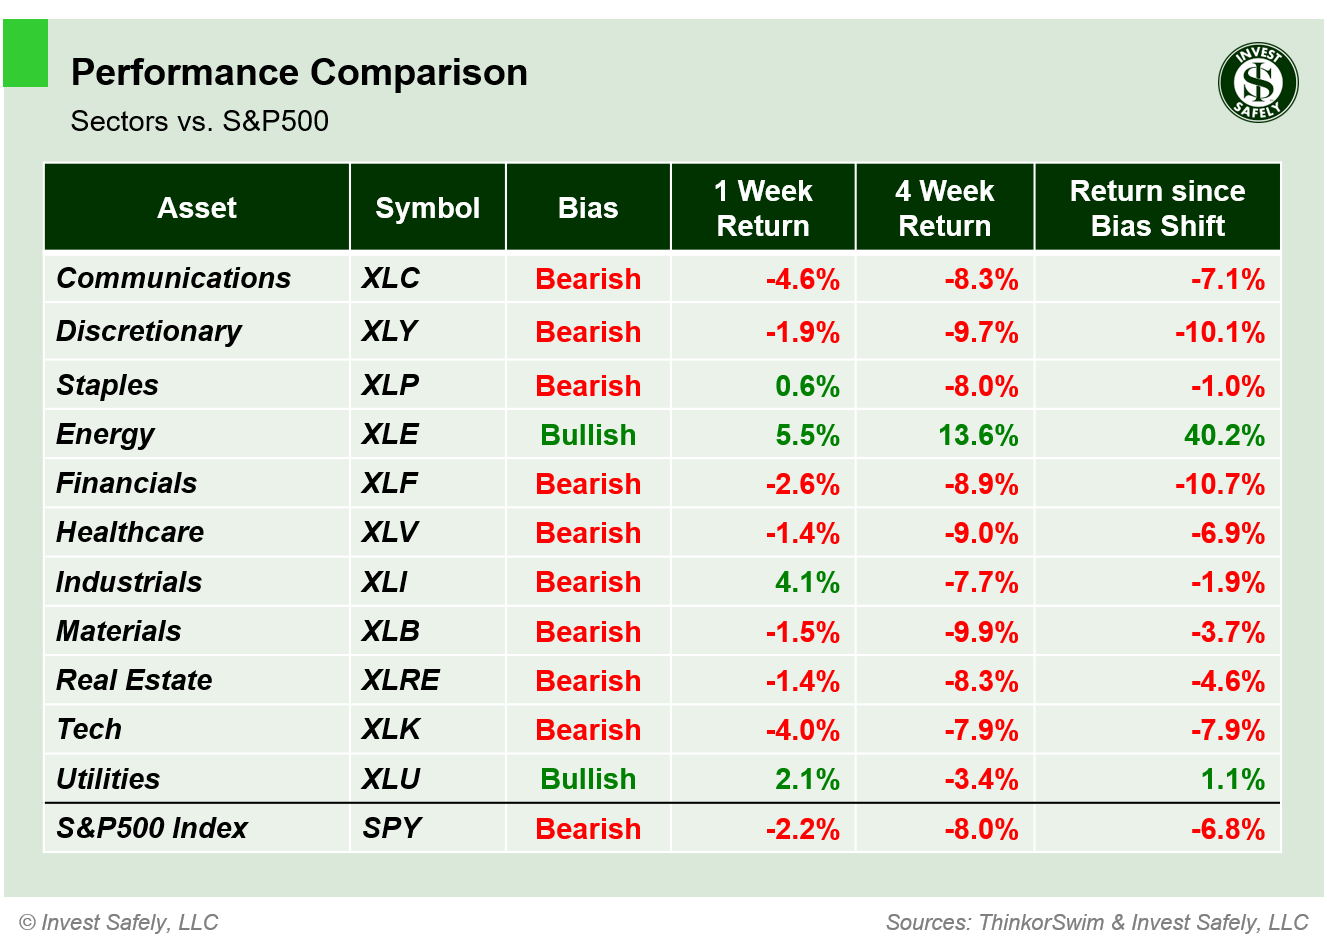
S&P500 Sector Performance – 2026-03-29
S&P500 Investing Styles
Small Cap and Mid Cap Value overperformed and Large Cap Growth underperformed. All sector styles are bearish.
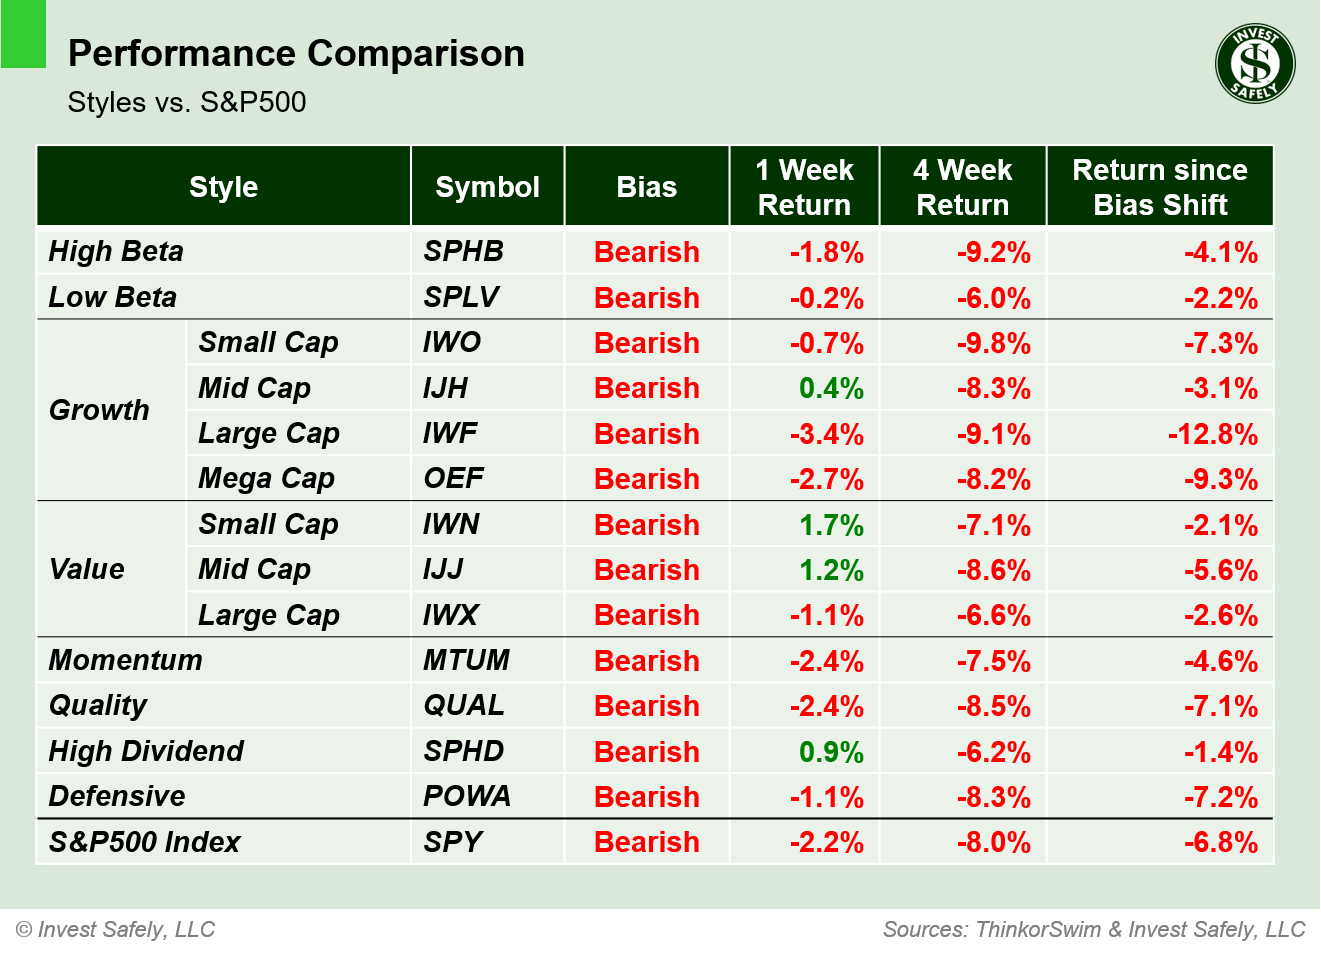
Style Performance vs. S&P500 – 2026-03-29
COMMENTARY
Markets
The Volatility Index ( $VIX ) is back on the rise and looks destined to close above 30. Bond volatility ( $MOVE ), remains above 110. Both continue to signal markets under stress. While many areas in the equities and bonds are oversold verses most traditional technical indicators, markets also tend to crash from oversold levels when volatility is elevated like it is right now.No need to try and pick a bottom. Adding to positions when they're below the 200 day moving average is usually a good bet for long-term investors, but the inflationary shock from oil prices has yet to be absorbed. Wait for prices to re-establish themselves in bullish bias, or at least get back above key moving averages. The focus on sectors, styles, and industry groups that are showing the most strength.
Macroeconomic Data and Policy
Manufacturing PMI climbed to 52.4 in March 2026, up substantially from last year. Other the flip side, Services PMI fell to 51.1, down significantly from last year. Since services has become a larger percentage of the overall economy, this divergence does not bode well for economic growth.Consumer Sentiment fell year over year, for all age groups and political affiliations. Households with middle and higher incomes, as well as those with significant investments, experienced the steepest drops in confidence.
Geopolitics
Shipping disruptions continue in the Strait of Hormuz, which directly impacts the price of oil and indirectly impacts the price of almost everything else, from diesel fuel and shipping costs, to synthetic fibers for clothing, to detergents and fertilizers...let along plastic.President Trump postponed further U.S. attacks on Iranian energy grids to provide a window for "negotiations", but its not clear who is negotiating with whom at this point. In the meantime, strikes and counterstrikes continue across the region.
EYES ON THE HORIZON
Next week the markets are closed for Good Friday, though NFP data will still be released. We'll get several updates on employment, as well we a speech from Fed Chair Powell and the latest ISM Manufacturing survey data.- Monday: Powell Speech
- Tuesday: JOLTS
- Wednesday: ADP non-farm payrolls, Retail Sales, ISM Manufacturing
- Thursday: --
- Friday: Markets Closed, Non-Farm Payrolls
Best to Your Week!
P.S. If you find this research helpful, please tell a friend.
If you don't, tell an enemy.
Share this post on social media:
Facebook (@InvestSafely)
X / Twitter (@investsafely)
LinkedIn (@Invest-Safely)
Instagram (@investsafely)
Content Sources: Bloomberg, CNBC, Federal Reserve Bank of St. Louis (FRED), Hedgeye, StockCharts.com, TradingEconomics.com, U.S. Bureau of Economic Analysis, U.S. Bureau of Labor Statistics.
Price and Volume charts provided courtesy of stockcharts.com.
Performance Methodology: All sector performance data is sourced from ThinkorSwim and reflects price‑only returns calculated using end‑of‑week closing data. Bias classifications follow a proprietary Invest Safely, LLC model and update only when trend conditions meet predefined thresholds. All calculations are consistent across every chart on this page.
Disclaimer: Invest Safely, LLC is an independent investment research and online financial media company. Use of Invest Safely, LLC and any products available through Invest‑Safely.com is subject to our Terms of Service and Privacy Policy.
Not a recommendation to buy or sell any security.
Looking for more information on the Stock Market Outlook Signals? You'll find it here:
 If you're interested in learning more about the relationship between price and volume, or how to find and trade the best stocks for your growth strategy, check out this book via the following Amazon affiliate link:
How to Make Money in Stocks: A Winning System in Good Times and Bad.
It's one of my favorites.
In the past, I reviewed market outlook signals as if they were a mechanical trading system, while pointing out issues and making adjustments. The goal is to give you to give you an example of how to analyze and continuously improve your own systems.
- 2015 Performance - Stock Market Outlook
- 2016 Performance - Stock Market Outlook
- 2017 Performance - Stock Market Outlook
- 2018 Performance - Stock Market Outlook
- 2019 Performance - Stock Market Outlook
- 2020 Performance - Stock Market Outlook
For historical Elliott Wave commentary and analysis, go to ELLIOTT WAVE lives on by Tony Caldaro.
IMPORTANT DISCLOSURE INFORMATION
This material is for general communication and is provided for informational and/or educational purposes only. None of the content should be viewed as a suggestion that you take or refrain from taking any action nor as a recommendation for any specific investment product, strategy, or other such purpose. Certain information contained herein has been obtained from third-party sources believed to be reliable, but we cannot guarantee its accuracy or completeness.
To the extent that a reader has any questions regarding the applicability of any specific issue discussed above to his/her individual situation, he/she is encouraged to consult with the professional advisors of his/her choosing. Invest Safely, LLC is not a law firm, certified public accounting firm, or registered investment advisor and no portion of its content should be construed as legal, accounting, or investment advice.
The material is not to be construed as an offer or a recommendation to buy or sell a security nor is it to be construed as investment advice. Additionally, the material accessible through this website does not constitute a representation that the investments described herein are suitable or appropriate for any person.
Hypothetical Presentations:
Any referenced performance is “as calculated” using the referenced funds and has not been independently verified. This presentation does not discuss, directly or indirectly, the amount of the profits or losses, realized or unrealized, by any reader or contributor, from any specific funds or securities.
The author and/or any reader may have experienced materially different performance based upon various factors during the corresponding time periods. To the extent that any portion of the content reflects hypothetical results that were achieved by means of the retroactive application of a back-tested model, such results have inherent limitations, including:
Model results do not reflect the results of actual trading using assets, but were achieved by means of the retroactive application of the referenced models, certain aspects of which may have been designed with the benefit of hindsight
Back-tested performance may not reflect the impact that any material market or economic factors might have had on the use of a trading model if the model had been used during the period to actually manage assets
Actual investment results during the corresponding time periods may have been materially different from those portrayed in the model
Past performance may not be indicative of future results. Therefore, no one should assume that future performance will be profitable, or equal to any corresponding historical index.
The S&P 500 Composite Total Return Index (the "S&P") is a market capitalization-weighted index of 500 widely held stocks often used as a proxy for the stock market. Standard & Poor's chooses the member companies for the S&P based on market size, liquidity, and industry group representation. Included are the common stocks of industrial, financial, utility, and transportation companies. The S&P is not an index into which an investor can directly invest. The historical S&P performance results (and those of all other indices) are provided exclusively for comparison purposes only, so as to provide general comparative information to assist an individual in determining whether the performance of a specific portfolio or model meets, or continues to meet investment objective(s). The model and indices performance results do not reflect the impact of taxes.
Investing involves risk (even the “safe” kind)! Past performance does not guarantee or indicate future results. Different types of investments involve varying degrees of underlying risk. Therefore, do not assume that future performance of any specific investment or investment strategy be suitable for your portfolio or individual situation, will be profitable, equal any historical performance level(s), or prove successful (including the investments and/or investment strategies describe on this site).
Investing Process Links
Stabilize- Organize your $$$
- Manage your $$$
Plan
- Why You Invest
- Ways to Invest
- Where to Invest
- What to Invest In
Execute
- When to Invest
- How Much to Invest
- Buying & Selling
Monitor
- Track The Market
- Track Your Returns
Reflect & Adjust
- Improve Your Returns
- Adjust your Holdings
Popular Pages
- Jim Cramer- Personal Incomes Statements
- Hyperinflation
- Calculating Beta
- SMART Financial Goals
Blogroll
- Advisor Perspectives- Dividend Growth Investor
- Elliott Wave Lives On
- On My Radar | CMG Wealth
- Sure Dividend
- The Big Picture
- The Fat Pitch
- Thoughts from the Frontline
- Trader Feed
Sponsored Links
Invest Safely provides valuable, time-saving info about personal finance, money management, and investing.


