No-Advice Disclaimer: This analysis is for informational purposes only and not a recommendation to buy or sell any security.
Stock Market Outlook: March 8th =
Downtrend
Author: J.Wenger ---- Published: March 08, 2026 ---- Last Updated: 2026-03-08
Disclosure: The author holds no material positions in the securities mentioned. See Editorial Policy & Disclosures for details.
Oil and Energy outperformed; Emerging Markets, Industrials, and Value Styles underperformed. Volatility ramped across asset classes and NFP data surprised to the downside.
TREND ANALYSIS
The S&P500 ( $SPX ) dropped 2% last week:- ~2.5% below the 50-day moving average
- ~2.5% above the 200-day moving average
- Average Directional Index: Bearish
- The base ADX number is on the rise, signaling a strengthening trend
- Institutional Activity: Bearish
- Price fell further below the 50-day moving average
- On-Balance Volume: Bearish
- Remains below the long-term average
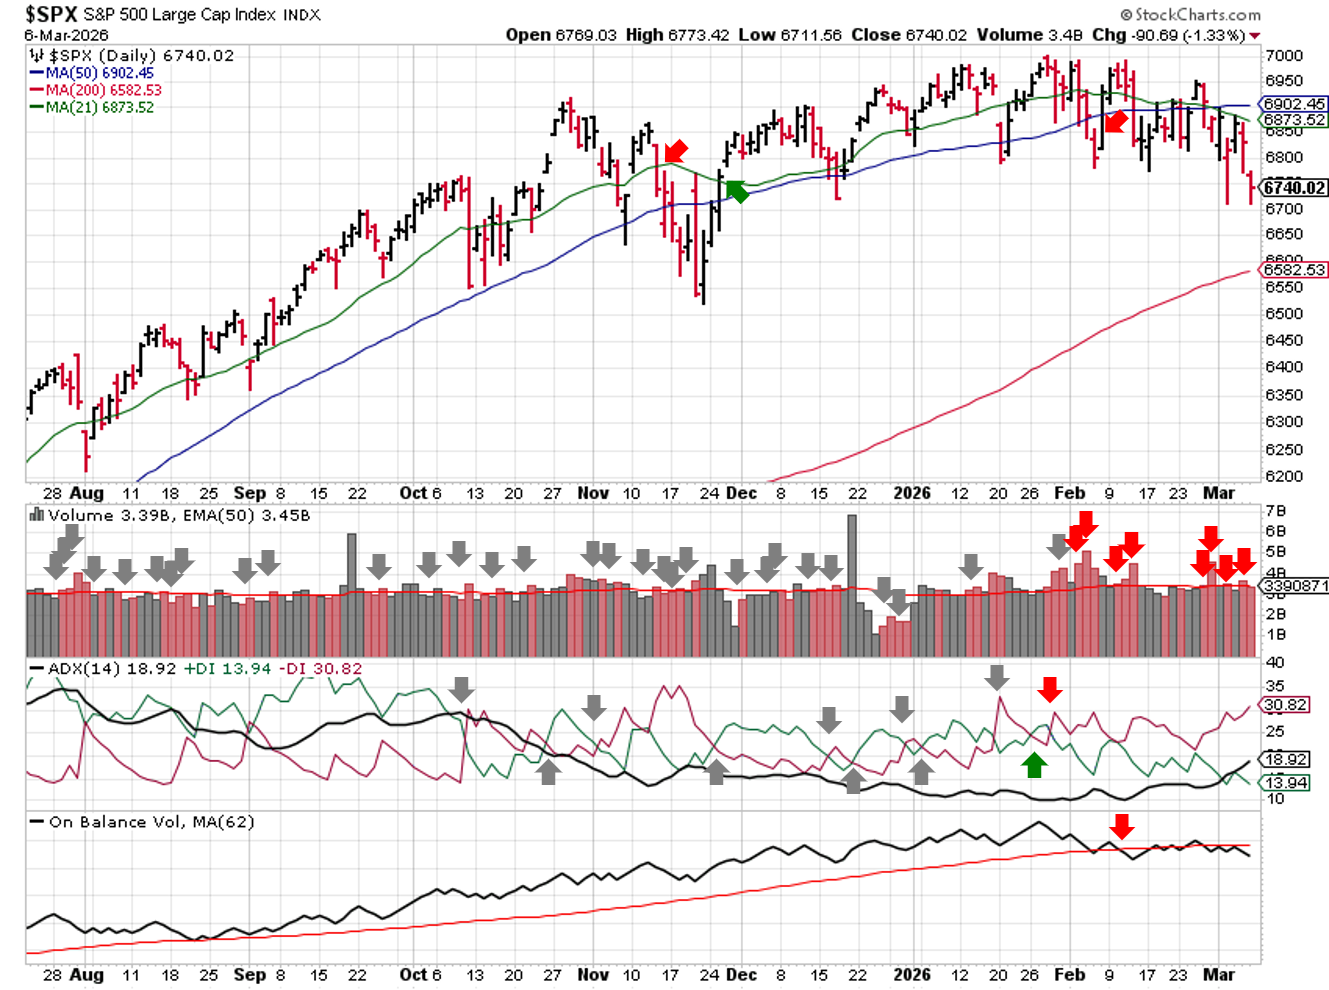
Technical Analysis – $SPX – 2026-03-08
PERFORMANCE HIGHLIGHTS & COMPARISONS
Asset Classes
Oil ( $USO ) rocketed higher last week, gaining ~33%. Yes, you read that right...not a typo. Emerging Market Equities ( $EEM ) led to the downside, losing more than 8%. Emerging Market Equities and Bonds ( $EEM, $PCY ) moved to bearish bias, Development Market Equities ( $VEA ) to Neutral, and the U.S. dollar ( $DXY ) to bullish.
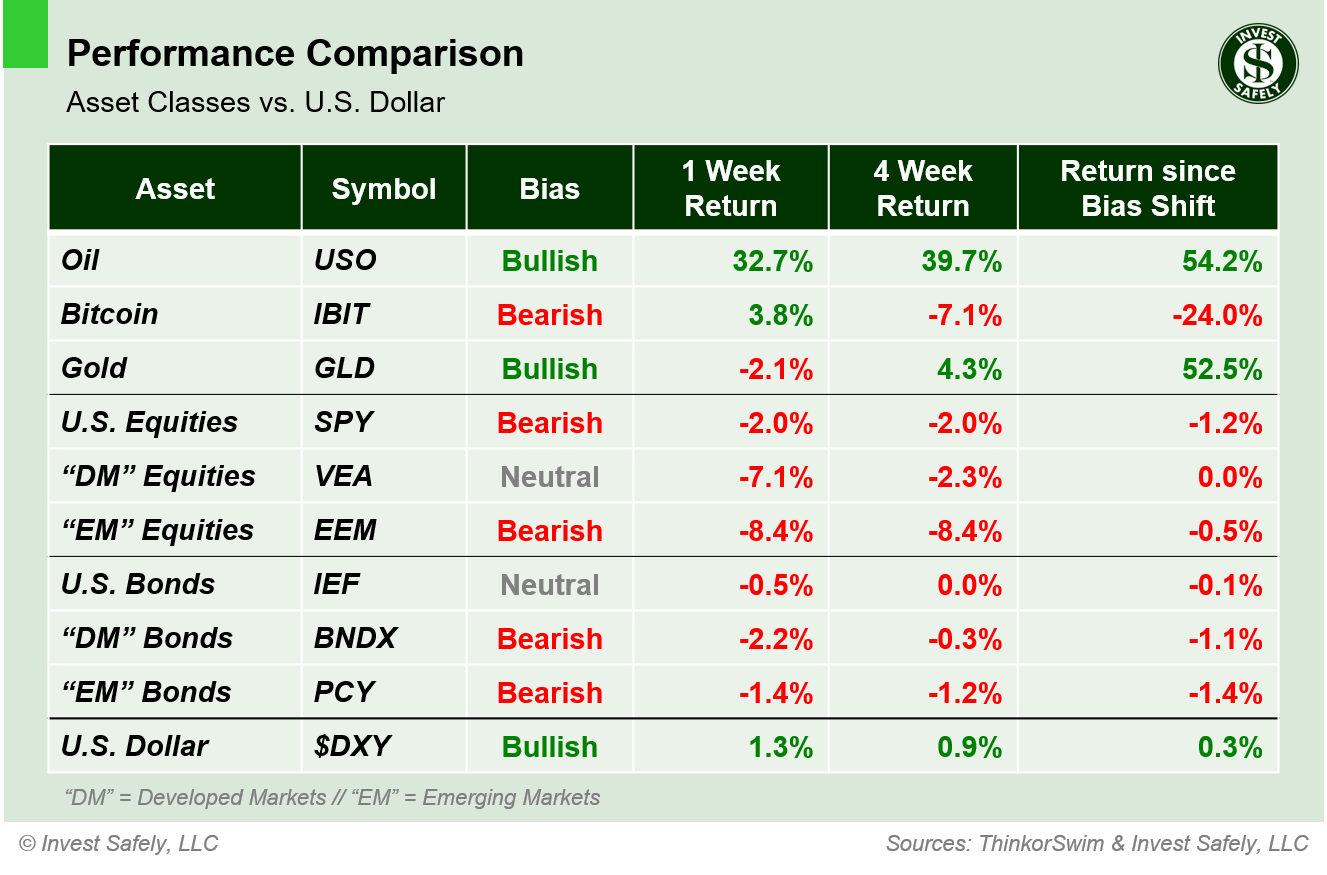
Asset Class Performance vs. U.S. Dollar – 2026-03-08
S&P500 Sectors
Energy ( $XLE ) was the lone gainer; Industrials ( $XLI ) led to the downside. Healthcare ( $XLV ) moved to bearish, Industrials to neutral.
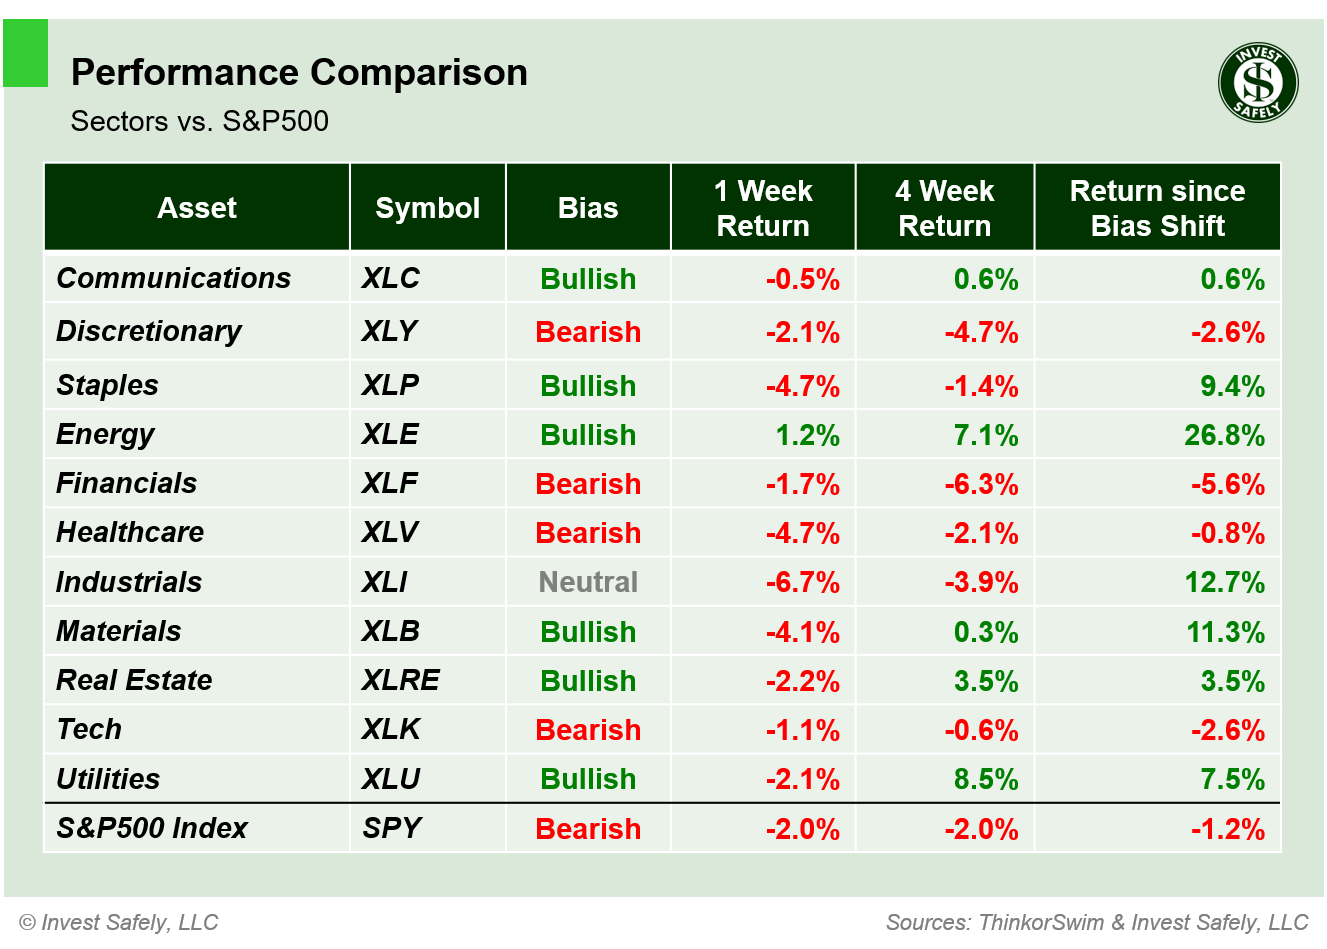
S&P500 Sector Performance – 2026-03-08
S&P500 Investing Styles
Investors fled all style factors last week. Large Cap Growth outperformed by falling less than 1%. Mid Cap Growth ( $IJH ) fell the most, although it had plenty of company ( $IWO, $IJJ, $MTUM ).High Beta, Small Cap Growth & Value, Mid-Cap Growth & Value, Momentum , Quality, and Defensives ( $SPHB, $IWO, $IWN, $IJH, $IJJ, $MTUM, $QUAL, $POWA ) all dropped to bearish bias. Large Cap Value moved to neutral.
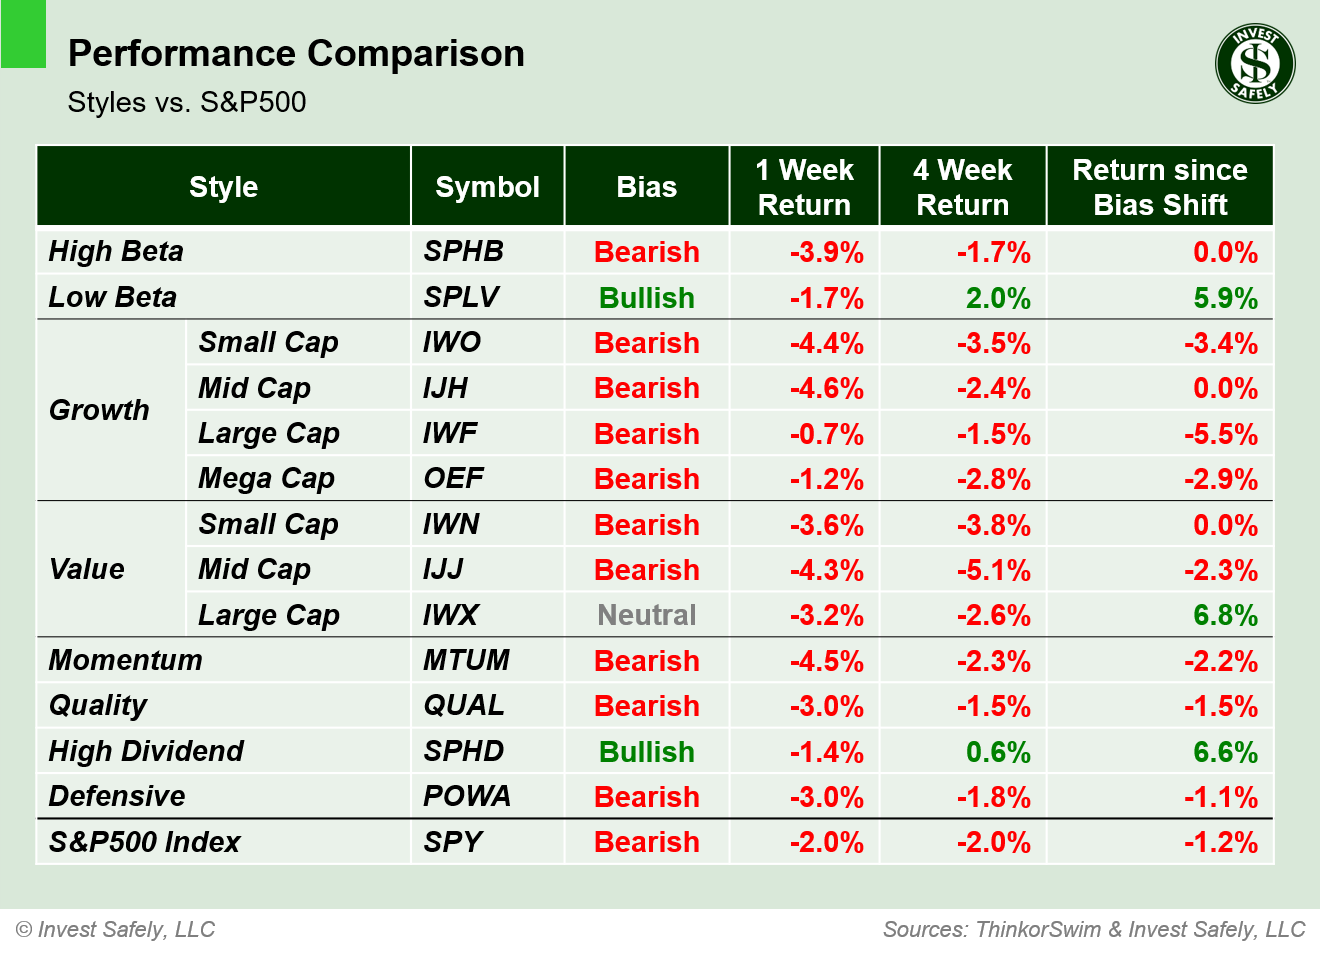
Style Performance vs. S&P500 – 2026-03-08
COMMENTARY
Markets
The S&P500's Volatility Index ( $VIX ) ramped higher last week, hitting 29.9 on Friday. Equities are essentially "uninvestable" when the reading is above 29; that level signals a high probability of large price swings...particularly the negative kind. Both the Nasdaq and Russell 2000 volatility readings ended the week above 30 as well.When equity markets enter a sell off or a downtrend with accelerating volatility, the entire asset class gets impacted. Small Caps & Large Caps, Growth & Value, Technology & Consumer Staples, Emerging & Developed Markets; they're all just different flavors of equities. So it's no surprise that we encountered a broad sell-off last week, negatively impacting all sectors and styles. Energy was the only "winner", but even that performance required a +30% rally in Oil.
Speaking of oil; what a move! Up ~13% on Friday alone. The commodity also experience a massive move in volatility, reaching levels on par with the COVID crisis, as price responded to news out of West Asia ( more below ).
Treasury yields also rallied off of lows last week, sending bond funds lower.
Given the broad rise in volatility, it's reasonable to expect large price moves to the downside next week. Many institutional trading methodologies mechanically adjust holdings at pre-defined volatility levels. The speed of the moves will boil down to urgency; can positions be shopped around in an orderly fashion, or do they have to be liquidated immediately ( e.g. margin call ).
For individual investors, it's still the game of minimizing holdings with bearish bias ( capital preservation ) and managing positions ( trimming at overbought, adding at oversold ) that are bullish.
Macroeconomic Data and Policy
Manufacturing and Services PMI surveys showed increased activity year over year, but also showed a high level of ongoing pricing pressure.On Wednesday, ADP employment data showed 63k jobs were added in February 2026. On Friday, Non-Farm Payrolls showed a loss of 92k jobs during the same period, well below expectations for a gain of 59k.
Retail Sales decreased for the month of January, but beat expectations and were actually higher year over year.
Geopolitics
Hostilities in Western Asia continue to roil global markets, particularly oil and gas. Threats to ships traversing the Strait of Hormuz led several nations ( UAE, Iraq, Kuwait ) to reduce their oil production after running out of storage space. Saudi Arabia and Qatar halted refinery activity after experiencing drone attacks.
EYES ON THE HORIZON
Next week is a bit light on the news front; several Fed members speak and PPI comes out Friday.- Monday: --
- Tuesday: --
- Wednesday: CPI
- Thursday: --
- Friday: PCE, Q4 GDP ( 2nd Revision ), JOLTS
Best to Your Week!
P.S. If you find this research helpful, please tell a friend.
If you don't, tell an enemy.
Share this post on social media:
Facebook (@InvestSafely)
X / Twitter (@investsafely)
LinkedIn (@Invest-Safely)
Instagram (@investsafely)
Content Sources: Bloomberg, CNBC, Federal Reserve Bank of St. Louis (FRED), Hedgeye, StockCharts.com, TradingEconomics.com, U.S. Bureau of Economic Analysis, U.S. Bureau of Labor Statistics.
Price and Volume charts provided courtesy of stockcharts.com.
Performance Methodology: All sector performance data is sourced from ThinkorSwim and reflects price‑only returns calculated using end‑of‑week closing data. Bias classifications follow a proprietary Invest Safely, LLC model and update only when trend conditions meet predefined thresholds. All calculations are consistent across every chart on this page.
Disclaimer: Invest Safely, LLC is an independent investment research and online financial media company. Use of Invest Safely, LLC and any products available through Invest‑Safely.com is subject to our Terms of Service and Privacy Policy.
Not a recommendation to buy or sell any security.
Looking for more information on the Stock Market Outlook Signals? You'll find it here:
 If you're interested in learning more about the relationship between price and volume, or how to find and trade the best stocks for your growth strategy, check out this book via the following Amazon affiliate link:
How to Make Money in Stocks: A Winning System in Good Times and Bad.
It's one of my favorites.
In the past, I reviewed market outlook signals as if they were a mechanical trading system, while pointing out issues and making adjustments. The goal is to give you to give you an example of how to analyze and continuously improve your own systems.
- 2015 Performance - Stock Market Outlook
- 2016 Performance - Stock Market Outlook
- 2017 Performance - Stock Market Outlook
- 2018 Performance - Stock Market Outlook
- 2019 Performance - Stock Market Outlook
- 2020 Performance - Stock Market Outlook
For historical Elliott Wave commentary and analysis, go to ELLIOTT WAVE lives on by Tony Caldaro.
IMPORTANT DISCLOSURE INFORMATION
This material is for general communication and is provided for informational and/or educational purposes only. None of the content should be viewed as a suggestion that you take or refrain from taking any action nor as a recommendation for any specific investment product, strategy, or other such purpose. Certain information contained herein has been obtained from third-party sources believed to be reliable, but we cannot guarantee its accuracy or completeness.
To the extent that a reader has any questions regarding the applicability of any specific issue discussed above to his/her individual situation, he/she is encouraged to consult with the professional advisors of his/her choosing. Invest Safely, LLC is not a law firm, certified public accounting firm, or registered investment advisor and no portion of its content should be construed as legal, accounting, or investment advice.
The material is not to be construed as an offer or a recommendation to buy or sell a security nor is it to be construed as investment advice. Additionally, the material accessible through this website does not constitute a representation that the investments described herein are suitable or appropriate for any person.
Hypothetical Presentations:
Any referenced performance is “as calculated” using the referenced funds and has not been independently verified. This presentation does not discuss, directly or indirectly, the amount of the profits or losses, realized or unrealized, by any reader or contributor, from any specific funds or securities.
The author and/or any reader may have experienced materially different performance based upon various factors during the corresponding time periods. To the extent that any portion of the content reflects hypothetical results that were achieved by means of the retroactive application of a back-tested model, such results have inherent limitations, including:
Model results do not reflect the results of actual trading using assets, but were achieved by means of the retroactive application of the referenced models, certain aspects of which may have been designed with the benefit of hindsight
Back-tested performance may not reflect the impact that any material market or economic factors might have had on the use of a trading model if the model had been used during the period to actually manage assets
Actual investment results during the corresponding time periods may have been materially different from those portrayed in the model
Past performance may not be indicative of future results. Therefore, no one should assume that future performance will be profitable, or equal to any corresponding historical index.
The S&P 500 Composite Total Return Index (the "S&P") is a market capitalization-weighted index of 500 widely held stocks often used as a proxy for the stock market. Standard & Poor's chooses the member companies for the S&P based on market size, liquidity, and industry group representation. Included are the common stocks of industrial, financial, utility, and transportation companies. The S&P is not an index into which an investor can directly invest. The historical S&P performance results (and those of all other indices) are provided exclusively for comparison purposes only, so as to provide general comparative information to assist an individual in determining whether the performance of a specific portfolio or model meets, or continues to meet investment objective(s). The model and indices performance results do not reflect the impact of taxes.
Investing involves risk (even the “safe” kind)! Past performance does not guarantee or indicate future results. Different types of investments involve varying degrees of underlying risk. Therefore, do not assume that future performance of any specific investment or investment strategy be suitable for your portfolio or individual situation, will be profitable, equal any historical performance level(s), or prove successful (including the investments and/or investment strategies describe on this site).
Investing Process Links
Stabilize- Organize your $$$
- Manage your $$$
Plan
- Why You Invest
- Ways to Invest
- Where to Invest
- What to Invest In
Execute
- When to Invest
- How Much to Invest
- Buying & Selling
Monitor
- Track The Market
- Track Your Returns
Reflect & Adjust
- Improve Your Returns
- Adjust your Holdings
Popular Pages
- Jim Cramer- Personal Incomes Statements
- Hyperinflation
- Calculating Beta
- SMART Financial Goals
Blogroll
- Advisor Perspectives- Dividend Growth Investor
- Elliott Wave Lives On
- On My Radar | CMG Wealth
- Sure Dividend
- The Big Picture
- The Fat Pitch
- Thoughts from the Frontline
- Trader Feed
Sponsored Links
Invest Safely provides valuable, time-saving info about personal finance, money management, and investing.


