Stock Market Outlook
For The Week Of January 18th =
Uptrend
INDICATORS
-
ADX Directional Index: Bullish
Institutional Activity: Bullish
On Balance Volume: Bullish
ANALYSIS
The stock market outlook maintained an uptrend after navigating an eventful week geopolitical and policy headlines.
The S&P500 ( $SPX ) lost 0.4% last week. The index sits ~2% above the 50-day moving average and ~9% above the 200-day moving average.
All three technical indicators are bullish to start the week.
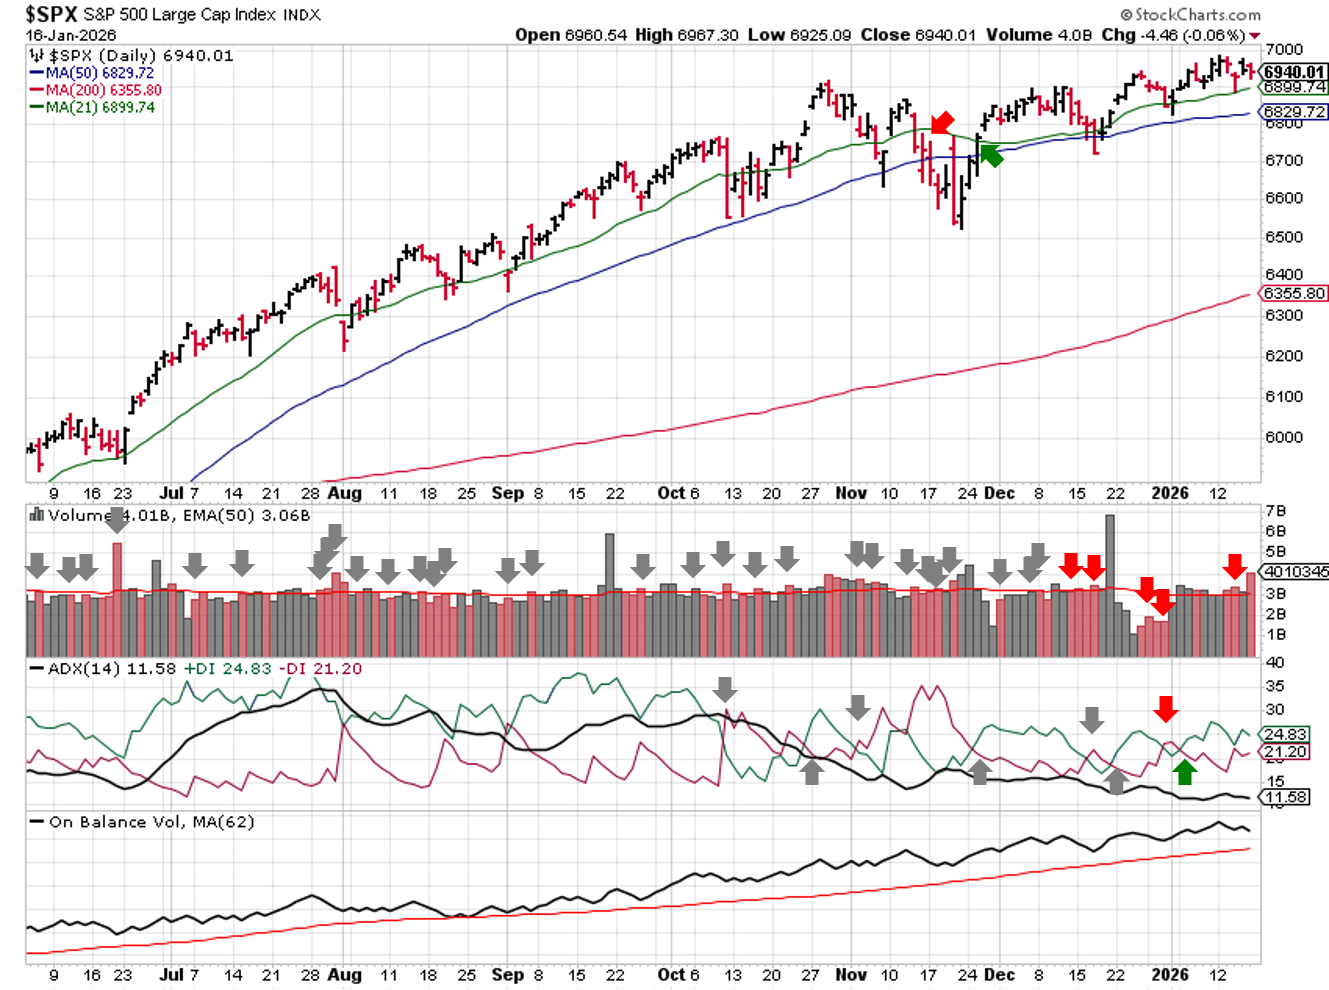
SPX Technical Analysis - January 18 2026
PERFORMANCE COMPARISONS
Real Estate ( $XLRE ) outperformed and switch to bullish bias, while Communications and Financials ( $XLC & $XLF ) tied for last place. Communications also fell to neutral bias.
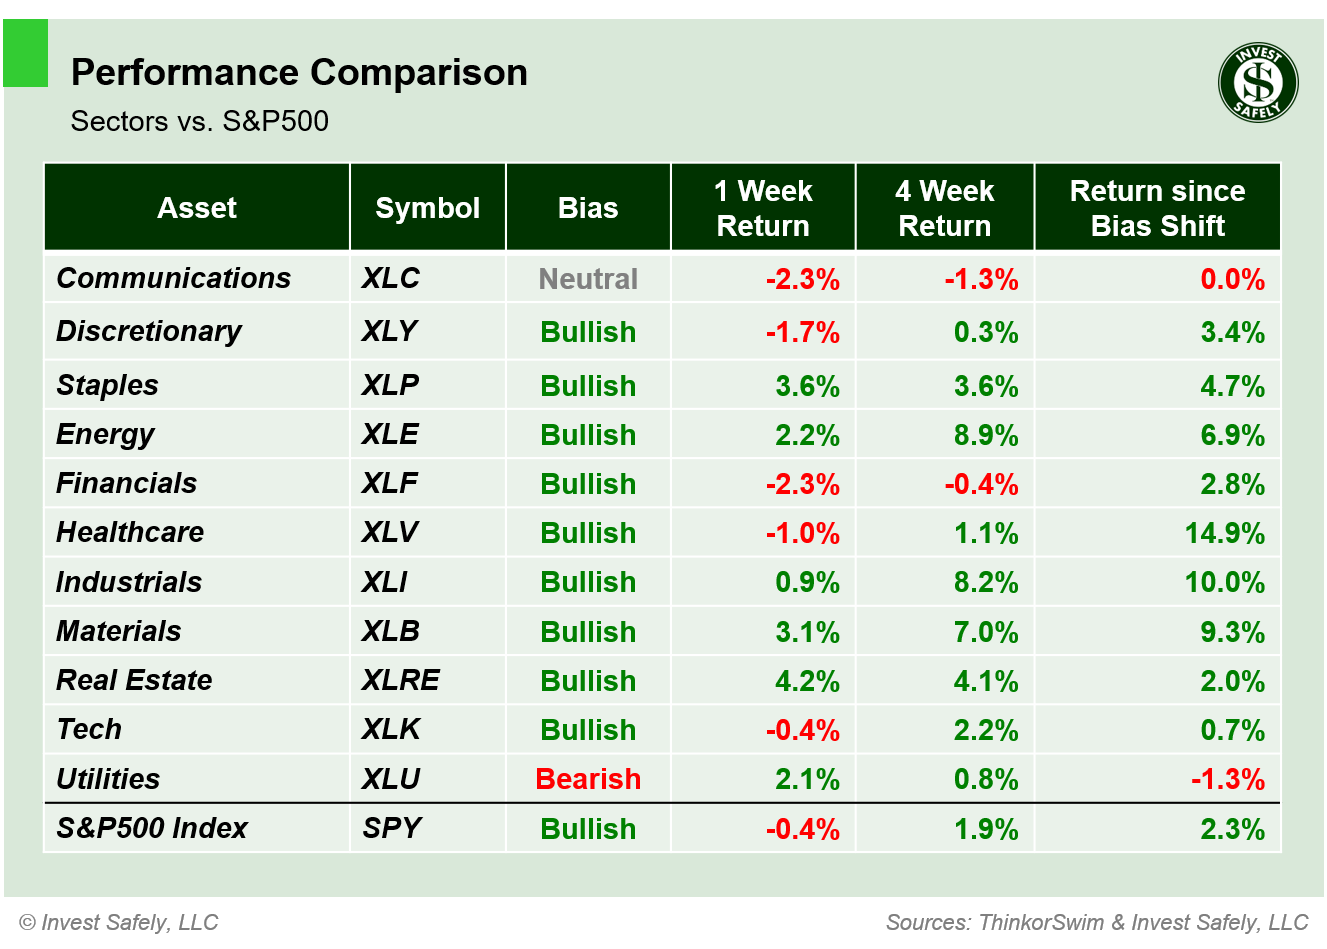
S&P500 Sector Performance - January 18 2026
Small Cap Value ( $IWN ) led all performers for the second week in a row. Large cap growth ( $IWF ) underperformed and fell to bearish bias. Mega cap growth ( $OEF ) also eased back to neutral bias, while Low Beta ( $SPLV ) moved back to bullish from neutral.

S&P500 Sector Style Performance - January 18 2026
Bitcoin ( $IBIT ) outperformed last week and managed to regain bullish bias for the first time in several weeks. U.S. Bonds and Equities ( $IEF & $SPY ) lagged. Bonds also fell back to bearish bias.
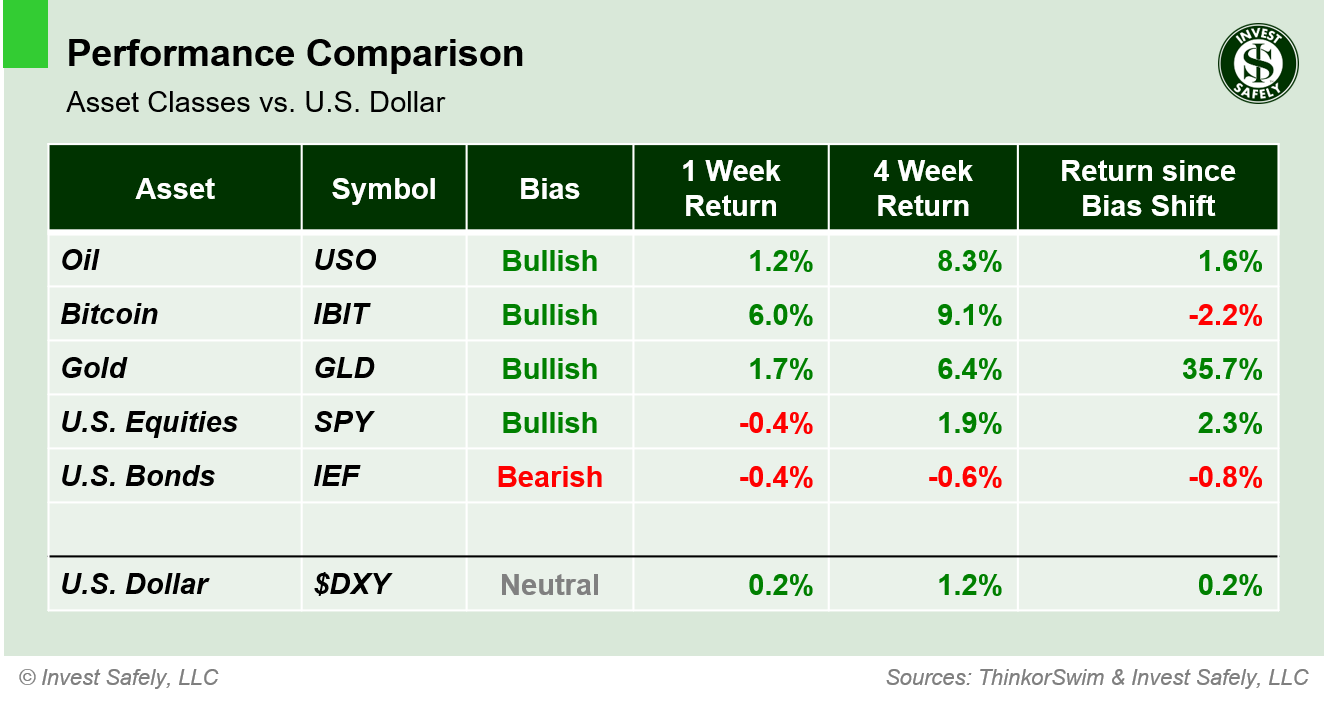
Asset Class Performance - January 18 2026
COMMENTARY
Last week was a long year! There were many news-worthy events, including:
- Federal Reserve Chair Jerome Powell was served grand jury subpoenas by the U.S.
- Justice Department regarding renovations at the Fed's headquarters
- The Supreme Court did NOT release an opinion on the legality of U.S. tariffs
- U.S. military asset mobilization in response to ongoing protests in Iran.
The Trump administration added to the fray, announcing or proposing:
- A one-year 10% cap on credit card interest rates
- Fannie Mae and Freddie Mac purchasing $200 billion in mortgage-backed securities,
- A temporary delay in plans to garnish wages and offset tax returns for defaulted student loan borrowers
After the close on Friday, new tariffs were announced, this time on countries that oppose the U.S. annexation/acquisition of Greenland.
Macro-wise, December CPI (headline and core) remained steady versus November readings. Headline was down slightly year over year, while core inflation slowed significantly (down from 3.2% in Dec 2024).
| CPI (y/y) | Actual | Prior | Expected |
| Headline | +2.7% | +2.7% | +2.7% |
| Core | +2.6% | +2.6% | +2.7% |
November PPI (headline and core) came in at 3%, slightly above October readings, but lower than December last year.
| PPI (y/y) | Actual | Prior | Expected |
| Headline | +3.0% | +2.8% | +2.7% |
| Core | +3.0% | +2.9% | +2.7% |
Earnings season also kicked off, with a reminder of the ongoing, k-shaped economy: Banks with wealth management and investment banking business models reported significant growth, while those with a "mass-market" focus saw rising credit reserves (i.e. preparing for high loan defaults) and stagnant revenue growth. The proposed 10% cap on credit card interest rates didn't help stock prices either.
And, just in case you were thinking "nothing would surprise me at this point": a former policy expert in the UK said the Bank of England must plan for a financial crisis triggered by aliens.

This week, U.S. markets are closed Monday for the Martin Luther King Jr. Day. Final 2024 Q3 GDP and PCE for October and November will be released Thursday.
Best to Your Week!
P.S. If you find this research helpful, please tell a friend.
If you don't, tell an enemy.
Sources: Bloomberg, CNBC, Federal Reserve Bank of St. Louis, Hedgeye, U.S. Bureau of Economic Analysis, U.S. Bureau of Labor Statistics, TradingEconomics.com
Looking for more information on the Stock Market Outlook Signals?
You'll find it here:
Share this on social media:
Find articles and other news of interest from Invest-Safely:
Twitter (@investsafely)
Facebook (@InvestSafely)
LinkedIn (@Invest-Safely)
Instagram (@investsafely)
 If you're interested in learning more about the relationship between price and volume, or how to find and trade the best stocks for your growth strategy, check out this book via the following Amazon affiliate link:
How to Make Money in Stocks: A Winning System in Good Times and Bad.
It's one of my favorites.
Invest Safely, LLC is an independent investment research and online financial media company. Use of Invest Safely, LLC and any other products available through invest-safely.com is subject to our Terms of Service and Privacy Policy. Not a recommendation to buy or sell any security.
Charts provided courtesy of stockcharts.com.
For historical Elliott Wave commentary and analysis, go to ELLIOTT WAVE lives on by Tony Caldaro. Current counts can be found at: Pretzel Logic, and 12345ABCDEWXYZ
Once a year, I review the market outlook signals as if they were a mechanical trading system, while pointing out issues and making adjustments. The goal is to give you to give you an example of how to analyze and continuously improve your own systems.
- 2015 Performance - Stock Market Outlook
- 2016 Performance - Stock Market Outlook
- 2017 Performance - Stock Market Outlook
- 2018 Performance - Stock Market Outlook
- 2019 Performance - Stock Market Outlook
- 2020 Performance - Stock Market Outlook
IMPORTANT DISCLOSURE INFORMATION
This material is for general communication and is provided for informational and/or educational purposes only. None of the content should be viewed as a suggestion that you take or refrain from taking any action nor as a recommendation for any specific investment product, strategy, or other such purpose. Certain information contained herein has been obtained from third-party sources believed to be reliable, but we cannot guarantee its accuracy or completeness.
To the extent that a reader has any questions regarding the applicability of any specific issue discussed above to his/her individual situation, he/she is encouraged to consult with the professional advisors of his/her choosing. Invest Safely, LLC is not a law firm, certified public accounting firm, or registered investment advisor and no portion of its content should be construed as legal, accounting, or investment advice.
The material is not to be construed as an offer or a recommendation to buy or sell a security nor is it to be construed as investment advice. Additionally, the material accessible through this website does not constitute a representation that the investments described herein are suitable or appropriate for any person.
Hypothetical Presentations:
Any referenced performance is “as calculated” using the referenced funds and has not been independently verified. This presentation does not discuss, directly or indirectly, the amount of the profits or losses, realized or unrealized, by any reader or contributor, from any specific funds or securities.
The author and/or any reader may have experienced materially different performance based upon various factors during the corresponding time periods. To the extent that any portion of the content reflects hypothetical results that were achieved by means of the retroactive application of a back-tested model, such results have inherent limitations, including:
Model results do not reflect the results of actual trading using assets, but were achieved by means of the retroactive application of the referenced models, certain aspects of which may have been designed with the benefit of hindsight
Back-tested performance may not reflect the impact that any material market or economic factors might have had on the use of a trading model if the model had been used during the period to actually manage assets
Actual investment results during the corresponding time periods may have been materially different from those portrayed in the model
Past performance may not be indicative of future results. Therefore, no one should assume that future performance will be profitable, or equal to any corresponding historical index.
The S&P 500 Composite Total Return Index (the "S&P") is a market capitalization-weighted index of 500 widely held stocks often used as a proxy for the stock market. Standard & Poor's chooses the member companies for the S&P based on market size, liquidity, and industry group representation. Included are the common stocks of industrial, financial, utility, and transportation companies. The S&P is not an index into which an investor can directly invest. The historical S&P performance results (and those of all other indices) are provided exclusively for comparison purposes only, so as to provide general comparative information to assist an individual in determining whether the performance of a specific portfolio or model meets, or continues to meet investment objective(s). The model and indices performance results do not reflect the impact of taxes.
Investing involves risk (even the “safe” kind)! Past performance does not guarantee or indicate future results. Different types of investments involve varying degrees of underlying risk. Therefore, do not assume that future performance of any specific investment or investment strategy be suitable for your portfolio or individual situation, will be profitable, equal any historical performance level(s), or prove successful (including the investments and/or investment strategies describe on this site).
Investing Process Links
Stabilize- Organize your $$$
- Manage your $$$
Plan
- Why You Invest
- Ways to Invest
- Where to Invest
- What to Invest In
Execute
- When to Invest
- How Much to Invest
- Buying & Selling
Monitor
- Track The Market
- Track Your Returns
Reflect & Adjust
- Improve Your Returns
- Adjust your Holdings
Popular Pages
- Jim Cramer- Personal Incomes Statements
- Hyperinflation
- Calculating Beta
- SMART Financial Goals
Blogroll
- Advisor Perspectives- Dividend Growth Investor
- Elliott Wave Lives On
- On My Radar | CMG Wealth
- Sure Dividend
- The Big Picture
- The Fat Pitch
- Thoughts from the Frontline
- Trader Feed
Sponsored Links
Invest Safely provides valuable, time-saving info about personal finance, money management, and investing.


