Stock Market Outlook
For The Week Of May 19th =
Uptrend
INDICATORS
-
ADX Directional Indicators: Uptrend
Price & Volume Action: Uptrend
On Balance Volume Indicator: Uptrend
The S&P500 ($SPX) rose 1.5% last week and now sits above the 50 and 200-day moving averages (~3% and ~9% respectively).
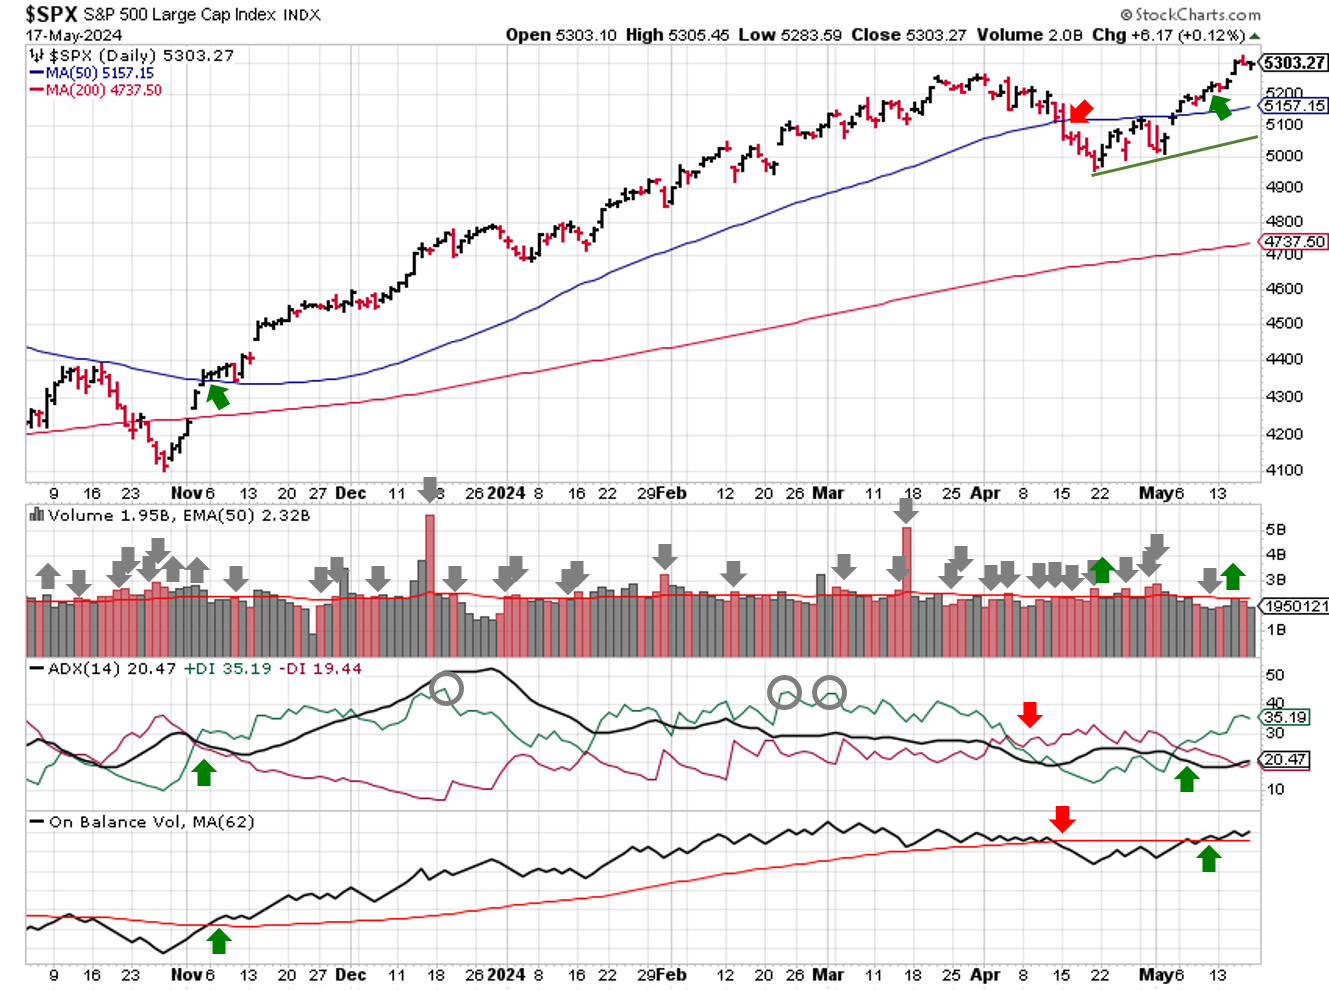
SPX Technical Analysis - May 19 2024
The ADX and OBV signals are bullish heading into the week, showing buyers remained more aggressive than sellers last week. Price/volume shifted to an uptrend on Wednesday, after the SPX responded to dovish CPI data with a follow-through day. The move also resets the distribution day count.
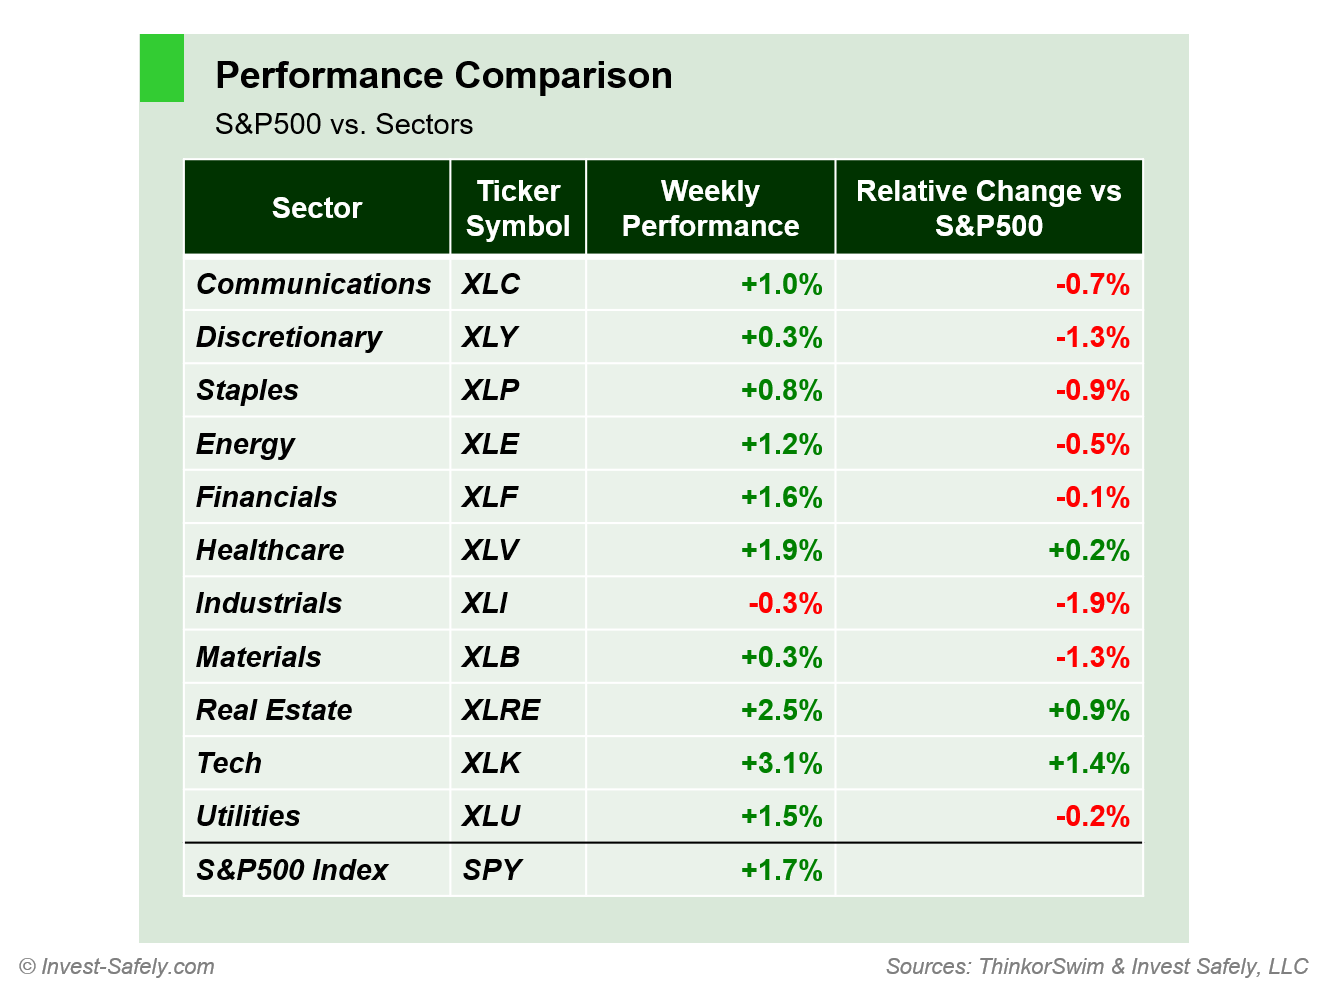
Most sub-sectors of the S&P500 were green on an absolute basis, but most of those gains were generated by the general index. Technology ($XLK) lead the way last week, while Industrials ($XLI) were the worst performer.
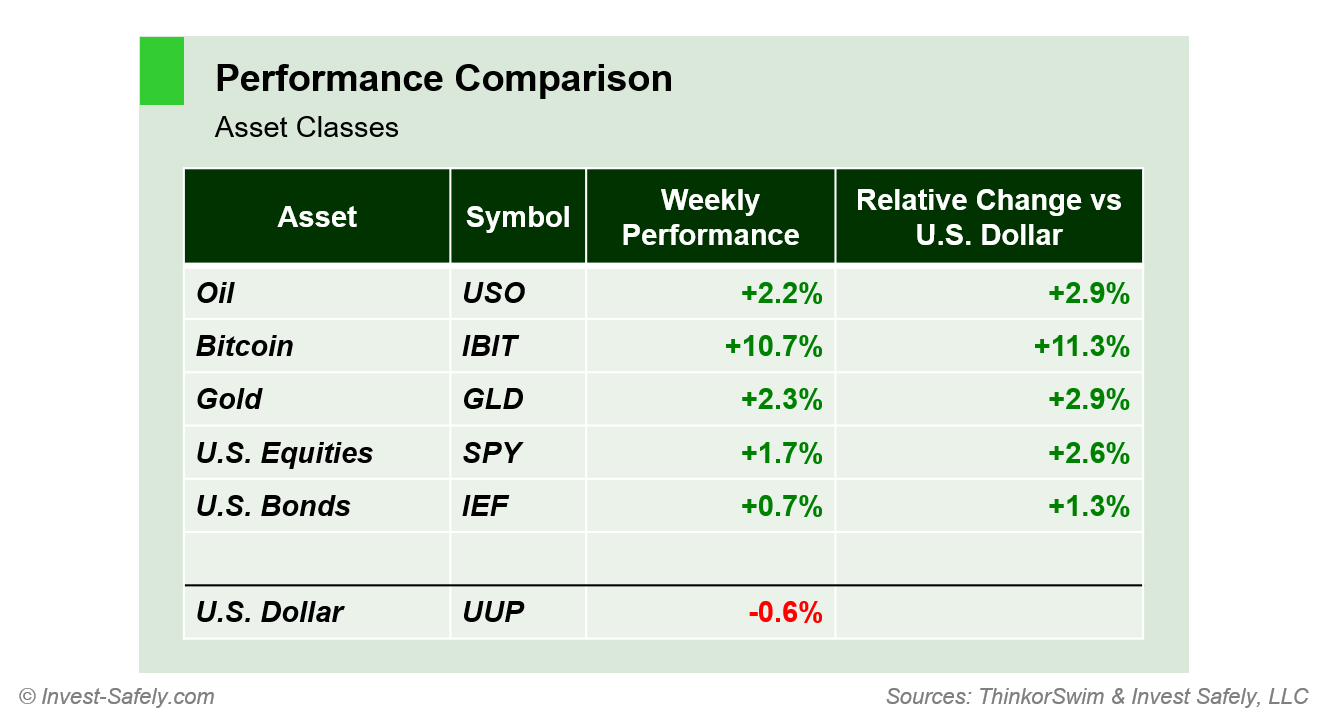
From an asset perspective, a weak dollar benefited all classes. The risk-on reaction to a dovish CPI print sent the price of Bitcoin almost 11% higher for the week, breaking out of the recent consolidation pattern.
COMMENTARY
The "big news" last week was the return of the "RoaringKitty" X.com/Twitter account. After radio silence since June 17 2021, a cryptic meme appeared Sunday:

This image was all it took to ignite a frenzy of social media speculation about a potential short squeeze in Gamestop ($GME), the ticker that made Keith Gill a household name. Which, of course, led to a massive level of trading in several meme stocks prior to the market opening on Monday, as well as the rest the week.
Unsurprisingly, there was no "real" news driving the move, and the tickers gave back a majority of their gains. There's even some who claim that Mr. Gill sold the "RoaringKitty" account, calling into question who is posting and for what purpose (other than your classic pump and dump). Just another reminder to be careful when you're on the internet.
In other news, Federal Reserve Chairman Jerome Powell participated at the Foreign Bankers' Association's Annual General Meeting in Amsterdam, reiterating the stance that inflation remains sticky, but the U.S. economy is still performing well based on GDP growth, tight labor markets, and solid household finances.
His remarks came after the pre-market release Producer Price Indexes, which showed Headline and Core inflation accelerated in April. Market reaction was muted, likely due to the fact that the increases were in line with expectations.
| PPI (y/y) | Actual | Prior | Expected |
| Headline | +2.2% | +1.8% | +2.2% |
| Core | +2.4% | +2.1% | +2.4% |
*March Headline PPI was revised down to 1.8% from 2.1%; Core PPI to 2.1% from 2.4%
On Wednesday, the BLS released April CPI data, showing that Core and Headline figures eased slightly in April. Market reaction was bullish on renewed expectations for interest rate cuts.
| CPI (y/y) | Actual | Prior | Expected |
| Headline | +3.4% | +3.5% | +3.4% |
| Core | +3.6% | +3.8% | +3.6% |
This week kicks off with a Sunday speech from five (!) speeches from Federal Reserve officials; one Sunday afternoon from Chairman Powell, and 4 Monday morning from Bostic, Barr, Waller, and Jefferson. Then Tuesday is more of the same, with eight (!!) more speeches!
FOMC minutes from the last meeting get dissected Wednesday afternoon, and Durable Goods Orders for April hit the wires on Friday.
Best to Your Week!
P.S. If you find this research helpful, please tell a friend.
If you don't, tell an enemy.
Sources: Bloomberg, CNBC, Federal Reserve Bank of St. Louis, Hedgeye, U.S. Bureau of Economic Analysis, U.S. Bureau of Labor Statistics
Share this Post on:

How to Make Money in Stocks: A Winning System in Good Times and Bad.
It's one of my favorites.
I regularly share articles and other news of interest on:
Twitter (@investsafely)
Facebook (@InvestSafely)
LinkedIn (@Invest-Safely)
Instagram (@investsafely)
Invest Safely, LLC is an independent investment research and online financial media company. Use of Invest Safely, LLC and any other products available through invest-safely.com is subject to our Terms of Service and Privacy Policy. Not a recommendation to buy or sell any security.
Charts provided courtesy of stockcharts.com.
For historical Elliott Wave commentary and analysis, go to ELLIOTT WAVE lives on by Tony Caldaro. Current counts can be found at: Pretzel Logic, and 12345ABCDEWXYZ
Once a year, I review the market outlook signals as if they were a mechanical trading system, while pointing out issues and making adjustments. The goal is to give you to give you an example of how to analyze and continuously improve your own systems.
- 2015 Performance - Stock Market Outlook
- 2016 Performance - Stock Market Outlook
- 2017 Performance - Stock Market Outlook
- 2018 Performance - Stock Market Outlook
- 2019 Performance - Stock Market Outlook
- 2020 Performance - Stock Market Outlook
IMPORTANT DISCLOSURE INFORMATION
This material is for general communication and is provided for informational and/or educational purposes only. None of the content should be viewed as a suggestion that you take or refrain from taking any action nor as a recommendation for any specific investment product, strategy, or other such purpose. Certain information contained herein has been obtained from third-party sources believed to be reliable, but we cannot guarantee its accuracy or completeness.
To the extent that a reader has any questions regarding the applicability of any specific issue discussed above to his/her individual situation, he/she is encouraged to consult with the professional advisors of his/her choosing. Invest Safely, LLC is not a law firm, certified public accounting firm, or registered investment advisor and no portion of its content should be construed as legal, accounting, or investment advice.
The material is not to be construed as an offer or a recommendation to buy or sell a security nor is it to be construed as investment advice. Additionally, the material accessible through this website does not constitute a representation that the investments described herein are suitable or appropriate for any person.
Hypothetical Presentations:
Any referenced performance is “as calculated” using the referenced funds and has not been independently verified. This presentation does not discuss, directly or indirectly, the amount of the profits or losses, realized or unrealized, by any reader or contributor, from any specific funds or securities.
The author and/or any reader may have experienced materially different performance based upon various factors during the corresponding time periods. To the extent that any portion of the content reflects hypothetical results that were achieved by means of the retroactive application of a back-tested model, such results have inherent limitations, including:
Model results do not reflect the results of actual trading using assets, but were achieved by means of the retroactive application of the referenced models, certain aspects of which may have been designed with the benefit of hindsight
Back-tested performance may not reflect the impact that any material market or economic factors might have had on the use of a trading model if the model had been used during the period to actually manage assets
Actual investment results during the corresponding time periods may have been materially different from those portrayed in the model
Past performance may not be indicative of future results. Therefore, no one should assume that future performance will be profitable, or equal to any corresponding historical index.
The S&P 500 Composite Total Return Index (the "S&P") is a market capitalization-weighted index of 500 widely held stocks often used as a proxy for the stock market. Standard & Poor's chooses the member companies for the S&P based on market size, liquidity, and industry group representation. Included are the common stocks of industrial, financial, utility, and transportation companies. The S&P is not an index into which an investor can directly invest. The historical S&P performance results (and those of all other indices) are provided exclusively for comparison purposes only, so as to provide general comparative information to assist an individual in determining whether the performance of a specific portfolio or model meets, or continues to meet investment objective(s). The model and indices performance results do not reflect the impact of taxes.
Investing involves risk (even the “safe” kind)! Past performance does not guarantee or indicate future results. Different types of investments involve varying degrees of underlying risk. Therefore, do not assume that future performance of any specific investment or investment strategy be suitable for your portfolio or individual situation, will be profitable, equal any historical performance level(s), or prove successful (including the investments and/or investment strategies describe on this site).
Investing Process Links
Stabilize- Organize your $$$
- Manage your $$$
Plan
- Why You Invest
- Ways to Invest
- Where to Invest
- What to Invest In
Execute
- When to Invest
- How Much to Invest
- Buying & Selling
Monitor
- Track The Market
- Track Your Returns
Reflect & Adjust
- Improve Your Returns
- Adjust your Holdings
Popular Pages
- Jim Cramer- Personal Incomes Statements
- Hyperinflation
- Calculating Beta
- SMART Financial Goals
Blogroll
- Advisor Perspectives- Dividend Growth Investor
- Elliott Wave Lives On
- On My Radar | CMG Wealth
- Sure Dividend
- The Big Picture
- The Fat Pitch
- Thoughts from the Frontline
- Trader Feed
Sponsored Links
Invest Safely provides valuable, time-saving info about personal finance, money management, and investing.


