Stock Market Outlook
For The Week Of March 21st =
Downtrend
INDICATORS
-
ADX Directional Indicators: Downtrend
Price & Volume Action: Downtrend
On Balance Volume Indicator: Downtrend
The S&P500 ($SPX) dropped 3% last week, with sellers in control each day. The index sits ~3% below the 50-day and ~6% above the 200-day moving average.
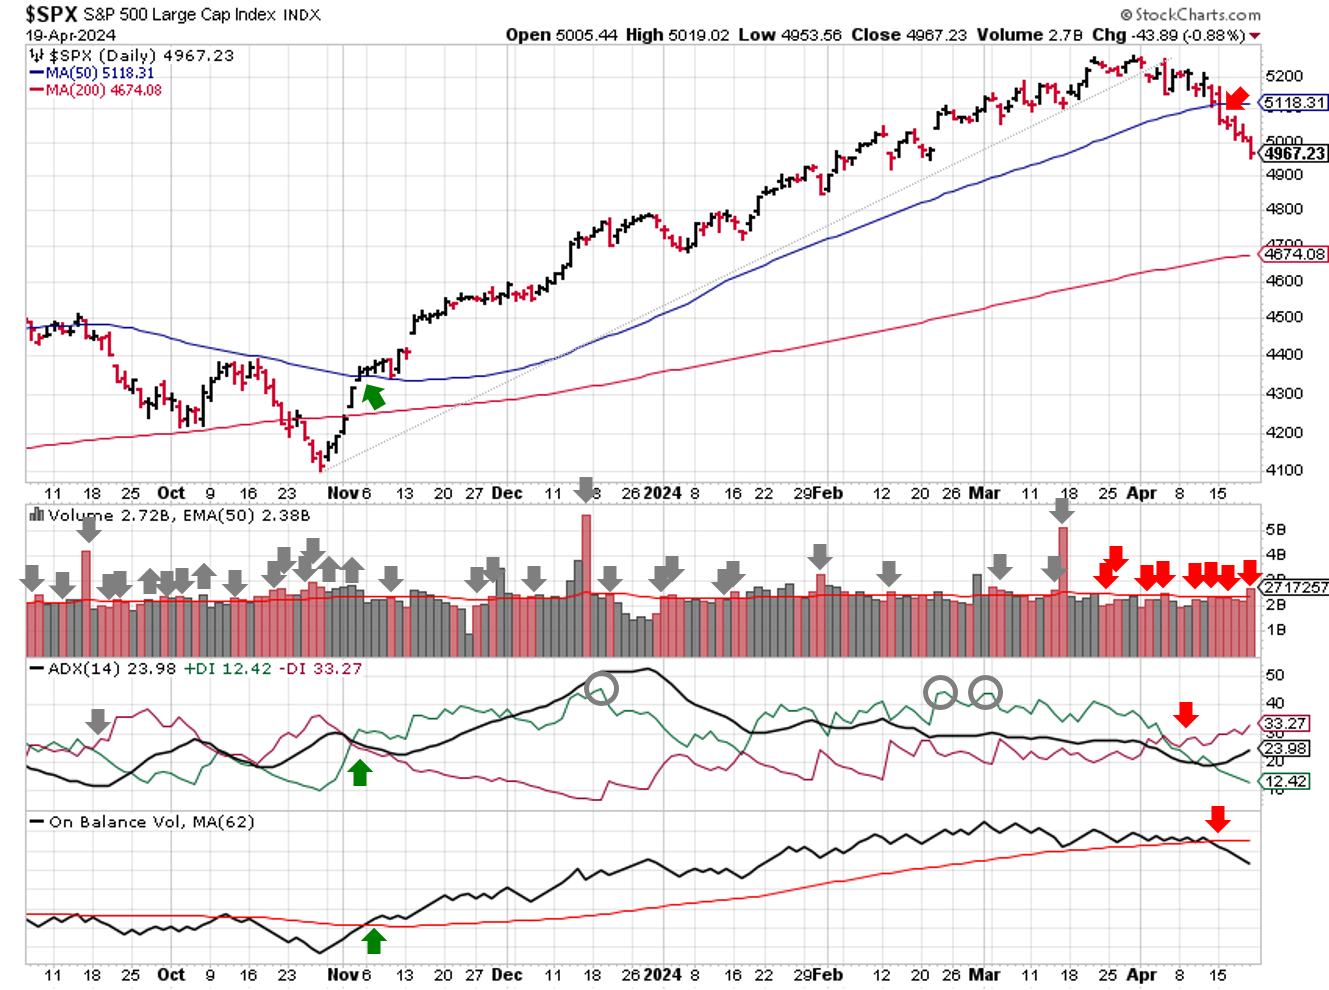
SPX Technical Analysis entering the Week of Apr 21 2024
All three technical indicators are in confirmed downtrends. Price/volume joined the ADX in bearish territory on Monday, after slicing through the 50-day moving average and confirming the downtrend signal. The price/volume action also pushed OBV into a downtrend.
In total, the SPX gained ~16% (704 points) between the uptrend initiation on November 3 (4358) and the start of the downtrend last Monday (5062). Now, the outlook is in capital preservation mode until signs of the next rally. Fortunately, money market funds offer attractive alternatives these days, thanks to higher interest rates.
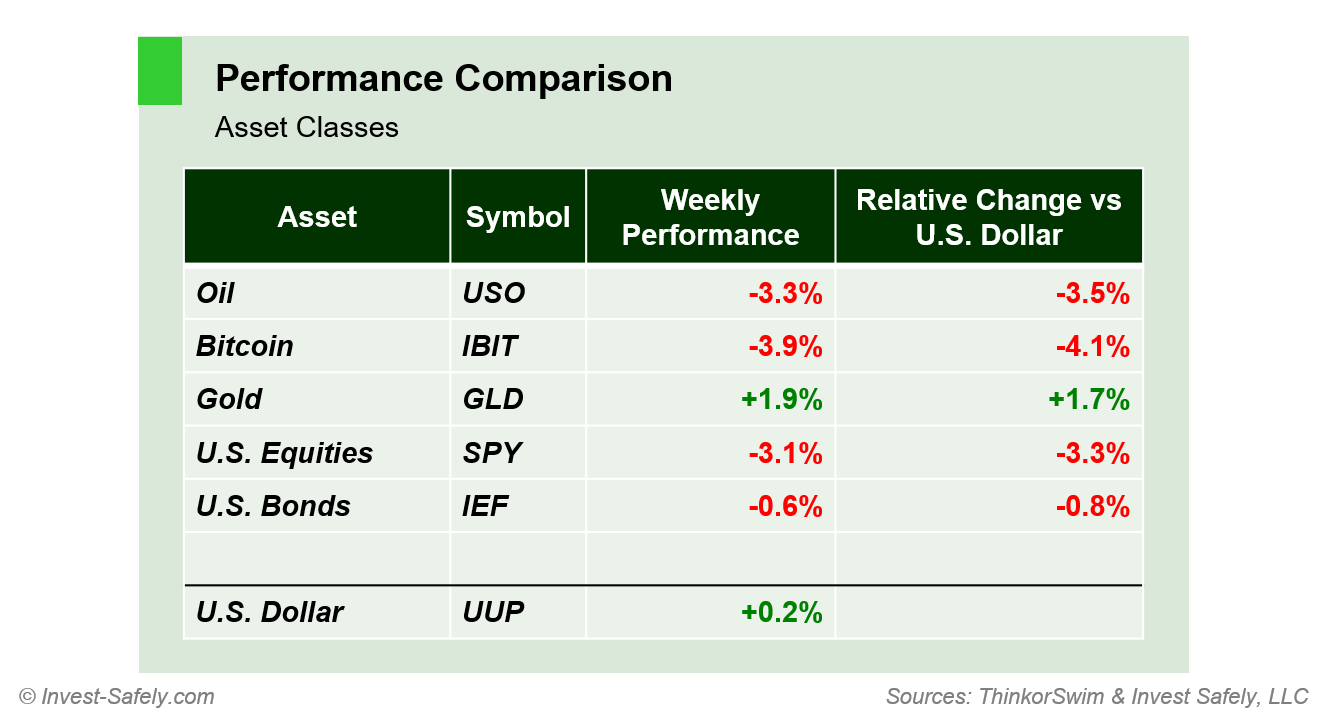
Gold was the best asset class for the second week in a row, rising 2%. Bitcoin led to the downside, although Oil and US Equities weren't far behind.
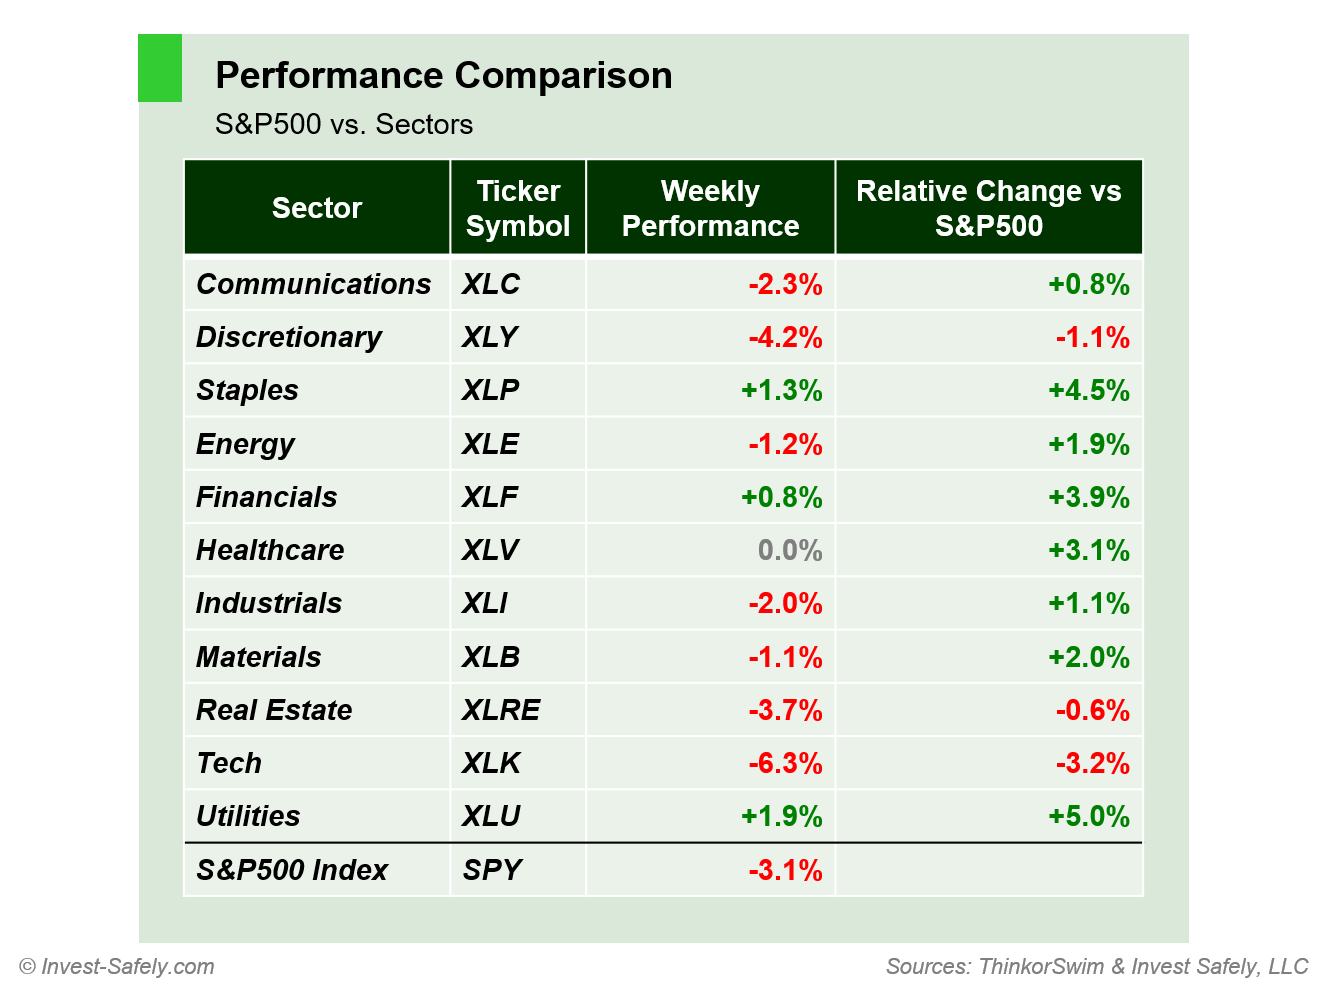
Within major equity sectors, Technology ($XLK) was the biggest loser, dropping over 6%, while Utilities ($XLU) gained ~2%.
COMMENTARY
For the first time since Q3 last year, "buy the dip" gave way to "sell the rip". Even "better than expected" Q1 earnings couldn't stem the tide of selling. Instead, investors focused on weaker forward guidance, as well as higher-for-longer interest rates and geopolitics.
Last Tuesday, Federal Reserve Chairman Powell spoke at a forum on U.S.-Canada economic relations. His comments on inflation threw cold water on the rate-cut crowd and sent longer-term interest rates higher:
“The recent data have clearly not given us greater confidence, and instead indicate that it’s likely to take longer than expected to achieve that confidence.”“We can maintain the current level of restriction for as long as needed.”
Thursday evening, Israel conducted airstrikes against Iranian targets. The move came as a surprise to many, as most media outlets expected a delayed response due to religious holidays. Although the events took place outside of market hours, futures spiked; equities down, gold and oil up. Those knee-jerk reactions were undone by the time the market opened on Friday, but buyers weren't motivated to put capital at risk in equities over the weekend.
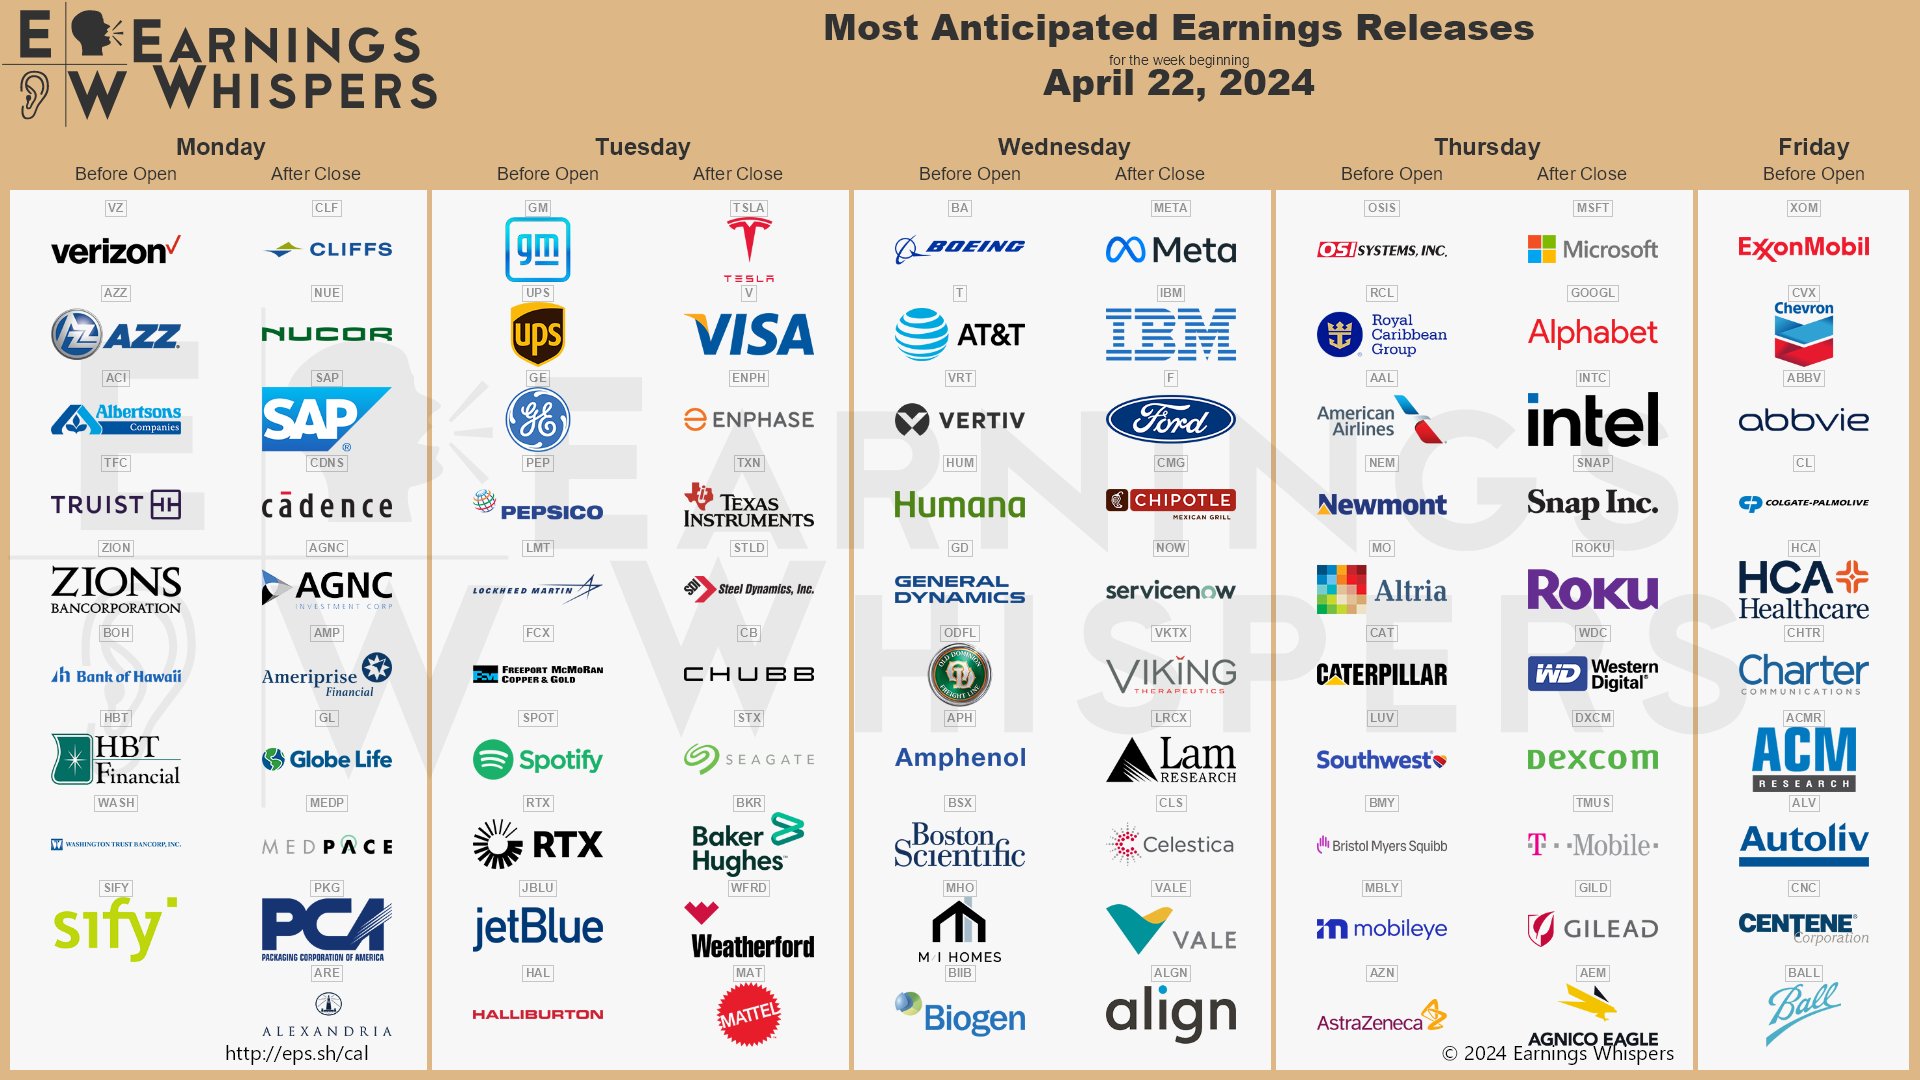
A big week for Q1 earnings, with 4 of the "Magnificent 7" reporting: $MSFT, $GOOG/$GOOGL, $META, $TSLA. Microsoft, Google, and Meta combine for more than 12% of SPX market cap, so any surprises will have an outsized impact on index performance.
Earnings for the week of April 22, 2024
— Earnings Whispers (@eWhispers) April 18, 2024
$TSLA $META $MSFT $GOOGL $INTC $XOM $IBM $V $F $BA $VZ $CMG $GM $SNAP $ENPH $UPS $GE $T $CLF $OSIS $ROKU $NOW $PEP $LMT $FCX $RCL $VRT $WDC $HUM $SPOT $VKTX $AAL $NUE $NEM $MO $RTX $TXN $LRCX $CAT $CVX $JBLU $DXCM…
Data-wise, most news outlets will focus on Friday's release of March PCE, due to its impact on rate cut narratives. But we'll also March Durable Goods orders (Wednesday morning) and the first (i.e. "advance") estimate of Q1 GDP (Thursday morning).
Best to Your Week!
P.S. If you find this research helpful, please tell a friend.
If you don't, tell an enemy.
Sources: Bloomberg, CNBC, Federal Reserve Bank of St. Louis, Hedgeye, U.S. Bureau of Economic Analysis, U.S. Bureau of Labor Statistics
Share this Post on:

How to Make Money in Stocks: A Winning System in Good Times and Bad.
It's one of my favorites.
I regularly share articles and other news of interest on:
Twitter (@investsafely)
Facebook (@InvestSafely)
LinkedIn (@Invest-Safely)
Instagram (@investsafely)
Invest Safely, LLC is an independent investment research and online financial media company. Use of Invest Safely, LLC and any other products available through invest-safely.com is subject to our Terms of Service and Privacy Policy. Not a recommendation to buy or sell any security.
Charts provided courtesy of stockcharts.com.
For historical Elliott Wave commentary and analysis, go to ELLIOTT WAVE lives on by Tony Caldaro. Current counts can be found at: Pretzel Logic, and 12345ABCDEWXYZ
Once a year, I review the market outlook signals as if they were a mechanical trading system, while pointing out issues and making adjustments. The goal is to give you to give you an example of how to analyze and continuously improve your own systems.
- 2015 Performance - Stock Market Outlook
- 2016 Performance - Stock Market Outlook
- 2017 Performance - Stock Market Outlook
- 2018 Performance - Stock Market Outlook
- 2019 Performance - Stock Market Outlook
- 2020 Performance - Stock Market Outlook
IMPORTANT DISCLOSURE INFORMATION
This material is for general communication and is provided for informational and/or educational purposes only. None of the content should be viewed as a suggestion that you take or refrain from taking any action nor as a recommendation for any specific investment product, strategy, or other such purpose. Certain information contained herein has been obtained from third-party sources believed to be reliable, but we cannot guarantee its accuracy or completeness.
To the extent that a reader has any questions regarding the applicability of any specific issue discussed above to his/her individual situation, he/she is encouraged to consult with the professional advisors of his/her choosing. Invest Safely, LLC is not a law firm, certified public accounting firm, or registered investment advisor and no portion of its content should be construed as legal, accounting, or investment advice.
The material is not to be construed as an offer or a recommendation to buy or sell a security nor is it to be construed as investment advice. Additionally, the material accessible through this website does not constitute a representation that the investments described herein are suitable or appropriate for any person.
Hypothetical Presentations:
Any referenced performance is “as calculated” using the referenced funds and has not been independently verified. This presentation does not discuss, directly or indirectly, the amount of the profits or losses, realized or unrealized, by any reader or contributor, from any specific funds or securities.
The author and/or any reader may have experienced materially different performance based upon various factors during the corresponding time periods. To the extent that any portion of the content reflects hypothetical results that were achieved by means of the retroactive application of a back-tested model, such results have inherent limitations, including:
Model results do not reflect the results of actual trading using assets, but were achieved by means of the retroactive application of the referenced models, certain aspects of which may have been designed with the benefit of hindsight
Back-tested performance may not reflect the impact that any material market or economic factors might have had on the use of a trading model if the model had been used during the period to actually manage assets
Actual investment results during the corresponding time periods may have been materially different from those portrayed in the model
Past performance may not be indicative of future results. Therefore, no one should assume that future performance will be profitable, or equal to any corresponding historical index.
The S&P 500 Composite Total Return Index (the "S&P") is a market capitalization-weighted index of 500 widely held stocks often used as a proxy for the stock market. Standard & Poor's chooses the member companies for the S&P based on market size, liquidity, and industry group representation. Included are the common stocks of industrial, financial, utility, and transportation companies. The S&P is not an index into which an investor can directly invest. The historical S&P performance results (and those of all other indices) are provided exclusively for comparison purposes only, so as to provide general comparative information to assist an individual in determining whether the performance of a specific portfolio or model meets, or continues to meet investment objective(s). The model and indices performance results do not reflect the impact of taxes.
Investing involves risk (even the “safe” kind)! Past performance does not guarantee or indicate future results. Different types of investments involve varying degrees of underlying risk. Therefore, do not assume that future performance of any specific investment or investment strategy be suitable for your portfolio or individual situation, will be profitable, equal any historical performance level(s), or prove successful (including the investments and/or investment strategies describe on this site).
Investing Process Links
Stabilize- Organize your $$$
- Manage your $$$
Plan
- Why You Invest
- Ways to Invest
- Where to Invest
- What to Invest In
Execute
- When to Invest
- How Much to Invest
- Buying & Selling
Monitor
- Track The Market
- Track Your Returns
Reflect & Adjust
- Improve Your Returns
- Adjust your Holdings
Popular Pages
- Jim Cramer- Personal Incomes Statements
- Hyperinflation
- Calculating Beta
- SMART Financial Goals
Blogroll
- Advisor Perspectives- Dividend Growth Investor
- Elliott Wave Lives On
- On My Radar | CMG Wealth
- Sure Dividend
- The Big Picture
- The Fat Pitch
- Thoughts from the Frontline
- Trader Feed
Sponsored Links
Invest Safely provides valuable, time-saving info about personal finance, money management, and investing.


