Stock Market Outlook
For The Week Of October 1st = Downtrend
INDICATORS
-
ADX Directional Indicators: Downtrend
Price & Volume Action: Downtrend
Elliott Wave Analysis: Mixed
The S&P500 ($SPX) fell 0.7% last week, breaking a major level of support; a trendline dating back to the October 2022 low! A quick recovery is needed this week in order for the trend to remain valid. As of Friday's close, the index was ~3.5% below the 50-day moving average, and ~2% above the 200 day moving average.
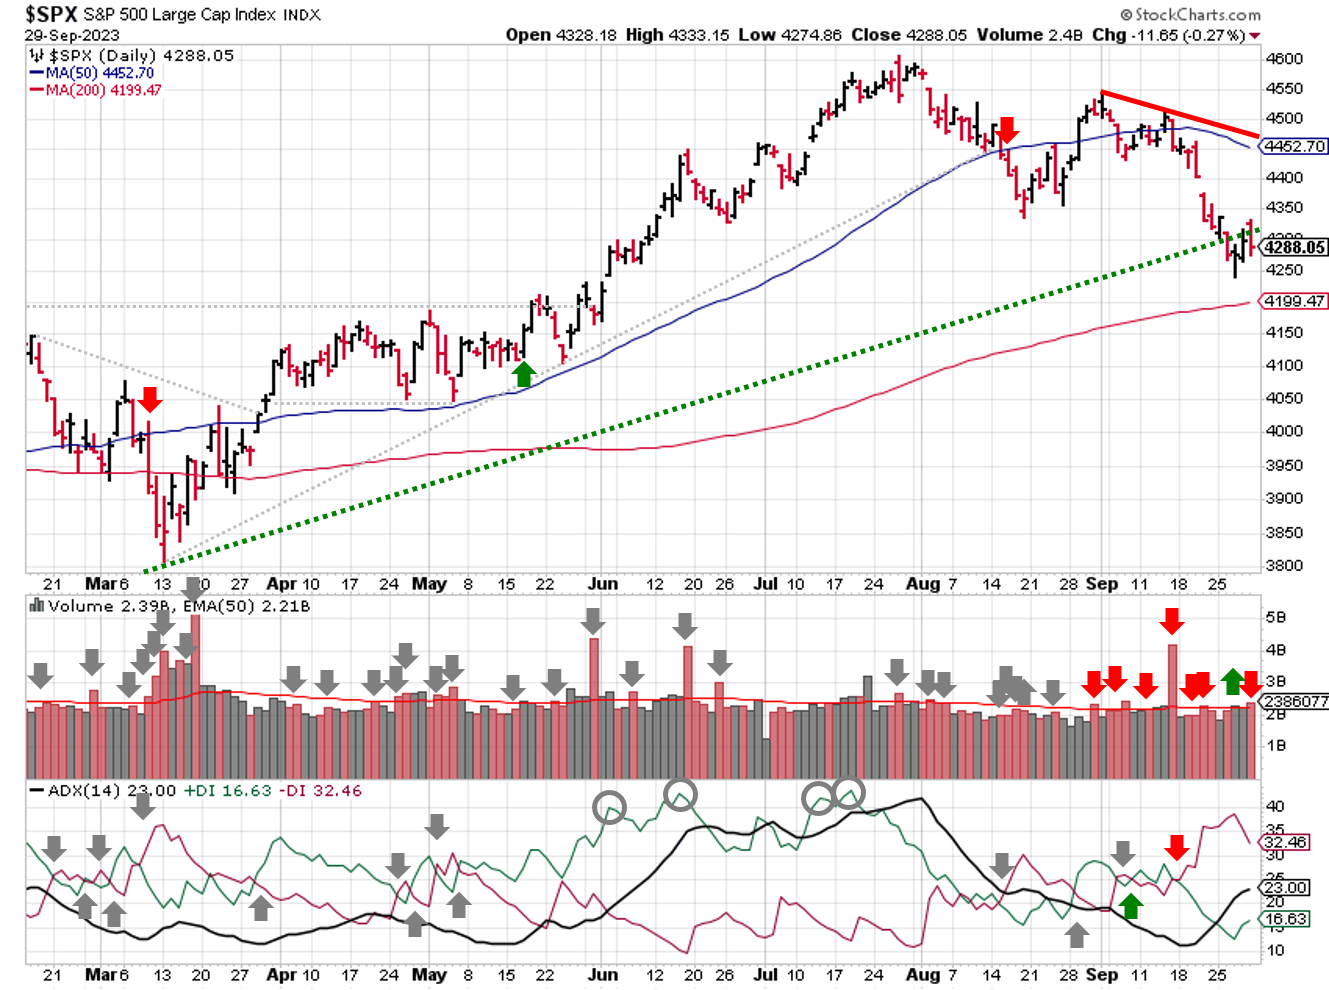
2023-10-01-SPX Trendline Analysis - Daily
The ADX directional indicators remain bearish, as does the price/volume indicator. The SPX did start a rally attempt on Wednesday. and will need to show a follow-through on higher than average volume sometime after Monday.
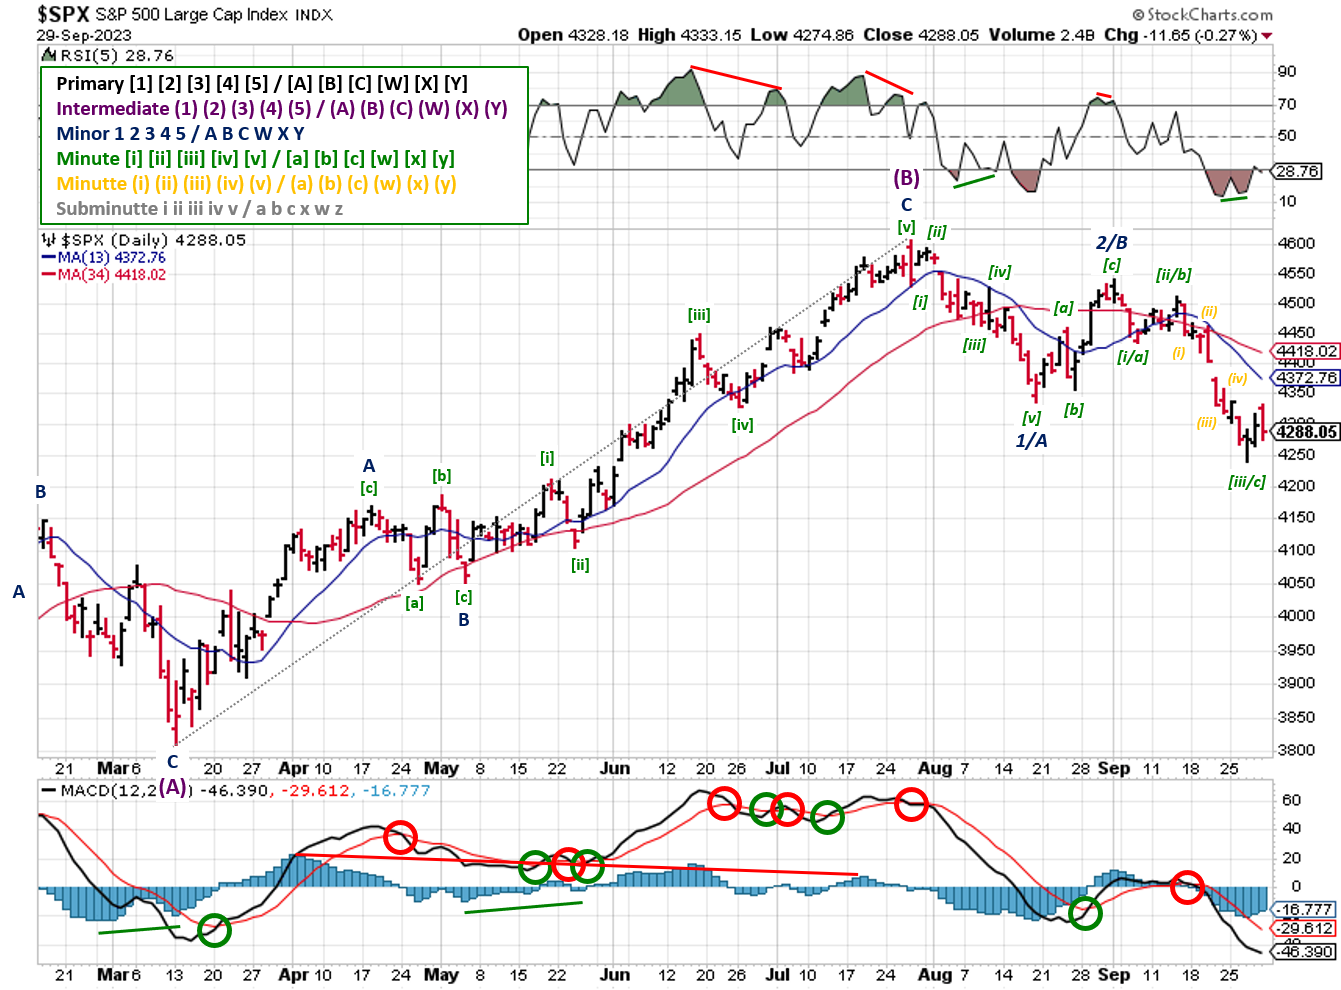
2023-10-01- SPX Elliott Wave Analysis - Daily - Primary Y (Bearish)
No change in Elliott Wave analysis either. The index completed a 3rd Minute wave on Wednesday, but we still don't know if the Minor wave is corrective (3 wave pattern) or impulse (5 wave pattern).
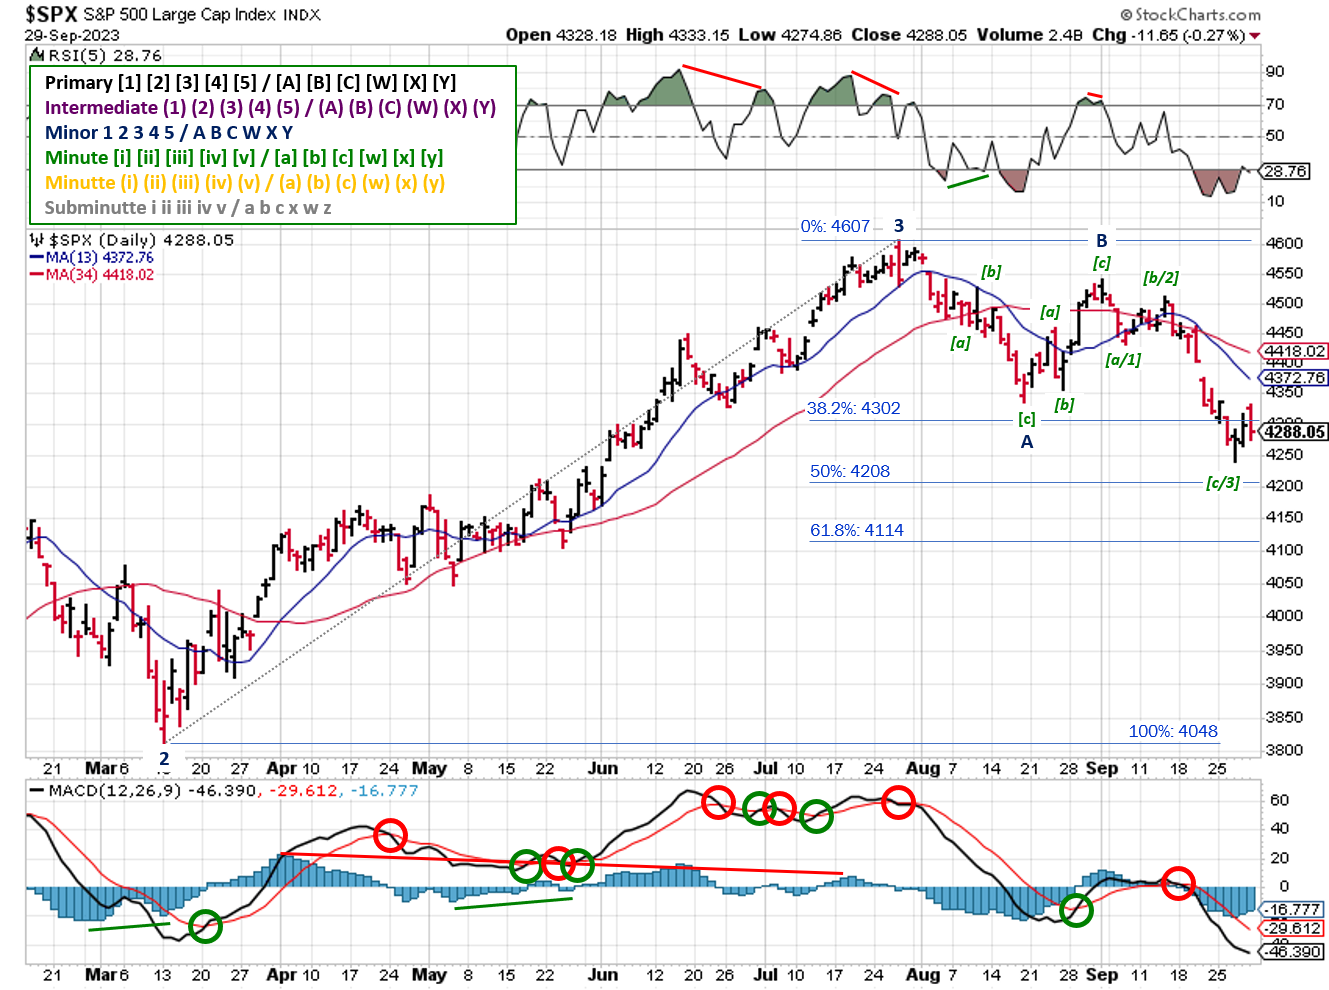
2023-10-01- SPX Elliott Wave Analysis - Daily - Primary 1 (Bullish)
The RSI(5) shows a bullish divergence, and the MACD histogram generated an inflection, increasing the probability of rising prices over the next 2 weeks or so. Near-term resistance is at 4430, support at 4238.
Looking at the patterns from a longer term (weekly) viewpoint has something for both bulls and bears. The bullish count shows that the current downtrend should be complete, with an oversold RSI(5), a bounce off the 34 week moving average, and no violation of the Minor 1 high of 4195.
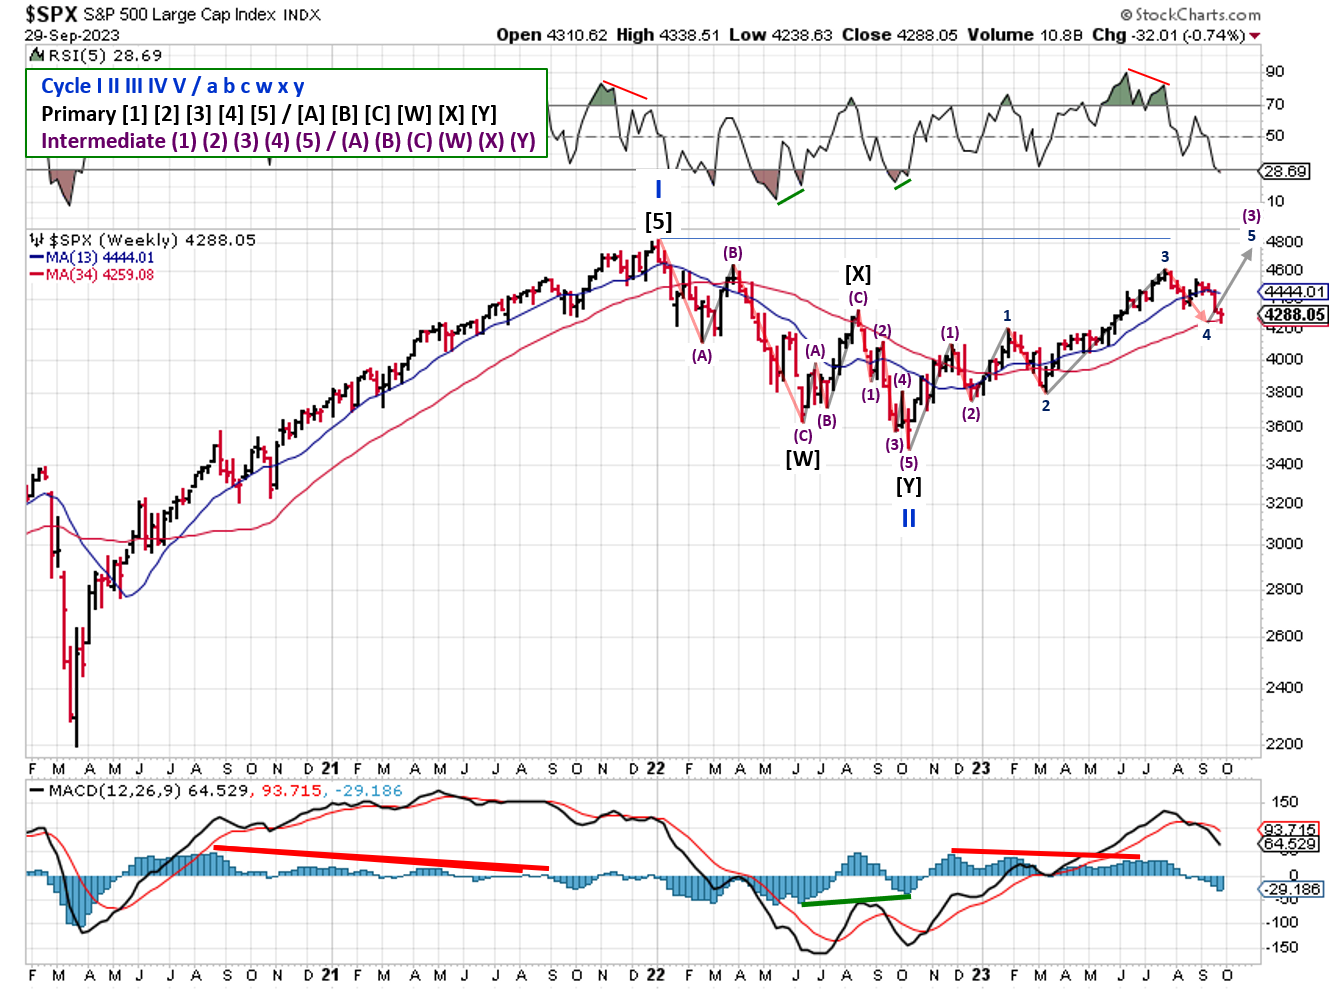
2023-10-01- SPX Elliott Wave Analysis - Weekly - Primary 1 (Bullish)
The bearish count shows the SPX in the middle of the first wave down, with a bearish cross-over in the MACD, an increasing rate of change in the MACD histogram.
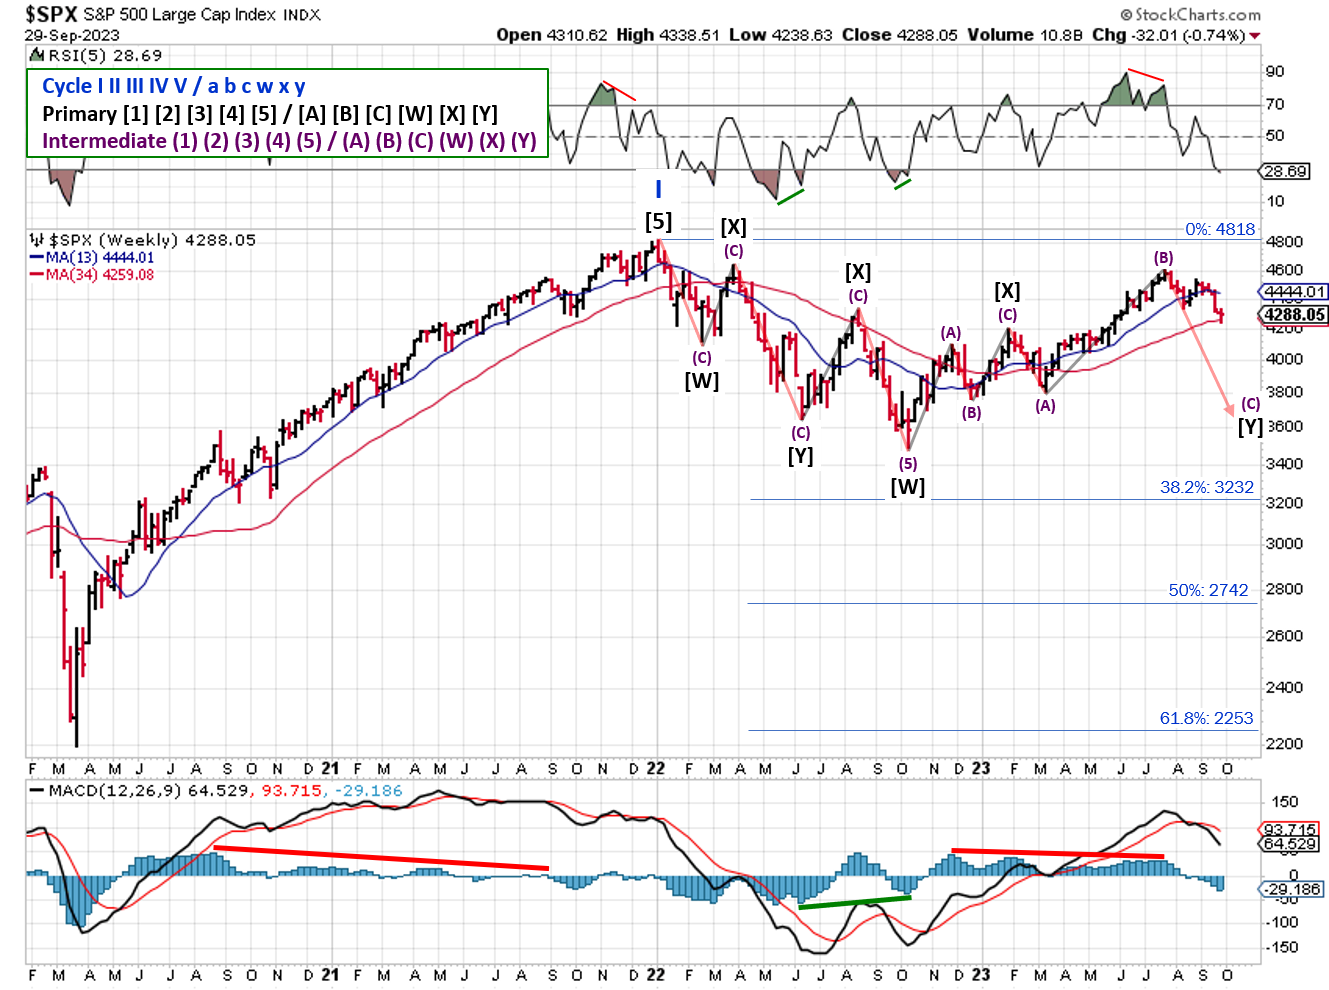
2023-10-01- SPX Elliott Wave Analysis - Weekly- Primary Y (Bearish)
COMMENTARY
Last week did not disappoint, in terms of money flow and price action, during the week. But you'd be forgiven for not noticing, as the index ended the week almost break-even. Headline PCE for August came in at +3.5% y/y, slightly higher than the +3.4% y/y reading in July. Core PCE fell to +3.9% y/y, from +4.3% y/y in July.
After a lot of hand wringing and gnashing of teeth, the U.S. Senate passed a continuing resolution on Saturday, which was then signed into law. The CR keeps the government funded for another 45 more days. Hopefully, the legislative branch can get their act together and finalize funding within that time period.
This week, we get JOLTS and Non-Farm Payroll data, but the main event starts next week with big banks set kick off Q3 earnings season.
Best to Your Week!
P.S. If you find this research helpful, please tell a friend.
If you don't, tell an enemy.
Sources: Bloomberg, CNBC, Federal Reserve Bank of St. Louis, Hedgeye, U.S. Bureau of Economic Analysis, U.S. Bureau of Labor Statistics
Share this Post on:

How to Make Money in Stocks: A Winning System in Good Times and Bad.
It's one of my favorites.
I regularly share articles and other news of interest on:
Twitter (@investsafely)
Facebook (@InvestSafely)
LinkedIn (@Invest-Safely)
Instagram (@investsafely)
Invest Safely, LLC is an independent investment research and online financial media company. Use of Invest Safely, LLC and any other products available through invest-safely.com is subject to our Terms of Service and Privacy Policy. Not a recommendation to buy or sell any security.
Charts provided courtesy of stockcharts.com.
For historical Elliott Wave commentary and analysis, go to ELLIOTT WAVE lives on by Tony Caldaro. Current counts can be found at: Pretzel Logic, and 12345ABCDEWXYZ
Once a year, I review the market outlook signals as if they were a mechanical trading system, while pointing out issues and making adjustments. The goal is to give you to give you an example of how to analyze and continuously improve your own systems.
- 2015 Performance - Stock Market Outlook
- 2016 Performance - Stock Market Outlook
- 2017 Performance - Stock Market Outlook
- 2018 Performance - Stock Market Outlook
- 2019 Performance - Stock Market Outlook
- 2020 Performance - Stock Market Outlook
IMPORTANT DISCLOSURE INFORMATION
This material is for general communication and is provided for informational and/or educational purposes only. None of the content should be viewed as a suggestion that you take or refrain from taking any action nor as a recommendation for any specific investment product, strategy, or other such purpose. Certain information contained herein has been obtained from third-party sources believed to be reliable, but we cannot guarantee its accuracy or completeness.
To the extent that a reader has any questions regarding the applicability of any specific issue discussed above to his/her individual situation, he/she is encouraged to consult with the professional advisors of his/her choosing. Invest Safely, LLC is not a law firm, certified public accounting firm, or registered investment advisor and no portion of its content should be construed as legal, accounting, or investment advice.
The material is not to be construed as an offer or a recommendation to buy or sell a security nor is it to be construed as investment advice. Additionally, the material accessible through this website does not constitute a representation that the investments described herein are suitable or appropriate for any person.
Hypothetical Presentations:
Any referenced performance is “as calculated” using the referenced funds and has not been independently verified. This presentation does not discuss, directly or indirectly, the amount of the profits or losses, realized or unrealized, by any reader or contributor, from any specific funds or securities.
The author and/or any reader may have experienced materially different performance based upon various factors during the corresponding time periods. To the extent that any portion of the content reflects hypothetical results that were achieved by means of the retroactive application of a back-tested model, such results have inherent limitations, including:
Model results do not reflect the results of actual trading using assets, but were achieved by means of the retroactive application of the referenced models, certain aspects of which may have been designed with the benefit of hindsight
Back-tested performance may not reflect the impact that any material market or economic factors might have had on the use of a trading model if the model had been used during the period to actually manage assets
Actual investment results during the corresponding time periods may have been materially different from those portrayed in the model
Past performance may not be indicative of future results. Therefore, no one should assume that future performance will be profitable, or equal to any corresponding historical index.
The S&P 500 Composite Total Return Index (the "S&P") is a market capitalization-weighted index of 500 widely held stocks often used as a proxy for the stock market. Standard & Poor's chooses the member companies for the S&P based on market size, liquidity, and industry group representation. Included are the common stocks of industrial, financial, utility, and transportation companies. The S&P is not an index into which an investor can directly invest. The historical S&P performance results (and those of all other indices) are provided exclusively for comparison purposes only, so as to provide general comparative information to assist an individual in determining whether the performance of a specific portfolio or model meets, or continues to meet investment objective(s). The model and indices performance results do not reflect the impact of taxes.
Investing involves risk (even the “safe” kind)! Past performance does not guarantee or indicate future results. Different types of investments involve varying degrees of underlying risk. Therefore, do not assume that future performance of any specific investment or investment strategy be suitable for your portfolio or individual situation, will be profitable, equal any historical performance level(s), or prove successful (including the investments and/or investment strategies describe on this site).
Investing Process Links
Stabilize- Organize your $$$
- Manage your $$$
Plan
- Why You Invest
- Ways to Invest
- Where to Invest
- What to Invest In
Execute
- When to Invest
- How Much to Invest
- Buying & Selling
Monitor
- Track The Market
- Track Your Returns
Reflect & Adjust
- Improve Your Returns
- Adjust your Holdings
Popular Pages
- Jim Cramer- Personal Incomes Statements
- Hyperinflation
- Calculating Beta
- SMART Financial Goals
Blogroll
- Advisor Perspectives- Dividend Growth Investor
- Elliott Wave Lives On
- On My Radar | CMG Wealth
- Sure Dividend
- The Big Picture
- The Fat Pitch
- Thoughts from the Frontline
- Trader Feed
Sponsored Links
Invest Safely provides valuable, time-saving info about personal finance, money management, and investing.


