Stock Market Outlook
For The Week Of July 16th = Uptrend
INDICATORS
-
ADX Directional Indicators: Uptrend
Price & Volume Action: Uptrend
Elliott Wave Analysis: Mixed
The S&P500 ($SPX) rose 2.4% last week. The index sits approximately 5% and 12% above the 50 and 200-day moving averages, respectively. Having eclipsed the August high point, the next level of resistance dates back to the high on March 29, 2022 at 4637.
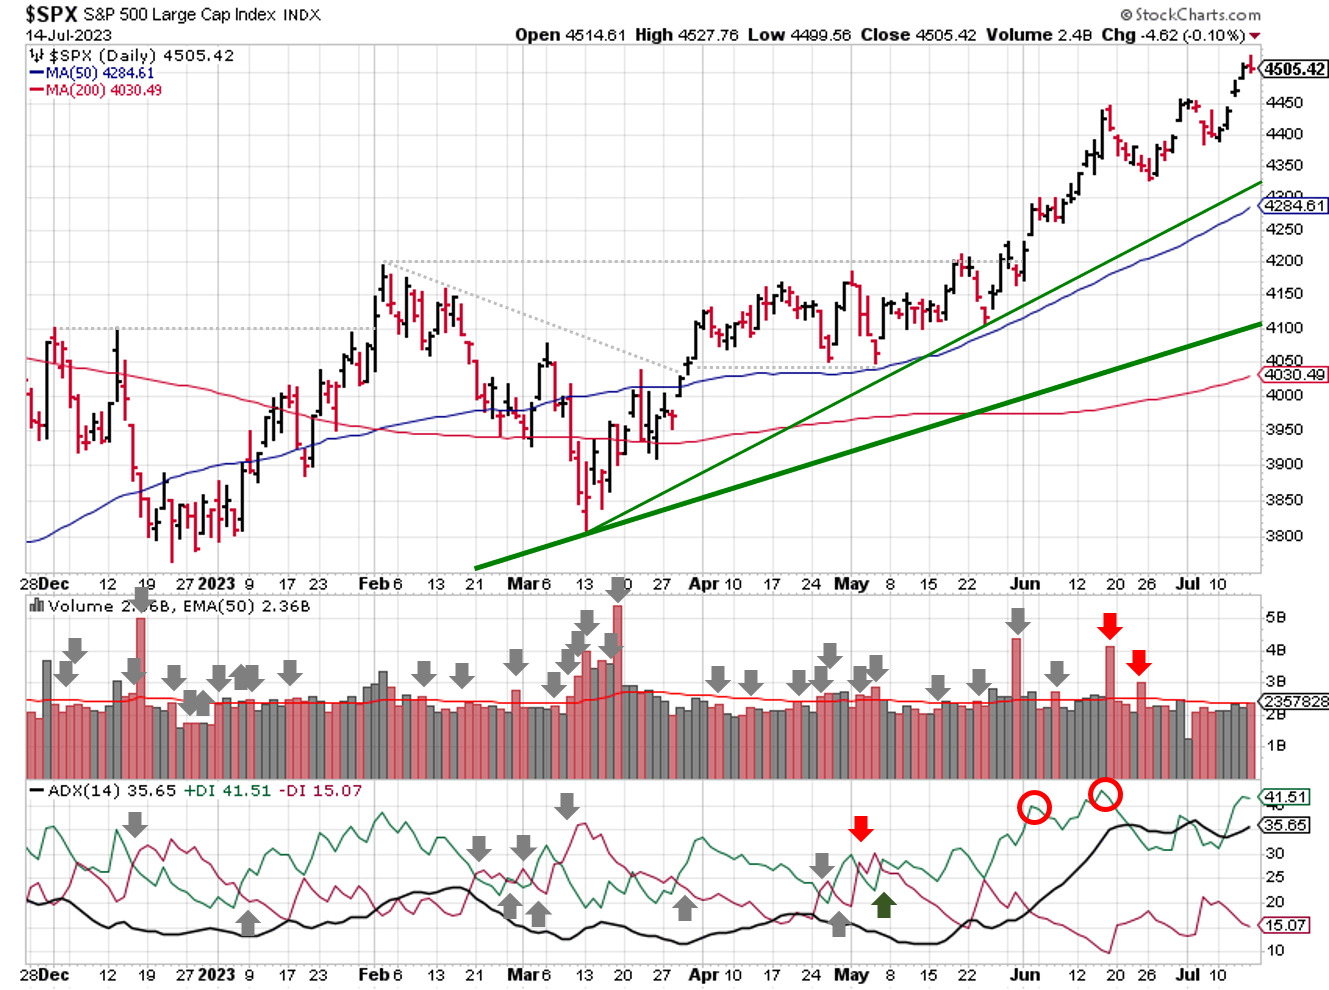
2023-07-16-SPX Trendline Analysis - Daily
No change in signal for the ADX. Price/volume also remains in an uptrend. No distribution days last week; Friday's volume was above average, but the price movement didn't qualify.
Elliott Wave is back under construction (i.e. mixed), with the SPX making reaching a "higher" high last week, and the MACD crossing over for the 4th time in the past 4 weeks.
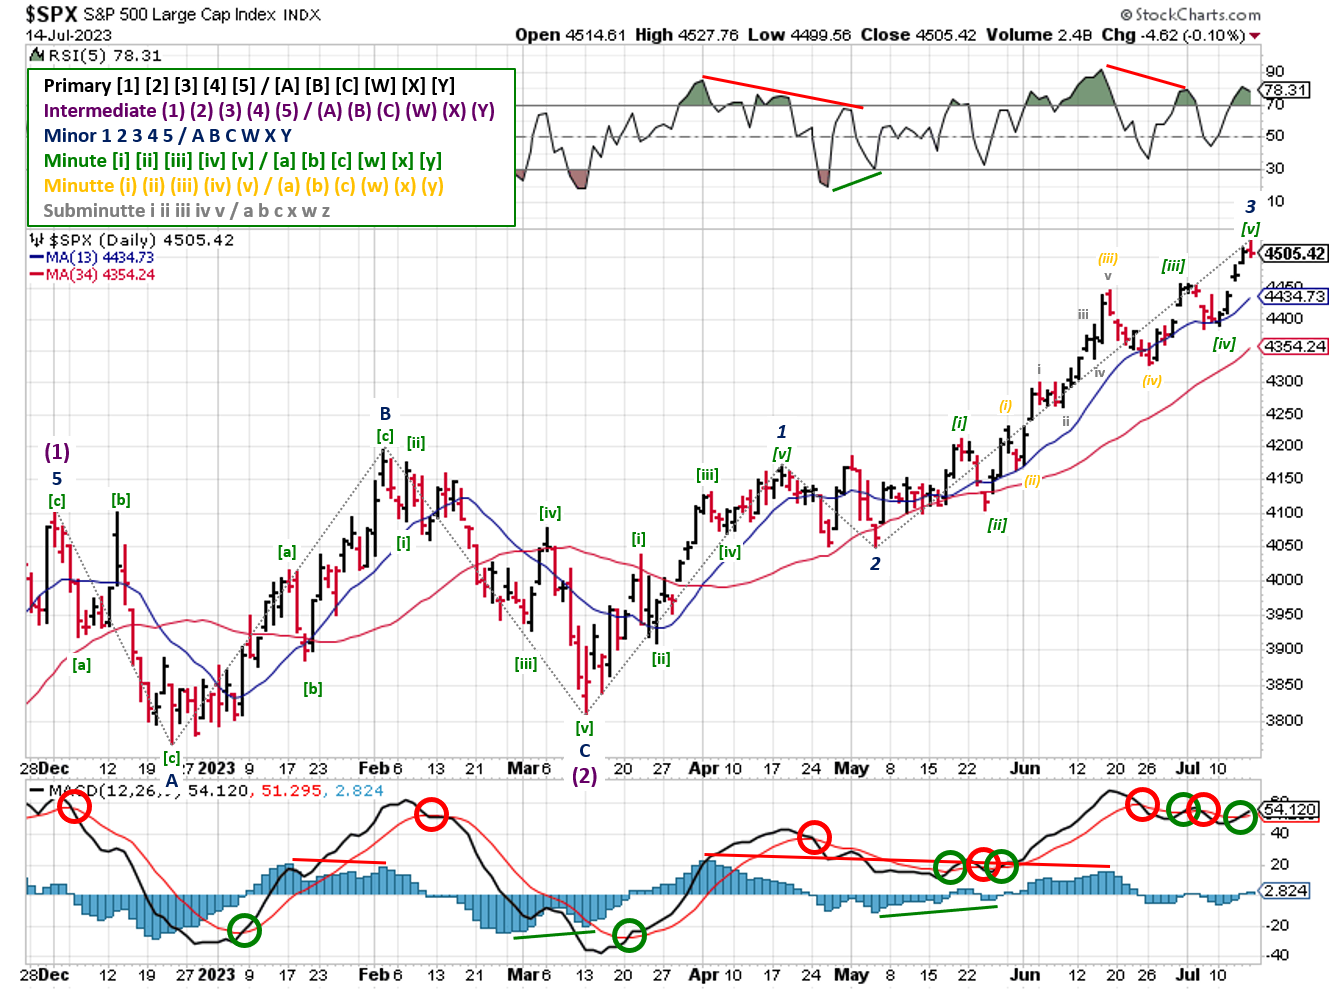
2023-07-16- SPX Elliott Wave Analysis - Daily - Primary 1 (Bullish)
The bullish view required a rethinking of the Minor wave counts in order to accommodate the rally since mid-May. The next major resistance level is the 1.618 Fibonacci extension for Minor 3 (4632), with support near the Minor 1 high at 4169.
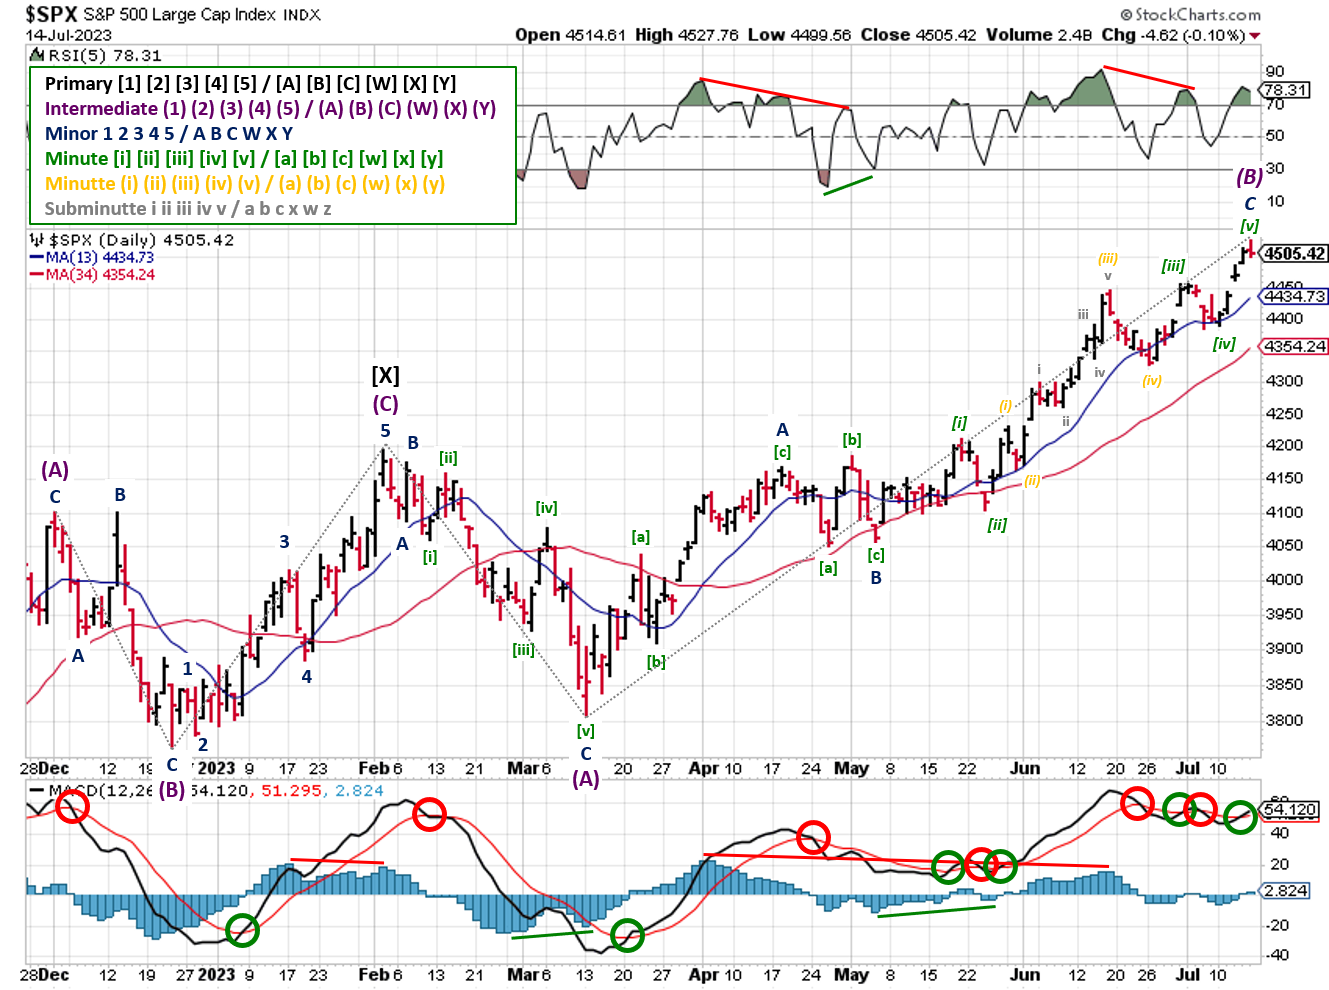
2023-07-16- SPX Elliott Wave Analysis - Daily - Primary Y (Bearish)
Meanwhile, incorporating the major inflection points from the bullish view allows the current bearish count to accommodate the latest move higher.
COMMENTARY
Government data continues to show inflation on the decline. Wednesday's headline CPI figure came in at 3% year over year, which was lower than expected and a far cry from last June's 9.1% reading. Core CPI remained elevated at 4.8%. The headline Producer price index showed a 0.1% gain verses last June, while core PPI rose 2.4% year over year.
Q2 earnings kicked off the same way that Q1 ended; headlines stating that earnings aren't as bad as feared, as companies continue to beat analyst estimates. At the same time, earnings growth continues to decline.
You might be wondering how can earning growth can be negative if companies are "beating" estimates. Here are 2 probable causes:
- Analysts revise their estimates/targets lower making them "easier" to beat
- Companies and analysts use "adjusted earnings", which remove certain expenses from GAAP figures.
Lowered expectations are easier to beat, especially after "adjustments" to expenses. These adjustments also make historical comparisons more difficult, since you have work with the companies financial statements to get an apples to apples comparison. Neither of those things makes for good headlines and/or 30 second soundbites.
According to Factset, earnings growth has been negative since mid-October of last year...the same time S&P500 bottomed. So the S&P500's gains during the past 9 months weren't driven by higher profits.
In terms of "valuation"or P/E ratio, the October reading for the S&P500 was 19-20 (Price to Equity using Trailing 12 months calculation). Last week, the reading was over 25. We know that earnings growth declined over the same period of time, so the "E" got smaller. So even if price or "P" didn't change, the P/E ratio increases.
The above is a math-based way of that stocks are less valuable than they were in October, because stocks have increased in price per share AND are earning less per share. This is one of the very few instances when "inflation" isn't considered a problem, because "stocks go up" is seen as a good thing.
This week, Retail sales for June, as well as updated housing market data, are on the way. Monthly options expiration occurs on Friday.
Best to Your Week!
P.S. If you find this research helpful, please tell a friend.
If you don't, tell an enemy.
Sources: Bloomberg, CNBC, Federal Reserve Bank of St. Louis, Hedgeye, U.S. Bureau of Economic Analysis, U.S. Bureau of Labor Statistics
Share this Post on:

How to Make Money in Stocks: A Winning System in Good Times and Bad.
It's one of my favorites.
I regularly share articles and other news of interest on:
Twitter (@investsafely)
Facebook (@InvestSafely)
LinkedIn (@Invest-Safely)
Instagram (@investsafely)
Invest Safely, LLC is an independent investment research and online financial media company. Use of Invest Safely, LLC and any other products available through invest-safely.com is subject to our Terms of Service and Privacy Policy. Not a recommendation to buy or sell any security.
Charts provided courtesy of stockcharts.com.
For historical Elliott Wave commentary and analysis, go to ELLIOTT WAVE lives on by Tony Caldaro. Current counts can be found at: Pretzel Logic, and 12345ABCDEWXYZ
Once a year, I review the market outlook signals as if they were a mechanical trading system, while pointing out issues and making adjustments. The goal is to give you to give you an example of how to analyze and continuously improve your own systems.
- 2015 Performance - Stock Market Outlook
- 2016 Performance - Stock Market Outlook
- 2017 Performance - Stock Market Outlook
- 2018 Performance - Stock Market Outlook
- 2019 Performance - Stock Market Outlook
- 2020 Performance - Stock Market Outlook
IMPORTANT DISCLOSURE INFORMATION
This material is for general communication and is provided for informational and/or educational purposes only. None of the content should be viewed as a suggestion that you take or refrain from taking any action nor as a recommendation for any specific investment product, strategy, or other such purpose. Certain information contained herein has been obtained from third-party sources believed to be reliable, but we cannot guarantee its accuracy or completeness.
To the extent that a reader has any questions regarding the applicability of any specific issue discussed above to his/her individual situation, he/she is encouraged to consult with the professional advisors of his/her choosing. Invest Safely, LLC is not a law firm, certified public accounting firm, or registered investment advisor and no portion of its content should be construed as legal, accounting, or investment advice.
The material is not to be construed as an offer or a recommendation to buy or sell a security nor is it to be construed as investment advice. Additionally, the material accessible through this website does not constitute a representation that the investments described herein are suitable or appropriate for any person.
Hypothetical Presentations:
Any referenced performance is “as calculated” using the referenced funds and has not been independently verified. This presentation does not discuss, directly or indirectly, the amount of the profits or losses, realized or unrealized, by any reader or contributor, from any specific funds or securities.
The author and/or any reader may have experienced materially different performance based upon various factors during the corresponding time periods. To the extent that any portion of the content reflects hypothetical results that were achieved by means of the retroactive application of a back-tested model, such results have inherent limitations, including:
Model results do not reflect the results of actual trading using assets, but were achieved by means of the retroactive application of the referenced models, certain aspects of which may have been designed with the benefit of hindsight
Back-tested performance may not reflect the impact that any material market or economic factors might have had on the use of a trading model if the model had been used during the period to actually manage assets
Actual investment results during the corresponding time periods may have been materially different from those portrayed in the model
Past performance may not be indicative of future results. Therefore, no one should assume that future performance will be profitable, or equal to any corresponding historical index.
The S&P 500 Composite Total Return Index (the "S&P") is a market capitalization-weighted index of 500 widely held stocks often used as a proxy for the stock market. Standard & Poor's chooses the member companies for the S&P based on market size, liquidity, and industry group representation. Included are the common stocks of industrial, financial, utility, and transportation companies. The S&P is not an index into which an investor can directly invest. The historical S&P performance results (and those of all other indices) are provided exclusively for comparison purposes only, so as to provide general comparative information to assist an individual in determining whether the performance of a specific portfolio or model meets, or continues to meet investment objective(s). The model and indices performance results do not reflect the impact of taxes.
Investing involves risk (even the “safe” kind)! Past performance does not guarantee or indicate future results. Different types of investments involve varying degrees of underlying risk. Therefore, do not assume that future performance of any specific investment or investment strategy be suitable for your portfolio or individual situation, will be profitable, equal any historical performance level(s), or prove successful (including the investments and/or investment strategies describe on this site).
Investing Process Links
Stabilize- Organize your $$$
- Manage your $$$
Plan
- Why You Invest
- Ways to Invest
- Where to Invest
- What to Invest In
Execute
- When to Invest
- How Much to Invest
- Buying & Selling
Monitor
- Track The Market
- Track Your Returns
Reflect & Adjust
- Improve Your Returns
- Adjust your Holdings
Popular Pages
- Jim Cramer- Personal Incomes Statements
- Hyperinflation
- Calculating Beta
- SMART Financial Goals
Blogroll
- Advisor Perspectives- Dividend Growth Investor
- Elliott Wave Lives On
- On My Radar | CMG Wealth
- Sure Dividend
- The Big Picture
- The Fat Pitch
- Thoughts from the Frontline
- Trader Feed
Sponsored Links
Invest Safely provides valuable, time-saving info about personal finance, money management, and investing.


