Stock Market Outlook
For The Week Of January 22nd = Uptrend
INDICATORS
-
ADX Directional Indicators: Uptrend
Price & Volume Action: Uptrend
Elliott Wave Analysis: Downtrend
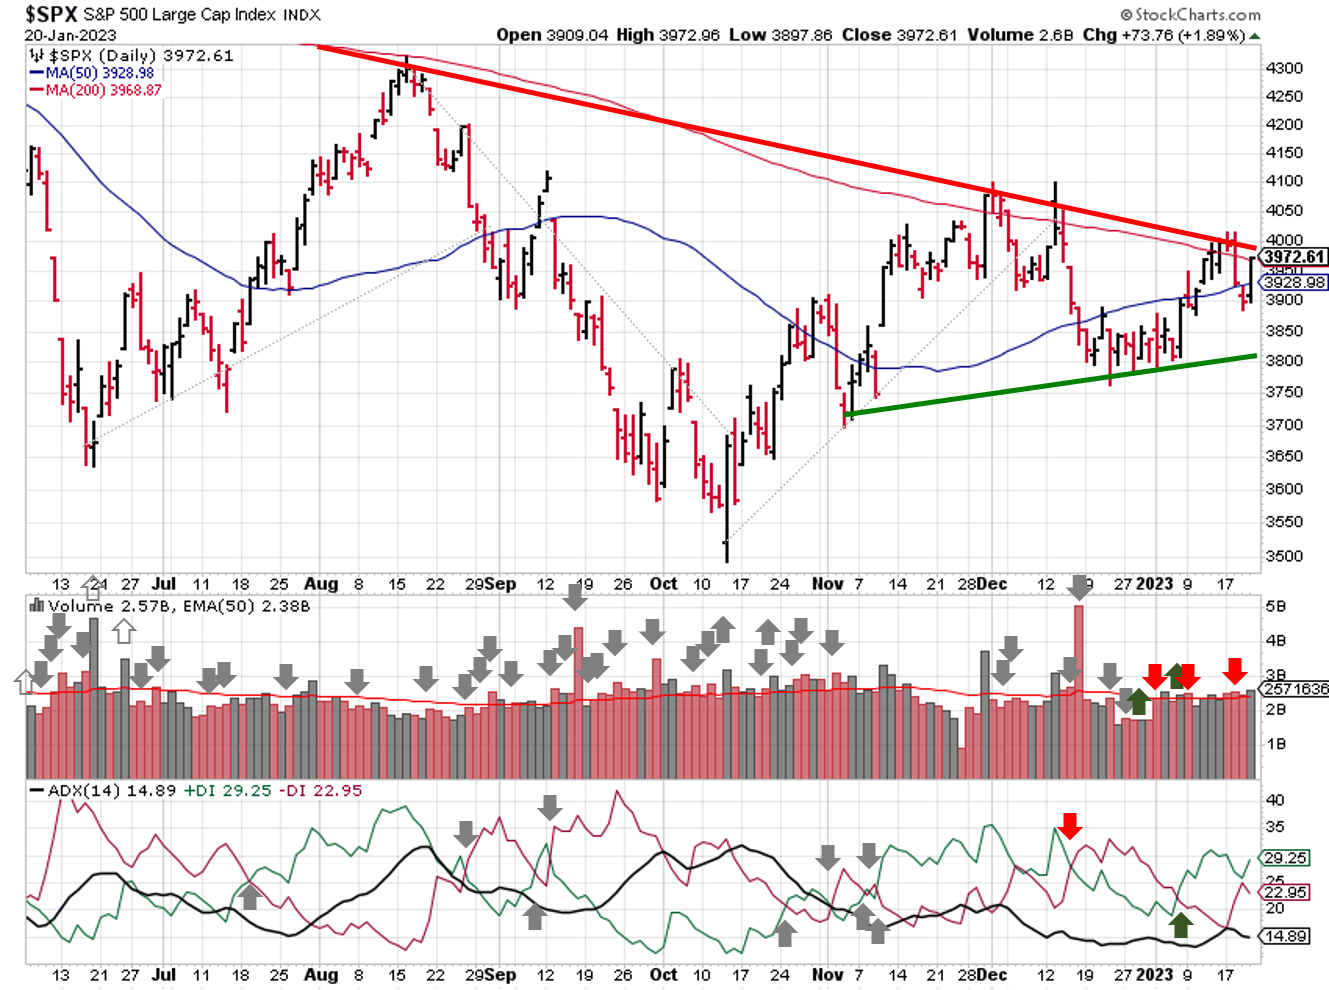
The S&P500 ($SPX) ended the week 0.7% lower, with the long-term downtrend continuing to act as resistance. Thanks to year-end consolidation, the SPX now has a shallow uptrend as well.
2023-01-22-SPX Trendline Analysis - Daily
In terms of moving averages, the 200-day continues to provided resistance, while the 50-day moving average switched to a support role since November.
The ADX and price volume signals continue to show bullish trends.
2023-01-22- SPX Elliott Wave Analysis - Daily - Primary Y
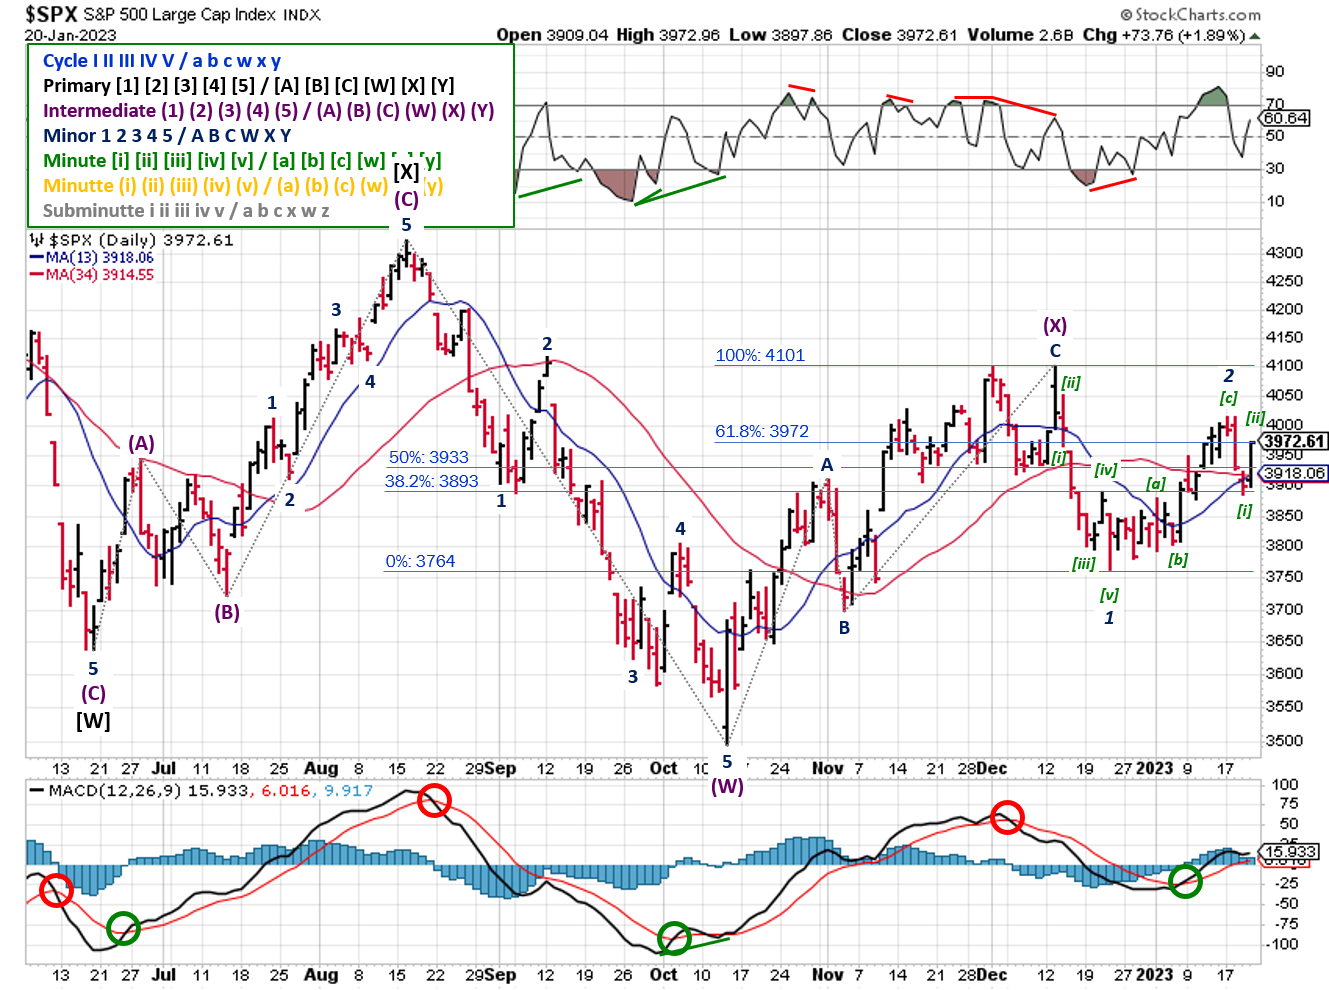
The Elliott Wave signal remains bearish. The current count suggests the beginning of a Minor 3, which would take the SPX back to the October low. On the flip side, rallying back above 4100 would be extremely bullish and require a relabeling.
COMMENTARY
Apologies for the short/late post last week. After a weekend trip, I returned to a cold home and a busted furnace. A good reminder that owning a home has a lot of positives, but it definitely meets the definition of a liability from a personal finance perspective.
The technical set-up (noted above) looks promising, but underlying economic data isn't keeping pace. For instance, Wednesday's sell-off coincided with the release of December retail data, which showed sales falling 1.1% month over month. Retailers like Macy's ($M), Kohl's ($KSS), Nordstrom ($JWN), etc., rely heavily on the holiday season for annual profitability; so much so that "Black Friday" gets its name from the expectation that it's the day that puts retailers into the "black" for the year (i.e. negative numbers / losses in red ink, positive numbers / profits in black ink). This year, the hope was that holiday sales would eliminate high inventory levels...profitability would be a welcome bonus.
You probably heard something about the U.S. debt-ceiling last week as well. On Thursday, the Treasury announced that the U.S. exceeded its self-imposed debt limit of $31.4 trillion. Now, the Treasury will enact so-called "extraordinary measures," to meet financial obligations. Per the Brookings Institute, the U.S. debt ceiling has been raised 20 times since 2001...basically once a year. Since the debt ceiling comes from Congress, there's a lot of rhetoric and posturing until the very last minute and then a deal gets pushed through. With regard to investing, it's basically a nothing-burger until the June/July timeframe.
And on Friday, monthly options expired. Normally, quarterly option expiration is all that's worth mentioning (i.e. triple/quadruple witching days), but the influence of non-quarterly opex increased dramatically over the past year. In fact, $1.3 trillion worth of options were in play on Friday, which is the biggest non-quarterly expiration EVER. That's a lot of leverage, and definitely impacts volume/price movements.
Behind the scenes, so to speak, YOLO option trading has gone from retail traders to institutions, from WallStreetBets to Wall Street. Market makers and institutions are exploiting a loophole account financing using index options; specifically the daily contracts, which are called Zero Days 'Til Expiration or "0DTE".
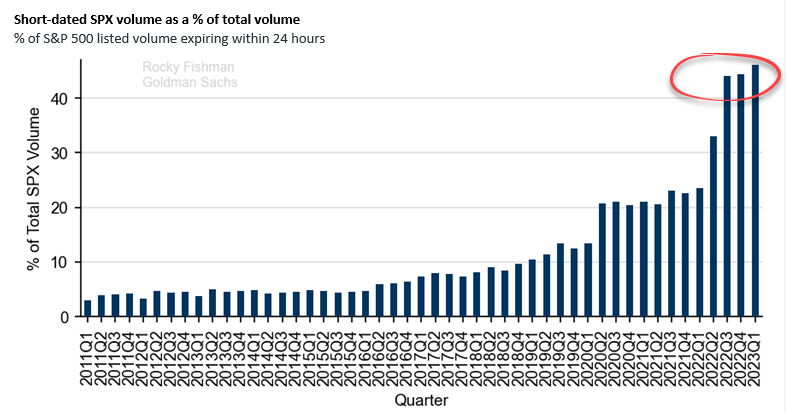
Source: Rocky Fishman - Goldman Sachs
If an institution opens and closes a trade intraday, no additional collateral is required because the account balance doesn't change at the end of the day when the books are closed. In the end, it's another form of leverage, used to buy a levered instrument, to exploit intraday price movement, which ultimately moves intraday prices thanks to the volume of trades...what could go wrong?
Earnings season is in full swing this week, after an underwhelming start. So far, ~10% of the S&P500 reported Q4 results. Sales are up ~7%, while earnings are down ~6%. Those figures broadly align with the higher prices / higher costs theme resulting from inflation. On Friday, we get December data for Consumption Expenditures (PCE); the Fed's preferred measure of inflation.
Best To Your Week!
P.S. If you find this research helpful, please tell a friend.
If you don't, tell an enemy.
Sources: Bloomberg, CNBC, Federal Reserve Bank of St. Louis, Hedgeye, U.S. Bureau of Economic Analysis, U.S. Bureau of Labor Statistics
Share this Post on:

How to Make Money in Stocks: A Winning System in Good Times and Bad.
It's one of my favorites.
I regularly share articles and other news of interest on:
Twitter (@investsafely)
Facebook (@InvestSafely)
LinkedIn (@Invest-Safely)
Instagram (@investsafely)
Invest Safely, LLC is an independent investment research and online financial media company. Use of Invest Safely, LLC and any other products available through invest-safely.com is subject to our Terms of Service and Privacy Policy. Not a recommendation to buy or sell any security.
Charts provided courtesy of stockcharts.com.
For historical Elliott Wave commentary and analysis, go to ELLIOTT WAVE lives on by Tony Caldaro. Current counts can be found at: Pretzel Logic, and 12345ABCDEWXYZ
Once a year, I review the market outlook signals as if they were a mechanical trading system, while pointing out issues and making adjustments. The goal is to give you to give you an example of how to analyze and continuously improve your own systems.
- 2015 Performance - Stock Market Outlook
- 2016 Performance - Stock Market Outlook
- 2017 Performance - Stock Market Outlook
- 2018 Performance - Stock Market Outlook
- 2019 Performance - Stock Market Outlook
- 2020 Performance - Stock Market Outlook
IMPORTANT DISCLOSURE INFORMATION
This material is for general communication and is provided for informational and/or educational purposes only. None of the content should be viewed as a suggestion that you take or refrain from taking any action nor as a recommendation for any specific investment product, strategy, or other such purpose. Certain information contained herein has been obtained from third-party sources believed to be reliable, but we cannot guarantee its accuracy or completeness.
To the extent that a reader has any questions regarding the applicability of any specific issue discussed above to his/her individual situation, he/she is encouraged to consult with the professional advisors of his/her choosing. Invest Safely, LLC is not a law firm, certified public accounting firm, or registered investment advisor and no portion of its content should be construed as legal, accounting, or investment advice.
The material is not to be construed as an offer or a recommendation to buy or sell a security nor is it to be construed as investment advice. Additionally, the material accessible through this website does not constitute a representation that the investments described herein are suitable or appropriate for any person.
Hypothetical Presentations:
Any referenced performance is “as calculated” using the referenced funds and has not been independently verified. This presentation does not discuss, directly or indirectly, the amount of the profits or losses, realized or unrealized, by any reader or contributor, from any specific funds or securities.
The author and/or any reader may have experienced materially different performance based upon various factors during the corresponding time periods. To the extent that any portion of the content reflects hypothetical results that were achieved by means of the retroactive application of a back-tested model, such results have inherent limitations, including:
Model results do not reflect the results of actual trading using assets, but were achieved by means of the retroactive application of the referenced models, certain aspects of which may have been designed with the benefit of hindsight
Back-tested performance may not reflect the impact that any material market or economic factors might have had on the use of a trading model if the model had been used during the period to actually manage assets
Actual investment results during the corresponding time periods may have been materially different from those portrayed in the model
Past performance may not be indicative of future results. Therefore, no one should assume that future performance will be profitable, or equal to any corresponding historical index.
The S&P 500 Composite Total Return Index (the "S&P") is a market capitalization-weighted index of 500 widely held stocks often used as a proxy for the stock market. Standard & Poor's chooses the member companies for the S&P based on market size, liquidity, and industry group representation. Included are the common stocks of industrial, financial, utility, and transportation companies. The S&P is not an index into which an investor can directly invest. The historical S&P performance results (and those of all other indices) are provided exclusively for comparison purposes only, so as to provide general comparative information to assist an individual in determining whether the performance of a specific portfolio or model meets, or continues to meet investment objective(s). The model and indices performance results do not reflect the impact of taxes.
Investing involves risk (even the “safe” kind)! Past performance does not guarantee or indicate future results. Different types of investments involve varying degrees of underlying risk. Therefore, do not assume that future performance of any specific investment or investment strategy be suitable for your portfolio or individual situation, will be profitable, equal any historical performance level(s), or prove successful (including the investments and/or investment strategies describe on this site).
Investing Process Links
Stabilize- Organize your $$$
- Manage your $$$
Plan
- Why You Invest
- Ways to Invest
- Where to Invest
- What to Invest In
Execute
- When to Invest
- How Much to Invest
- Buying & Selling
Monitor
- Track The Market
- Track Your Returns
Reflect & Adjust
- Improve Your Returns
- Adjust your Holdings
Popular Pages
- Jim Cramer- Personal Incomes Statements
- Hyperinflation
- Calculating Beta
- SMART Financial Goals
Blogroll
- Advisor Perspectives- Dividend Growth Investor
- Elliott Wave Lives On
- On My Radar | CMG Wealth
- Sure Dividend
- The Big Picture
- The Fat Pitch
- Thoughts from the Frontline
- Trader Feed
Sponsored Links
Invest Safely provides valuable, time-saving info about personal finance, money management, and investing.


