Stock Market Outlook
For The Week Of December 11th = Uptrend
INDICATORS
-
ADX Directional Indicators: Mixed
Price & Volume Action: Uptrend
Elliott Wave Analysis: Downtrend
The S&P500 ($SPX) fell 3.4% last week, dropping below the 200-day moving average. The index failed to breakthrough a long-term, bearish trendline dating back to mid-January, instead breaking the recent bullish trendline from October-November.
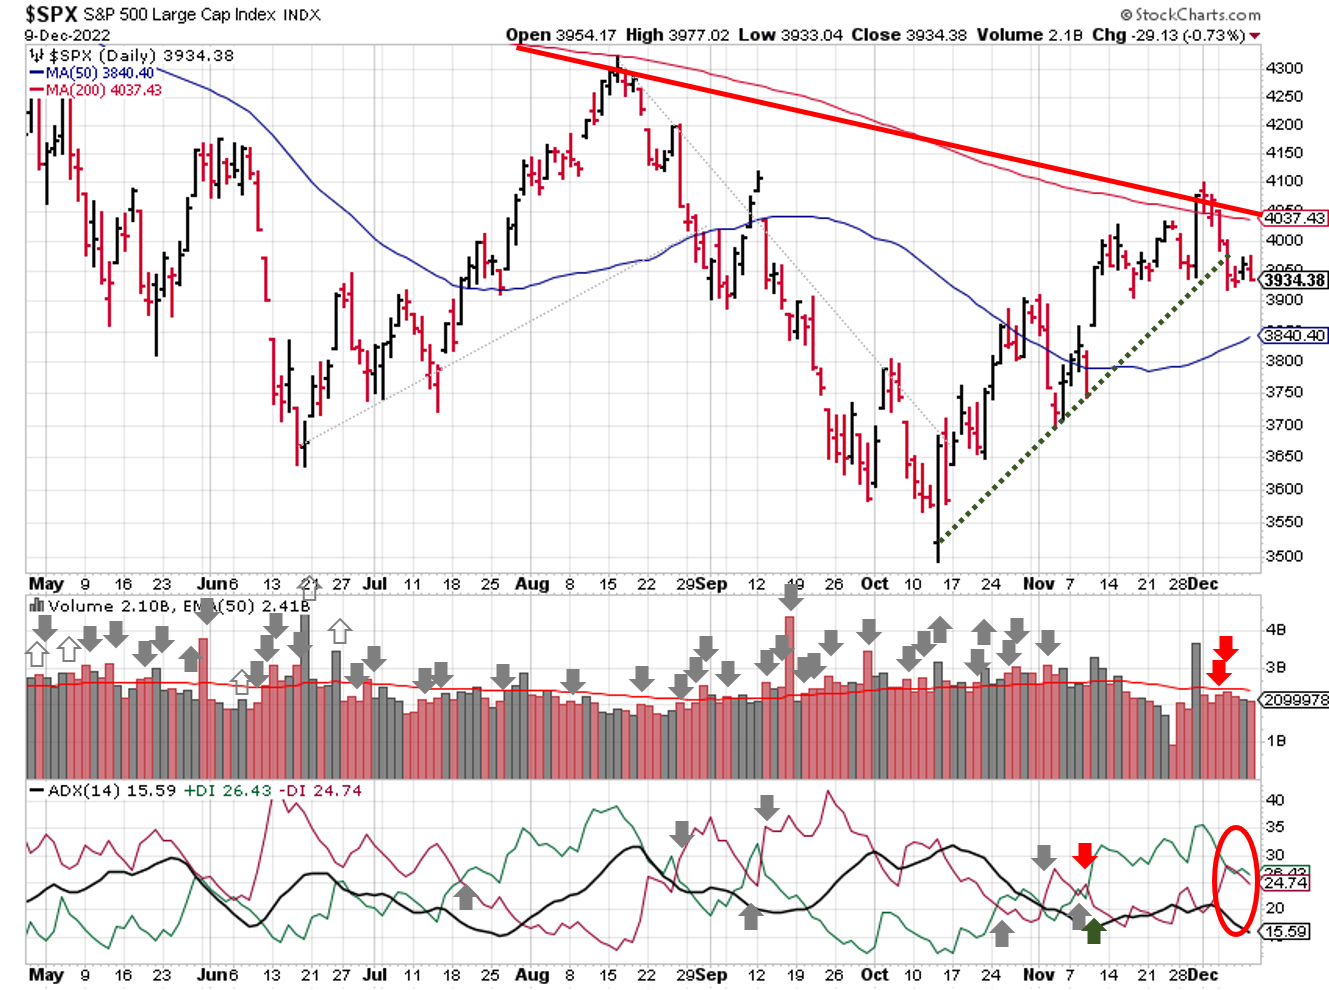
2022-12-11-SPX Trendline Analysis - Daily
The ADX shifted to mixed, with DI indicators essentially overlapping and the indicator itself falling below 20. It’s as close to a bearish as you can get without flipping the signal.
Price/Volume shows a small amount of distribution last week. The signal is still in an uptrend per the criteria, but trading action is similar to the beginning of last downtrend (mid-August).
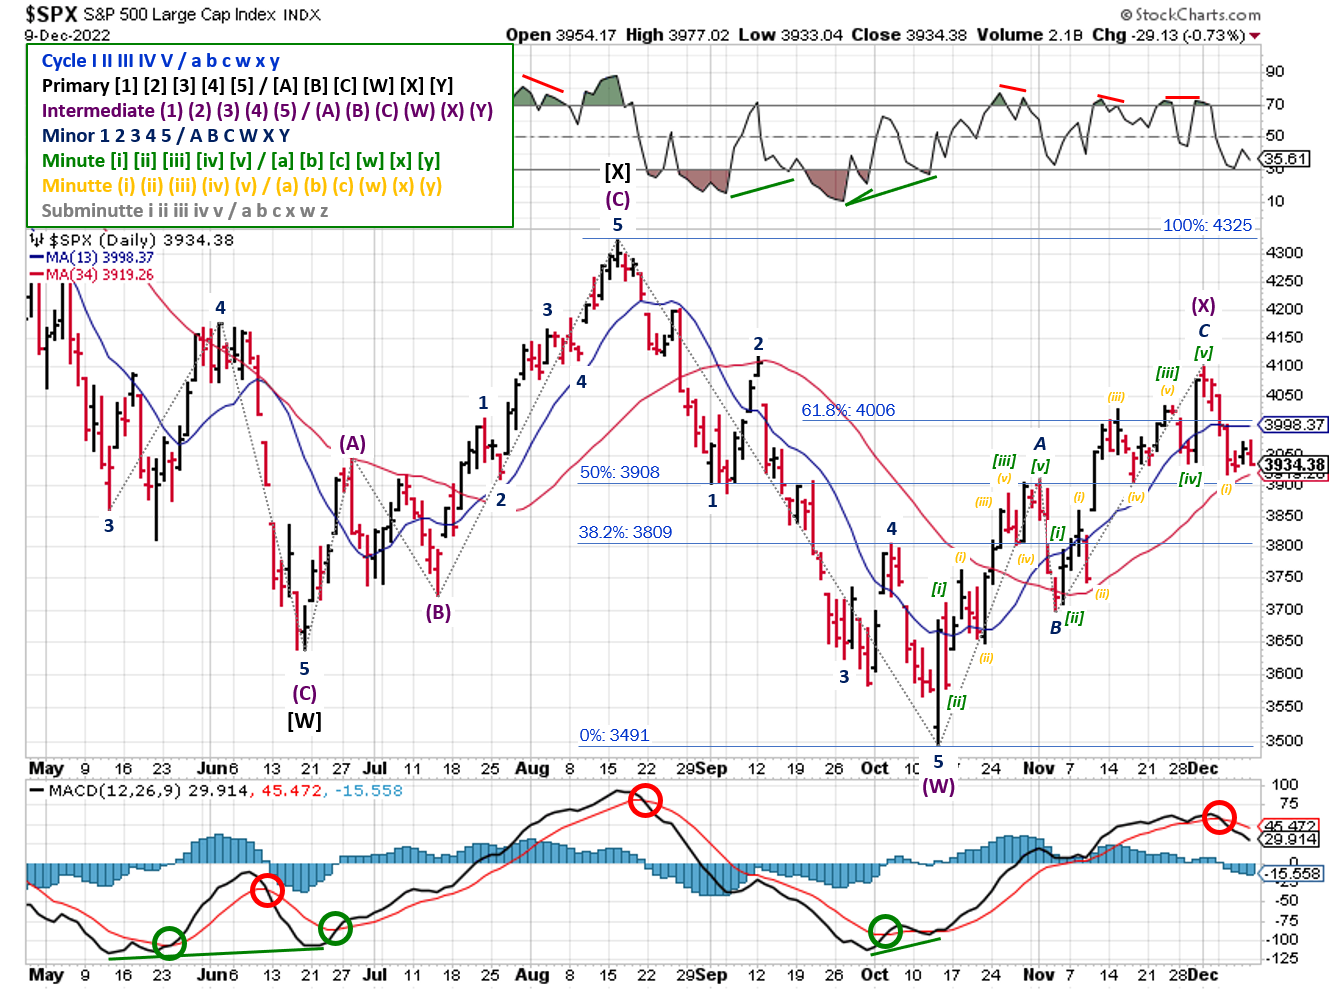
2022-12-11- SPX Elliott Wave Analysis - Daily - Primary Y
Elliott Wave remains bearish, as it has for the entire rally. The ending diagonal pattern (mentioned last week) fell apart when the SPX dropped back to 3900 and the 34-day moving average. Adding the negative MACD cross over and RSI divergence added insult to injury.
Upon further review, I overlooked a subdividing Minute [iii] wave (mid-November). A similar pattern emerged in early October during the Minor A wave: volatile, 1-day waves for Minute [i] and [ii], followed by a subdivided Minute [iii]. The fractal nature of market price movements means patterns often repeat themselves, and that's the case here as well.
The refreshed count reveals the 5-wave Minute pattern ended at the high on December 1st, which also marks the end of a Minor C. Most importantly, the completion of the 3-wave Minor pattern marks the end of the Intermediate (X), counter-trend rally.
Labeling reversals in market direction is challenging. At the moment, last week's price action matches a pattern that played out the week of August 22, so Tuesday's low is likely the first Minute wave of the next phase of the bear market.
COMMENTARY
Last week's November Producer Price Index (PPI) data was higher than expected on a month over month basis, but shows inflation pressure easing from a year over year view.
Thursday's PCE data showed that the Fed's favorite inflation measure remained high in the month of October, although it did retreat from September's increase.
| Year over Year Change (%) | ||||||
| Jun | Jul | Aug | Sept | Oct | Nov | |
| PPI | 11.2 | 9.7 | 8.7 | 8.5 | 8.1 | 7.4 |
| Core PPI | 6.4 | 5.8 | 5.6 | 5.6 | 5.4 | 4.9 |
This is good news for Main Street; PPI measures "the average change in the selling prices received by domestic producers for their output over time", so we're paying less for goods and services.
This is bad news for Wall Street; falling PPI generally means lower earnings for public companies, because: (Price - Cost) * Quantity = Profit. Companies reduce price to maintain or increase volume, which can be done much faster than reducing costs (e.g. labor or supply chain contracts). Referencing the final point from last week's post,
- ...[Q3] profit margins (earnings) shrank as companies accounted for higher costs for raw materials, debt financing, and labor. Those costs will ultimately determine the type of recession we experience in 2023.
More data is on the way this week, so buckle up! Tuesday (Dec 13th), we get CPI data for November. Wednesday (Dec 14th), we get the Fed's decision on the latest interest rate hike at 2:00pm EST, followed by the FOMC press conference at 2:30pm. U.S. retail sales data for November hits the wires Thursday.
And last but not least, Friday is weekly, monthly, and quarterly option expiration.
Some food for thought regarding price patterns mentioned above: After the last market top in mid-August, the market fell below the 13-day moving average on increased but below-average trading volume. That sell-off generated a negative cross-over in the MACD indicator. Then the SPX rallied slightly, only to sell-off on August 26 in response to hawkish comments from Powell at the Fed’s Jackson Hole press conference. Entering this week, you'd be forgiven if you had a sense of deja vu; the only thing we're missing is a low volume rally followed by a hawkish speech from the Fed...
Best To Your Week!
P.S. If you find this research helpful, please tell a friend.
If you don't, tell an enemy.
Sources: Bloomberg, CNBC, Federal Reserve Bank of St. Louis, Hedgeye, U.S. Bureau of Economic Analysis, U.S. Bureau of Labor Statistics
Share this Post on:

How to Make Money in Stocks: A Winning System in Good Times and Bad.
It's one of my favorites.
I regularly share articles and other news of interest on:
Twitter (@investsafely)
Facebook (@InvestSafely)
LinkedIn (@Invest-Safely)
Instagram (@investsafely)
Invest Safely, LLC is an independent investment research and online financial media company. Use of Invest Safely, LLC and any other products available through invest-safely.com is subject to our Terms of Service and Privacy Policy. Not a recommendation to buy or sell any security.
Charts provided courtesy of stockcharts.com.
For historical Elliott Wave commentary and analysis, go to ELLIOTT WAVE lives on by Tony Caldaro. Current counts can be found at: Pretzel Logic, and 12345ABCDEWXYZ
Once a year, I review the market outlook signals as if they were a mechanical trading system, while pointing out issues and making adjustments. The goal is to give you to give you an example of how to analyze and continuously improve your own systems.
- 2015 Performance - Stock Market Outlook
- 2016 Performance - Stock Market Outlook
- 2017 Performance - Stock Market Outlook
- 2018 Performance - Stock Market Outlook
- 2019 Performance - Stock Market Outlook
- 2020 Performance - Stock Market Outlook
IMPORTANT DISCLOSURE INFORMATION
This material is for general communication and is provided for informational and/or educational purposes only. None of the content should be viewed as a suggestion that you take or refrain from taking any action nor as a recommendation for any specific investment product, strategy, or other such purpose. Certain information contained herein has been obtained from third-party sources believed to be reliable, but we cannot guarantee its accuracy or completeness.
To the extent that a reader has any questions regarding the applicability of any specific issue discussed above to his/her individual situation, he/she is encouraged to consult with the professional advisors of his/her choosing. Invest Safely, LLC is not a law firm, certified public accounting firm, or registered investment advisor and no portion of its content should be construed as legal, accounting, or investment advice.
The material is not to be construed as an offer or a recommendation to buy or sell a security nor is it to be construed as investment advice. Additionally, the material accessible through this website does not constitute a representation that the investments described herein are suitable or appropriate for any person.
Hypothetical Presentations:
Any referenced performance is “as calculated” using the referenced funds and has not been independently verified. This presentation does not discuss, directly or indirectly, the amount of the profits or losses, realized or unrealized, by any reader or contributor, from any specific funds or securities.
The author and/or any reader may have experienced materially different performance based upon various factors during the corresponding time periods. To the extent that any portion of the content reflects hypothetical results that were achieved by means of the retroactive application of a back-tested model, such results have inherent limitations, including:
Model results do not reflect the results of actual trading using assets, but were achieved by means of the retroactive application of the referenced models, certain aspects of which may have been designed with the benefit of hindsight
Back-tested performance may not reflect the impact that any material market or economic factors might have had on the use of a trading model if the model had been used during the period to actually manage assets
Actual investment results during the corresponding time periods may have been materially different from those portrayed in the model
Past performance may not be indicative of future results. Therefore, no one should assume that future performance will be profitable, or equal to any corresponding historical index.
The S&P 500 Composite Total Return Index (the "S&P") is a market capitalization-weighted index of 500 widely held stocks often used as a proxy for the stock market. Standard & Poor's chooses the member companies for the S&P based on market size, liquidity, and industry group representation. Included are the common stocks of industrial, financial, utility, and transportation companies. The S&P is not an index into which an investor can directly invest. The historical S&P performance results (and those of all other indices) are provided exclusively for comparison purposes only, so as to provide general comparative information to assist an individual in determining whether the performance of a specific portfolio or model meets, or continues to meet investment objective(s). The model and indices performance results do not reflect the impact of taxes.
Investing involves risk (even the “safe” kind)! Past performance does not guarantee or indicate future results. Different types of investments involve varying degrees of underlying risk. Therefore, do not assume that future performance of any specific investment or investment strategy be suitable for your portfolio or individual situation, will be profitable, equal any historical performance level(s), or prove successful (including the investments and/or investment strategies describe on this site).
Investing Process Links
Stabilize- Organize your $$$
- Manage your $$$
Plan
- Why You Invest
- Ways to Invest
- Where to Invest
- What to Invest In
Execute
- When to Invest
- How Much to Invest
- Buying & Selling
Monitor
- Track The Market
- Track Your Returns
Reflect & Adjust
- Improve Your Returns
- Adjust your Holdings
Popular Pages
- Jim Cramer- Personal Incomes Statements
- Hyperinflation
- Calculating Beta
- SMART Financial Goals
Blogroll
- Advisor Perspectives- Dividend Growth Investor
- Elliott Wave Lives On
- On My Radar | CMG Wealth
- Sure Dividend
- The Big Picture
- The Fat Pitch
- Thoughts from the Frontline
- Trader Feed
Sponsored Links
Invest Safely provides valuable, time-saving info about personal finance, money management, and investing.


