Stock Market Outlook
For The Week Of November 13th = Uptrend
INDICATORS
-
ADX Directional Indicators: Uptrend
Price & Volume Action: Uptrend
Elliott Wave Analysis: Downtrend
- Given the current level of the VIX (below 30, above 20), don't be surprised if the signals whipsaw back and forth.
The S&P500 ($SPX) rose almost 6% for the week, but technology stocks were the real winners with the NASDAQ ($COMP) jumping 8.1%!
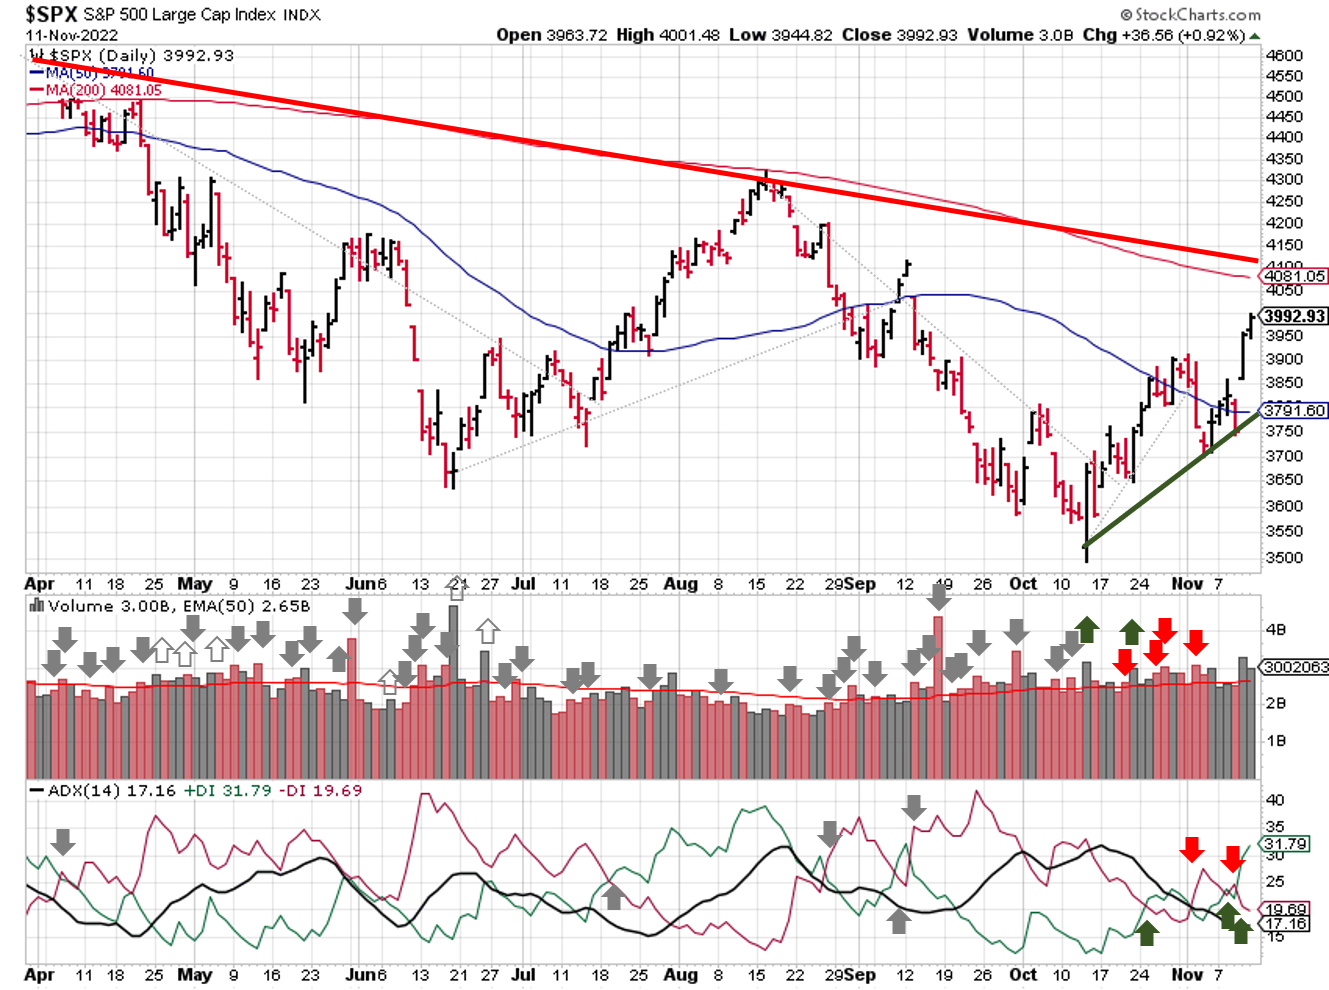
2022-11-13-SPX Trendline Analysis - Daily
The ADX started last week in bearish territory, flipped to bullish on Tuesday, back to bearish on Wednesday, then back to bullish on Thursday.
Price and volume also starts the week in uptrend territory, after a strong move past the 50-day moving average on higher trading volume.
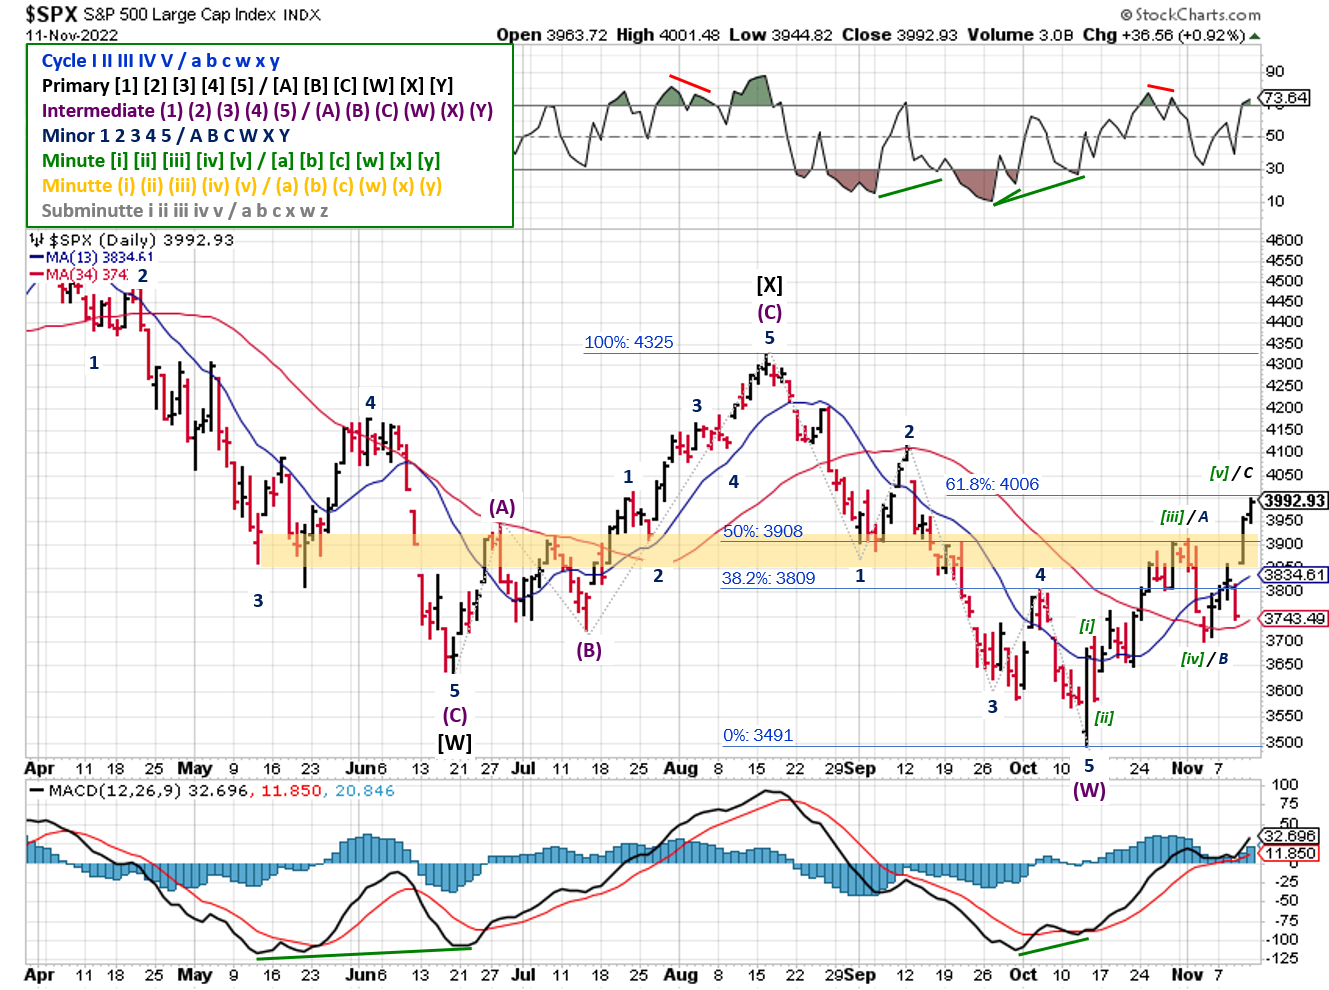
2022-11-13- SPX Elliott Wave Analysis - Daily - Primary Y
Elliott Wave analysis shows the SPX just below the the 62% retracement target mentioned last week, suggesting the counter-trend rally is nearly complete.
COMMENTARY
Last week was certainly a long year! U.S. mid-term elections, CPI data for October, and the blowup of another cryptocurrency exchange were just a few of the highlights.
Despite all the warnings, no "red wave" materialized in the U.S. elections. Impact to markets? Minimal.
CPI data showed October inflation rose 7.7% year over year, which was lower than expected. Core inflation rose 6.3%, which was also lower than expected. To say that the market impact was positive is an understatement.
Then there's crypto; specifically the implosion of FTX. FTX is an exchange used to trade various cryptocurrencies, and it filed for bankruptcy protection after experiencing the equivalent of a bank run. Since it's not a bank, that's a problem.
Many assume, incorrectly, that FTX (and other exchanges) provide some level of protection like brokerages and banks (read more about FDIC and SIPC protections here). They don't.
Retail investors using the platform do so at their own risk; no guarantees, no deposit insurance, nothing. Instead, traders essentially loaned their money to FTX, in return for the opportunity to trade crypto. And FTX did as they pleased with those "loans": salaries, investments, expenses, loans, whatever.
Last week, too many people decided to take back those loans at the same time. FTX couldn't meet those requests, making them insolvent. At the same time, the value of their assets (mainly cryptocurrencies) plummeted, forcing the company to file for bankruptcy protection.
We saw similar movies earlier in the year, when other crypto exchanges blew up (e.g. Celsius, Voyager). The "losers" are a relatively small number of retail investors like you and me. Usually, there's a few articles, the call for regulation, and then we collectively move on. Outside of the cryptocurrency markets, the direct impact is negligible.
But this time might actually be different! Various officials, "experts", and celebrities were involved, whether they bought equity, received funding, and/or marketed the FTX trading platform...names you'll recognize from the news, social media, CNBC, even the government. And they'll all be looking to point fingers!
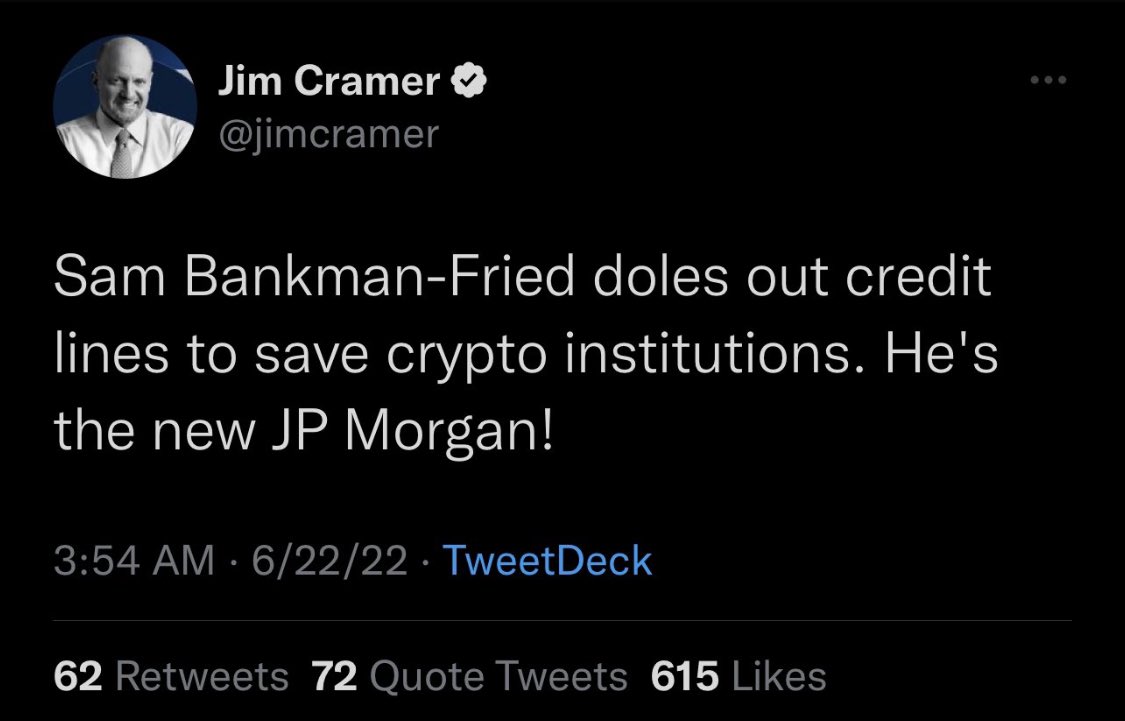
Using celebrity is a form of "classical conditioning". You attribute the qualities of celebrity to the brand; in this case FTX and or it's founder Sam Bankman-Fried. That type of marketing leads to a false sense of security and poor decision making. We don't know (yet) is how many institutions, non-retail investors, and creditors were caught up in the marketing and will need to take a loss?
I've seen one so far: the Ontario Teacher's Pension Fund. Pension funds shouldn't have been invested in as asset class as volatile as cryptocurrencies, let alone shares of an unregulated exchange in the Bahamas. In all likelihood, the decision to do business with FTX will result in losses in the millions of dollars.
That loss, and others like it, will be harder to move on from, let alone ignore. How much more spillover will there be? We don't know yet...and that is the scary part.
It's easy to experience the fear of missing out when stocks rocket higher. And that's especially true during a bear market. This is your reminder to pause, recenter, and execute your process (e.g. your own OODA loop - H/T Hedgeye). History tells us to proceed with caution and tight stop losses, as last week's moves aren't typical of bull markets.
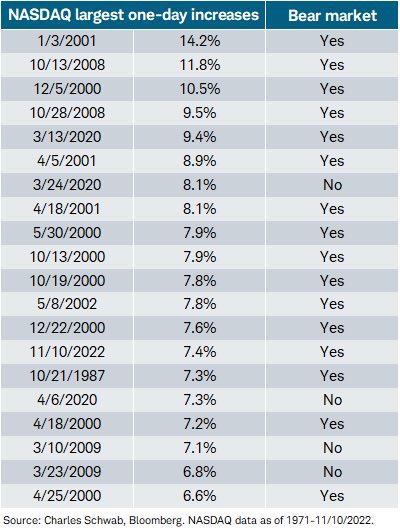
https://twitter.com/LizAnnSonders/status/1591033419127214085
Best To Your Week!
P.S. If you find this research helpful, please tell a friend.
If you don't, tell an enemy.
Sources: Bloomberg, CNBC, Federal Reserve Bank of St. Louis, Hedgeye, U.S. Bureau of Economic Analysis, U.S. Bureau of Economic Analysis
Share this Post on:

How to Make Money in Stocks: A Winning System in Good Times and Bad.
It's one of my favorites.
I regularly share articles and other news of interest on:
Twitter (@investsafely)
Facebook (@InvestSafely)
LinkedIn (@Invest-Safely)
Instagram (@investsafely)
Invest Safely, LLC is an independent investment research and online financial media company. Use of Invest Safely, LLC and any other products available through invest-safely.com is subject to our Terms of Service and Privacy Policy. Not a recommendation to buy or sell any security.
Charts provided courtesy of stockcharts.com.
For historical Elliott Wave commentary and analysis, go to ELLIOTT WAVE lives on by Tony Caldaro. Current counts can be found at: Pretzel Logic, and 12345ABCDEWXYZ
Once a year, I review the market outlook signals as if they were a mechanical trading system, while pointing out issues and making adjustments. The goal is to give you to give you an example of how to analyze and continuously improve your own systems.
- 2015 Performance - Stock Market Outlook
- 2016 Performance - Stock Market Outlook
- 2017 Performance - Stock Market Outlook
- 2018 Performance - Stock Market Outlook
- 2019 Performance - Stock Market Outlook
- 2020 Performance - Stock Market Outlook
IMPORTANT DISCLOSURE INFORMATION
This material is for general communication and is provided for informational and/or educational purposes only. None of the content should be viewed as a suggestion that you take or refrain from taking any action nor as a recommendation for any specific investment product, strategy, or other such purpose. Certain information contained herein has been obtained from third-party sources believed to be reliable, but we cannot guarantee its accuracy or completeness.
To the extent that a reader has any questions regarding the applicability of any specific issue discussed above to his/her individual situation, he/she is encouraged to consult with the professional advisors of his/her choosing. Invest Safely, LLC is not a law firm, certified public accounting firm, or registered investment advisor and no portion of its content should be construed as legal, accounting, or investment advice.
The material is not to be construed as an offer or a recommendation to buy or sell a security nor is it to be construed as investment advice. Additionally, the material accessible through this website does not constitute a representation that the investments described herein are suitable or appropriate for any person.
Hypothetical Presentations:
Any referenced performance is “as calculated” using the referenced funds and has not been independently verified. This presentation does not discuss, directly or indirectly, the amount of the profits or losses, realized or unrealized, by any reader or contributor, from any specific funds or securities.
The author and/or any reader may have experienced materially different performance based upon various factors during the corresponding time periods. To the extent that any portion of the content reflects hypothetical results that were achieved by means of the retroactive application of a back-tested model, such results have inherent limitations, including:
Model results do not reflect the results of actual trading using assets, but were achieved by means of the retroactive application of the referenced models, certain aspects of which may have been designed with the benefit of hindsight
Back-tested performance may not reflect the impact that any material market or economic factors might have had on the use of a trading model if the model had been used during the period to actually manage assets
Actual investment results during the corresponding time periods may have been materially different from those portrayed in the model
Past performance may not be indicative of future results. Therefore, no one should assume that future performance will be profitable, or equal to any corresponding historical index.
The S&P 500 Composite Total Return Index (the "S&P") is a market capitalization-weighted index of 500 widely held stocks often used as a proxy for the stock market. Standard & Poor's chooses the member companies for the S&P based on market size, liquidity, and industry group representation. Included are the common stocks of industrial, financial, utility, and transportation companies. The S&P is not an index into which an investor can directly invest. The historical S&P performance results (and those of all other indices) are provided exclusively for comparison purposes only, so as to provide general comparative information to assist an individual in determining whether the performance of a specific portfolio or model meets, or continues to meet investment objective(s). The model and indices performance results do not reflect the impact of taxes.
Investing involves risk (even the “safe” kind)! Past performance does not guarantee or indicate future results. Different types of investments involve varying degrees of underlying risk. Therefore, do not assume that future performance of any specific investment or investment strategy be suitable for your portfolio or individual situation, will be profitable, equal any historical performance level(s), or prove successful (including the investments and/or investment strategies describe on this site).
Investing Process Links
Stabilize- Organize your $$$
- Manage your $$$
Plan
- Why You Invest
- Ways to Invest
- Where to Invest
- What to Invest In
Execute
- When to Invest
- How Much to Invest
- Buying & Selling
Monitor
- Track The Market
- Track Your Returns
Reflect & Adjust
- Improve Your Returns
- Adjust your Holdings
Popular Pages
- Jim Cramer- Personal Incomes Statements
- Hyperinflation
- Calculating Beta
- SMART Financial Goals
Blogroll
- Advisor Perspectives- Dividend Growth Investor
- Elliott Wave Lives On
- On My Radar | CMG Wealth
- Sure Dividend
- The Big Picture
- The Fat Pitch
- Thoughts from the Frontline
- Trader Feed
Sponsored Links
Invest Safely provides valuable, time-saving info about personal finance, money management, and investing.


