Stock Market Outlook
For The Week Of October 30th = Uptrend
INDICATORS
-
ADX Directional Indicators: Uptrend
Price & Volume Action: Uptrend
Elliott Wave Analysis: Downtrend
The S&P500 ($SPX) rose 4% last week. Friday was year-end jockeying for a lot of mutual funds, when they attempt to meet targets, secure performance bonuses, etc. Those flows helped move the index past the 50-day on above-average trading volume. Friday trading is harder to read, with short-date index options trading more than monthly these days.
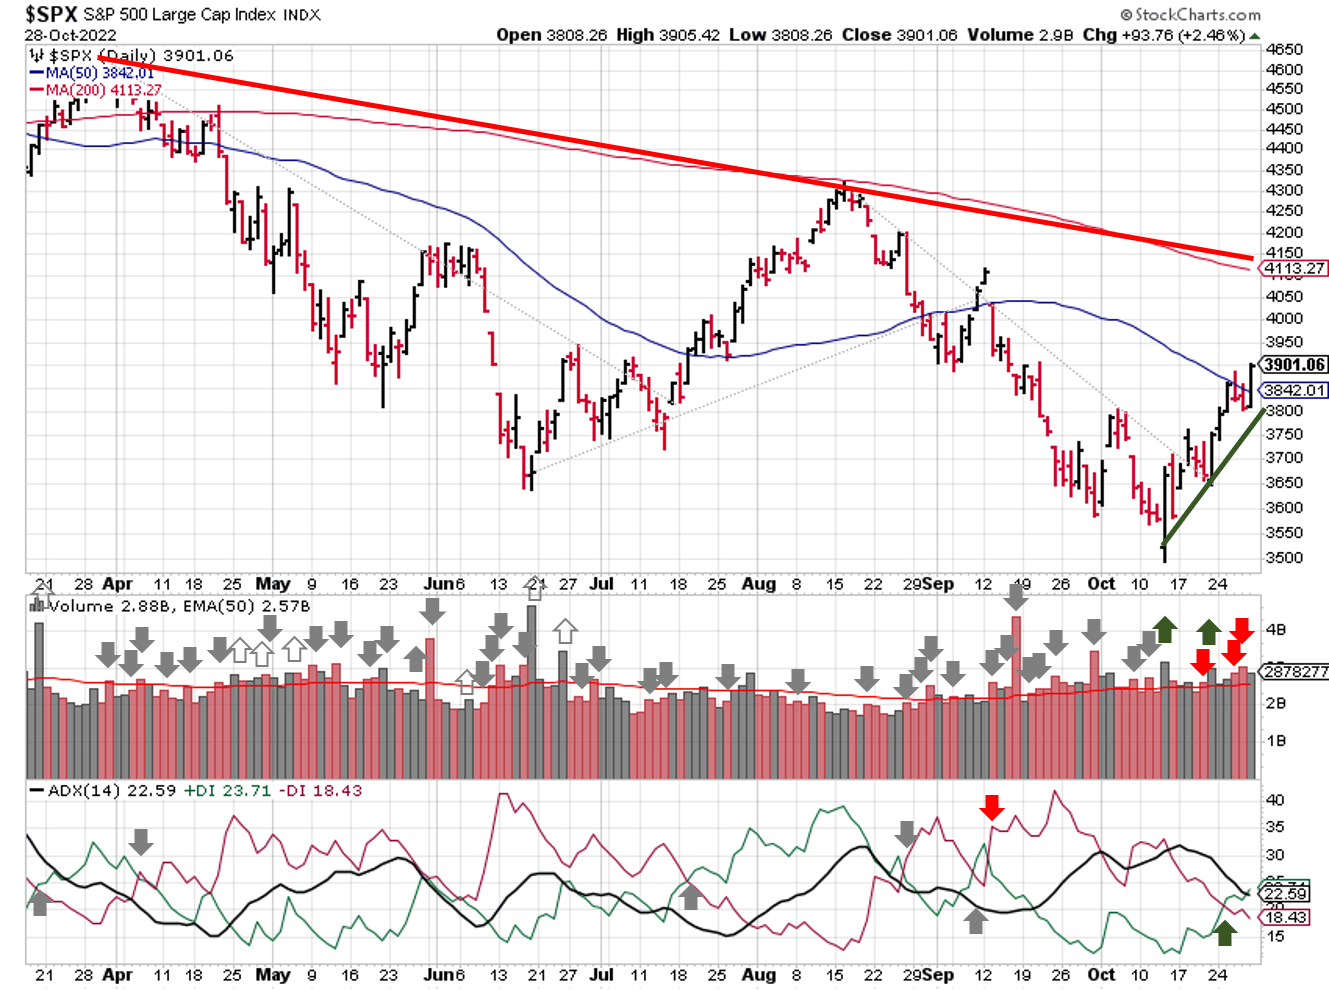
2022-10-30-SPX Trendline Analysis - Daily
The ADX signal flipped on Tuesday, joining price and volume on the bullish side and shifting the overall outlook to an uptrend. With 2 of 3 signals showing bullish price action, the market outlook shifts to an uptrend. The fledgling rally already has 3 distribution days though, so keep a close eye on your individual holdings and cut losses quickly.
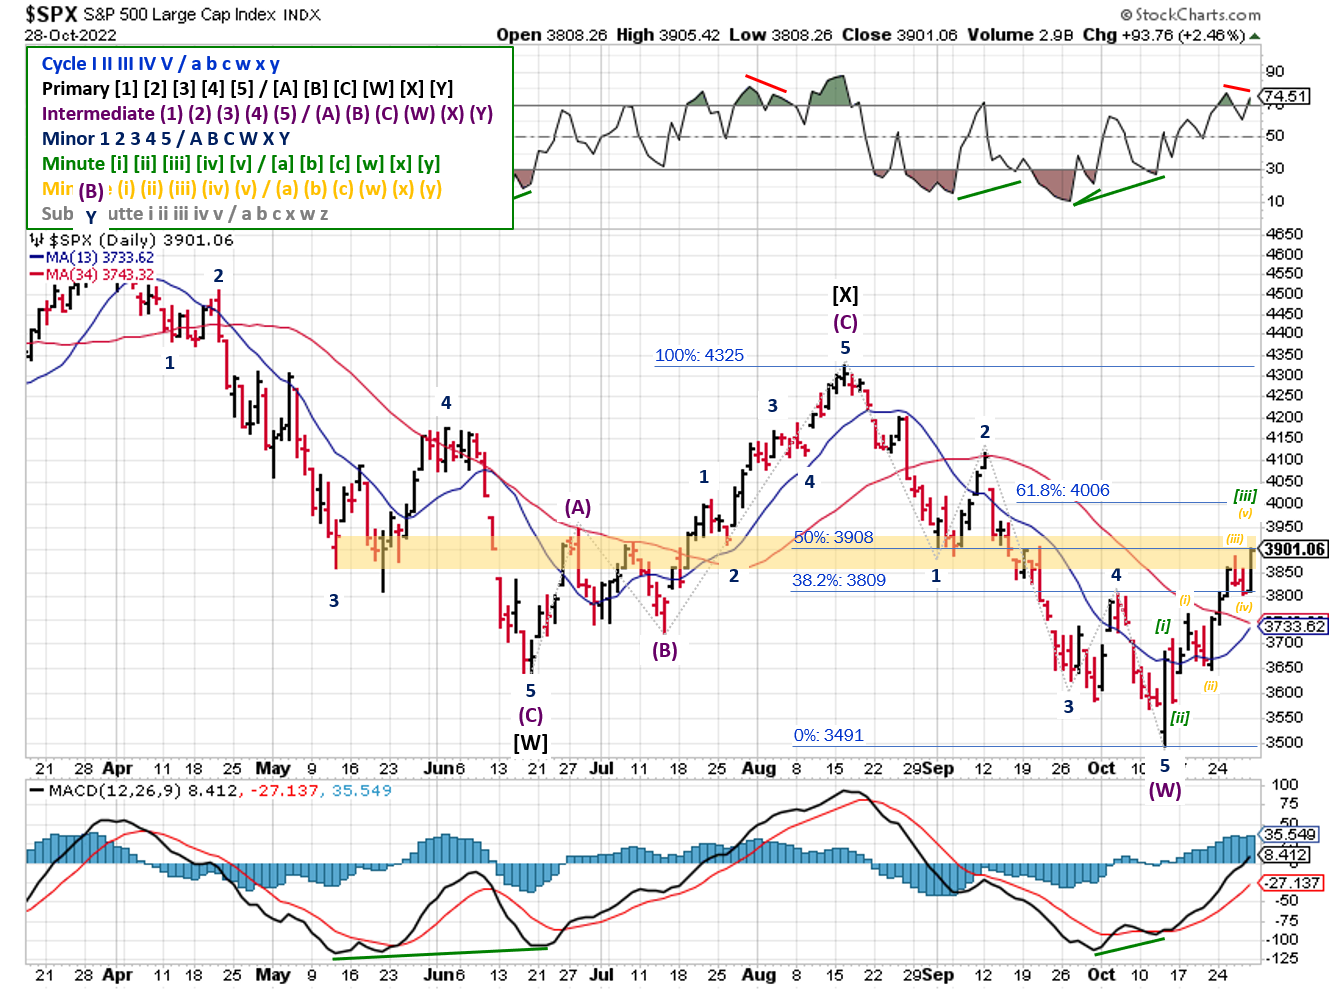
2022-10-30- SPX Elliott Wave Analysis - Daily - Primary Y
Elliott Wave analysis shows the counter-trend rally hitting 3900, which was the 50% retracement target. There's a small negative divergence in the RSI, so the wave count shown has the SPX completing an extended 3rd wave (vs. completing 5th).
COMMENTARY
The market absorbed some gut punches this week, with disappointing earnings reports sending stock prices down sharply for Amazon, Google, Meta and Microsoft. Apple's report was less bad, so the stock rallied. If earnings reports are on deck for your holdings, hedging your positions with short-dated options is a good strategy to mitigate risk.
Over the past two weeks, pundits and contrarian investors are citing historically high levels of bearish sentiment as a reason for stocks to rally. Many recall Warren Buffett's famous saying to be "fearful when others are greedy, and greedy when others are fearful".
The problem right now is that sentiment (feelings) doesn't reflect positioning (actions). I mentioned the high level of bullish bets placed via call options, but it's not just derivative bets; US Equity funds saw their biggest inflows in 18 weeks according to Lipper. To me, that seems like a lot of people being greedy because they think everyone "should" be fearful.
Given the sour mood and slowing economic data, U.S. senators tried to pressure the Fed into pausing interest rate hikes. Ironically, those same senators were worried about maintaining Fed "independence" from interference from legislative and executive branches of government a few years ago. Go figure.
Q3 GDP and PCE figures were released. Regardless of the narratives, neither dataset slowed enough for the Fed to change course on rate hikes this year. They're both backward looking and may not reflect current conditions, but that's what a "data dependent" Fed uses right now.
Big event risk this week heading into the Fed meetings on November 1st and 2nd. I expect a binary outcome: a hawkish interpretation sends stocks down and a dovish interpretation sends stocks up.
Best To Your Week!
P.S. If you find this research helpful, please tell a friend.
If you don't, tell an enemy.
Sources: Bloomberg, CNBC, Federal Reserve Bank of St. Louis, Hedgeye, U.S. Bureau of Economic Analysis, U.S. Bureau of Economic Analysis, WorldGovernmentBonds.com
Share this Post on:

How to Make Money in Stocks: A Winning System in Good Times and Bad.
It's one of my favorites.
I regularly share articles and other news of interest on:
Twitter (@investsafely)
Facebook (@InvestSafely)
LinkedIn (@Invest-Safely)
Instagram (@investsafely)
Invest Safely, LLC is an independent investment research and online financial media company. Use of Invest Safely, LLC and any other products available through invest-safely.com is subject to our Terms of Service and Privacy Policy. Not a recommendation to buy or sell any security.
Charts provided courtesy of stockcharts.com.
For historical Elliott Wave commentary and analysis, go to ELLIOTT WAVE lives on by Tony Caldaro. Current counts can be found at: Pretzel Logic, and 12345ABCDEWXYZ
Once a year, I review the market outlook signals as if they were a mechanical trading system, while pointing out issues and making adjustments. The goal is to give you to give you an example of how to analyze and continuously improve your own systems.
- 2015 Performance - Stock Market Outlook
- 2016 Performance - Stock Market Outlook
- 2017 Performance - Stock Market Outlook
- 2018 Performance - Stock Market Outlook
- 2019 Performance - Stock Market Outlook
- 2020 Performance - Stock Market Outlook
IMPORTANT DISCLOSURE INFORMATION
This material is for general communication and is provided for informational and/or educational purposes only. None of the content should be viewed as a suggestion that you take or refrain from taking any action nor as a recommendation for any specific investment product, strategy, or other such purpose. Certain information contained herein has been obtained from third-party sources believed to be reliable, but we cannot guarantee its accuracy or completeness.
To the extent that a reader has any questions regarding the applicability of any specific issue discussed above to his/her individual situation, he/she is encouraged to consult with the professional advisors of his/her choosing. Invest Safely, LLC is not a law firm, certified public accounting firm, or registered investment advisor and no portion of its content should be construed as legal, accounting, or investment advice.
The material is not to be construed as an offer or a recommendation to buy or sell a security nor is it to be construed as investment advice. Additionally, the material accessible through this website does not constitute a representation that the investments described herein are suitable or appropriate for any person.
Hypothetical Presentations:
Any referenced performance is “as calculated” using the referenced funds and has not been independently verified. This presentation does not discuss, directly or indirectly, the amount of the profits or losses, realized or unrealized, by any reader or contributor, from any specific funds or securities.
The author and/or any reader may have experienced materially different performance based upon various factors during the corresponding time periods. To the extent that any portion of the content reflects hypothetical results that were achieved by means of the retroactive application of a back-tested model, such results have inherent limitations, including:
Model results do not reflect the results of actual trading using assets, but were achieved by means of the retroactive application of the referenced models, certain aspects of which may have been designed with the benefit of hindsight
Back-tested performance may not reflect the impact that any material market or economic factors might have had on the use of a trading model if the model had been used during the period to actually manage assets
Actual investment results during the corresponding time periods may have been materially different from those portrayed in the model
Past performance may not be indicative of future results. Therefore, no one should assume that future performance will be profitable, or equal to any corresponding historical index.
The S&P 500 Composite Total Return Index (the "S&P") is a market capitalization-weighted index of 500 widely held stocks often used as a proxy for the stock market. Standard & Poor's chooses the member companies for the S&P based on market size, liquidity, and industry group representation. Included are the common stocks of industrial, financial, utility, and transportation companies. The S&P is not an index into which an investor can directly invest. The historical S&P performance results (and those of all other indices) are provided exclusively for comparison purposes only, so as to provide general comparative information to assist an individual in determining whether the performance of a specific portfolio or model meets, or continues to meet investment objective(s). The model and indices performance results do not reflect the impact of taxes.
Investing involves risk (even the “safe” kind)! Past performance does not guarantee or indicate future results. Different types of investments involve varying degrees of underlying risk. Therefore, do not assume that future performance of any specific investment or investment strategy be suitable for your portfolio or individual situation, will be profitable, equal any historical performance level(s), or prove successful (including the investments and/or investment strategies describe on this site).
Investing Process Links
Stabilize- Organize your $$$
- Manage your $$$
Plan
- Why You Invest
- Ways to Invest
- Where to Invest
- What to Invest In
Execute
- When to Invest
- How Much to Invest
- Buying & Selling
Monitor
- Track The Market
- Track Your Returns
Reflect & Adjust
- Improve Your Returns
- Adjust your Holdings
Popular Pages
- Jim Cramer- Personal Incomes Statements
- Hyperinflation
- Calculating Beta
- SMART Financial Goals
Blogroll
- Advisor Perspectives- Dividend Growth Investor
- Elliott Wave Lives On
- On My Radar | CMG Wealth
- Sure Dividend
- The Big Picture
- The Fat Pitch
- Thoughts from the Frontline
- Trader Feed
Sponsored Links
Invest Safely provides valuable, time-saving info about personal finance, money management, and investing.


