Stock Market Outlook
For The Week Of August 7th = Uptrend
INDICATORS
-
ADX Directional Indicators: Uptrend
Price & Volume Action: Uptrend
Elliott Wave Analysis: Mixed
The S&P500 ($SPX) got caught in highlighted resistance band, sandwiched between the lows of March and the highs of early June. For the week, the index rose 0.4%.
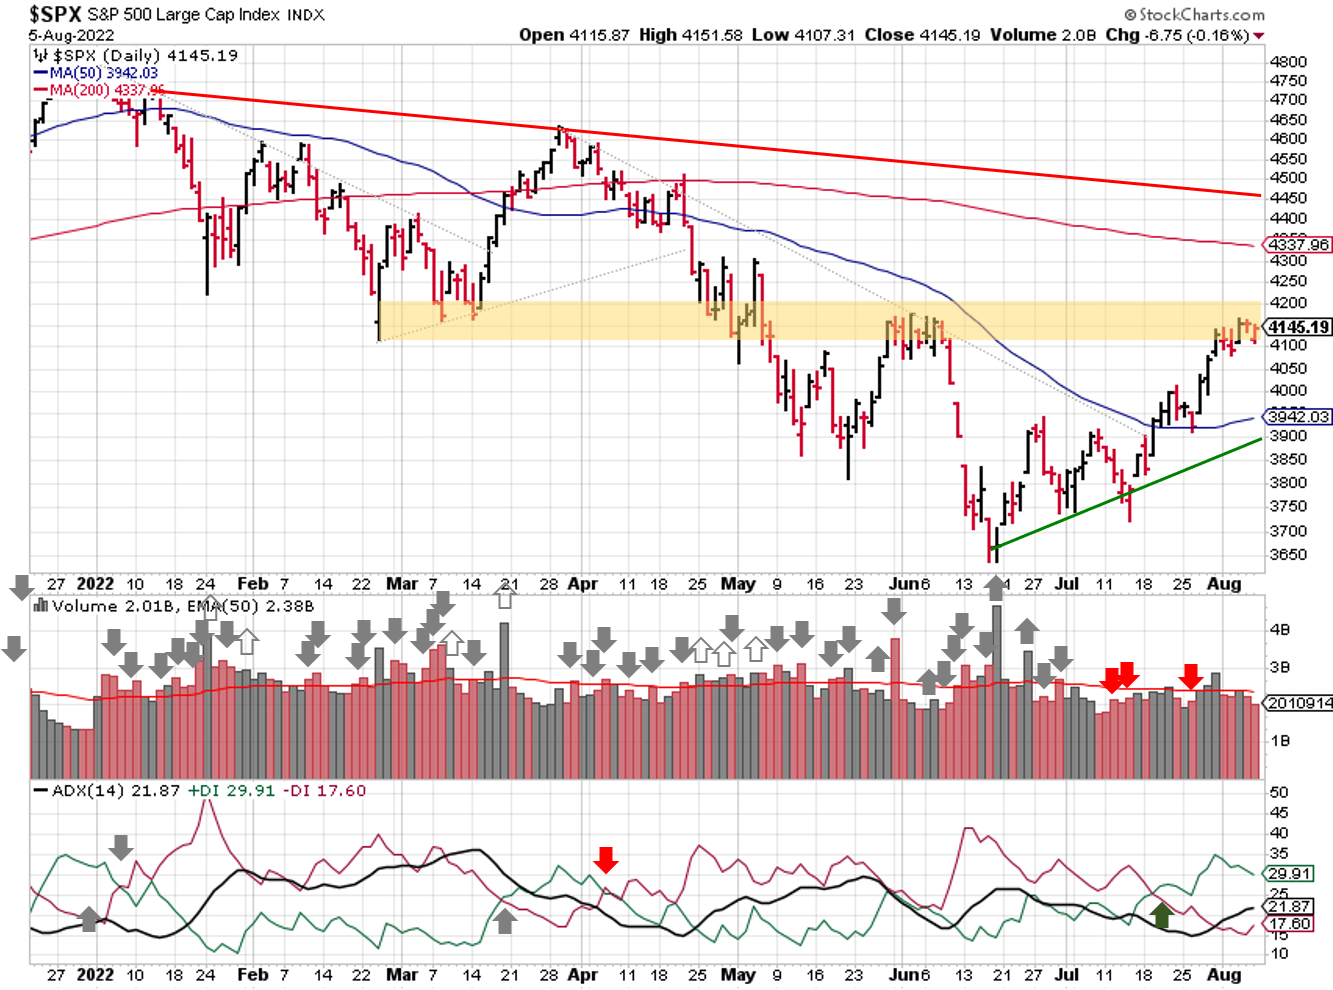
2022-08-07-SPX Trendline Analysis - Daily
All three signals remain unchanged. The ADX shows strengthening bullish price action, but the overall reading isn't high enough to say the trend is "strong"/
Price/volume shows an uptrend in place. Trading volumes were below average, but there's not much in the way of institutional selling either.
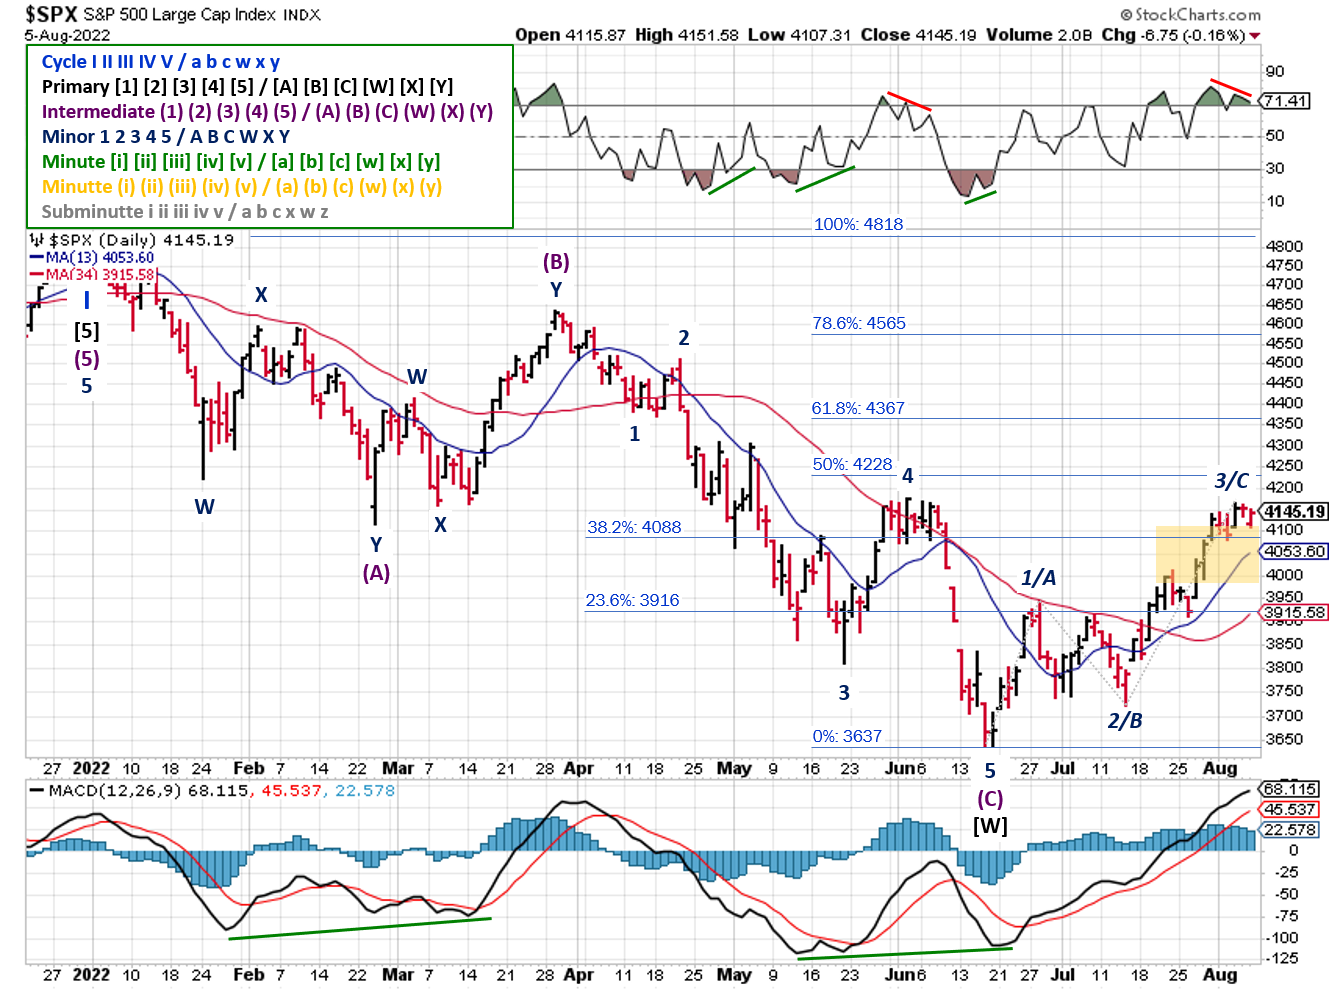
2022-08-07- SPX Elliott Wave Analysis - Daily - Primary Y
Elliott Wave remains mixed. We don’t know if it’s the 5th wave in a bullish count (3rd wave of an uptrend) or a bearish count (completed C-wave). An RSI divergence developed, supporting a completed 5th wave in either case. But the index rose above the target price range for the bearish "flat" pattern. See the end of the post for weekly and monthly views.
COMMENTARY
As of Friday morning, 87% of the SP500 had reported earnings; average revenue is up 15% year over year, and earnings are up 9%. Those are better than the aggregate numbers mentioned last weekend, when 50% of the index had reported. The data shows that overall, companies overcame macro headwinds and challenging year-over-year comparisons.

Source: Hedgeye Risk Management
That said, a large portion of the overall improvement came from the energy sector (22 of 23 companies reporting), which averaged a 77% increase in revenue and a 308% increase in earnings! That skews the average a bit, and masks weakness in other sectors of the economy (Financials, Communications, Consumer Discretionary, etc.).
On Friday, we found out that the U.S. economy added 528,000 jobs in August. That's more than double estimates for and increase of 258,000 jobs, which means we've recovered all the jobs lost during COVID-19 shutdowns (in aggregate). That puts the U.S. unemployment rate back to a pre-pandemic level of 3.5%.
From an employment standpoint, that's great news. Unfortunately, that means the Fed has a green light to continue hiking rates.
Think about it. The Fed's so-called "dual mandate" is low inflation and full employment. Right now, they're on a mission to reduce inflation ~9% to 2% as fast as possible with as little as possible unemployment (the "soft landing"). After "big" rate hikes and QT, we see signs that inflation is just starting to ease, but unemployment is at all time lows. To me, that seems like the all clear to continue aggressive rate hikes, not take them off the table.
That would be an issue for all those CNBC narratives saying markets rallied because inflation has peaked and therefore so have interest rate hikes.
Best To Your Week!
P.S. If you find this research helpful, please tell a friend. If you don't, tell an enemy.
Sources: Bloomberg, CNBC, Hedgeye
Weekly / Monthly Elliott Wave Charts
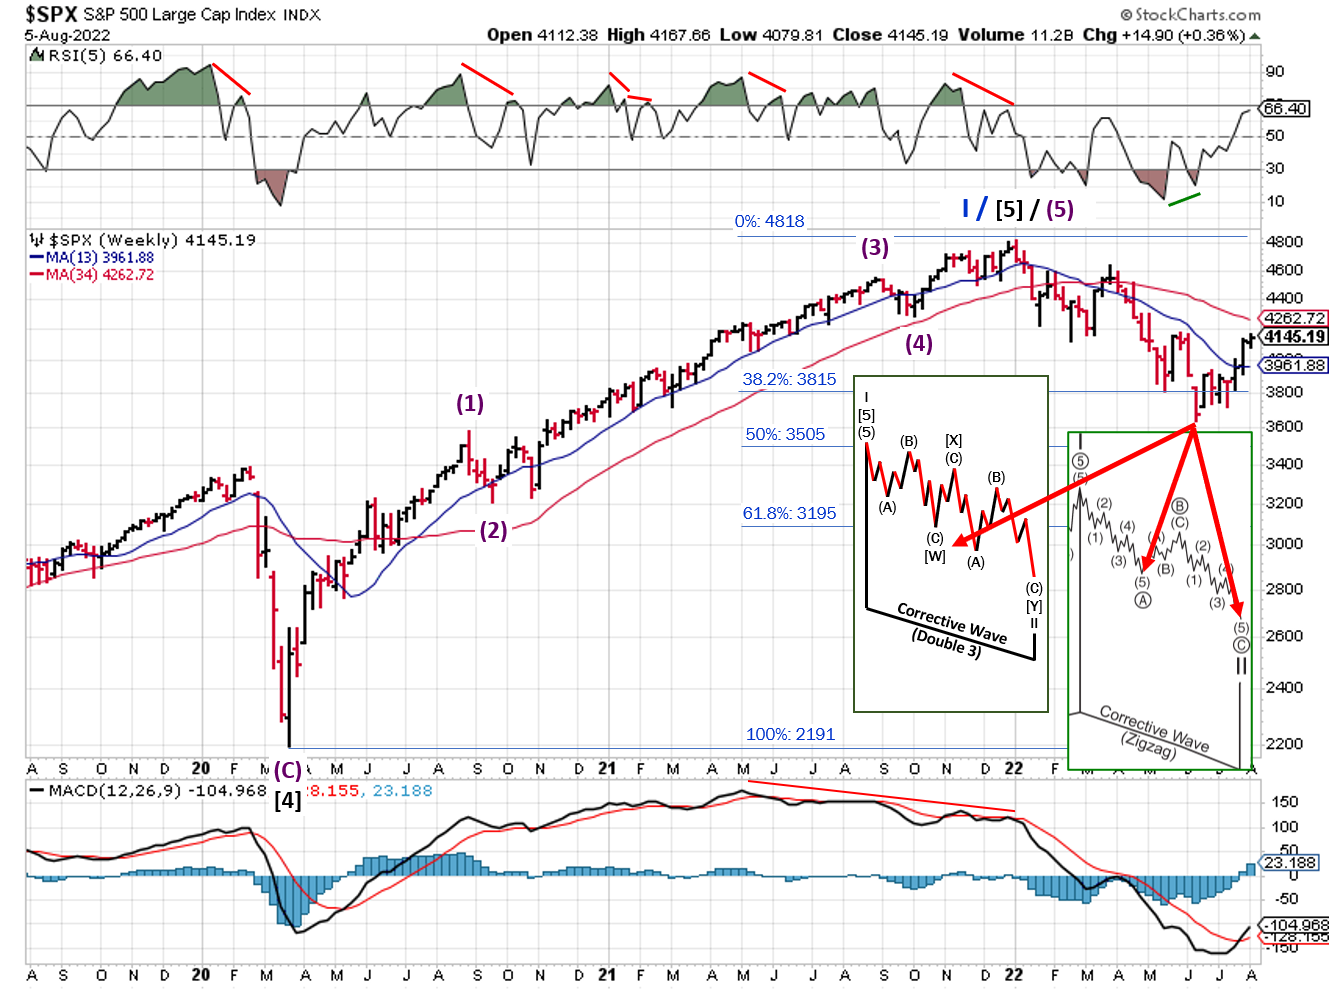
2022-08-07- SPX Elliott Wave Analysis - Weekly- Primary Y
In a weekly view, we see the SPX retracing a bit less than 50% from the January high to the June low. If the March 2020 low was the start of a new bull market (i.e. Cycle III wave, which is not the count shown above), then it's possible that the 2nd wave correction is complete. I don't see too many people that bullish on stocks at this point.
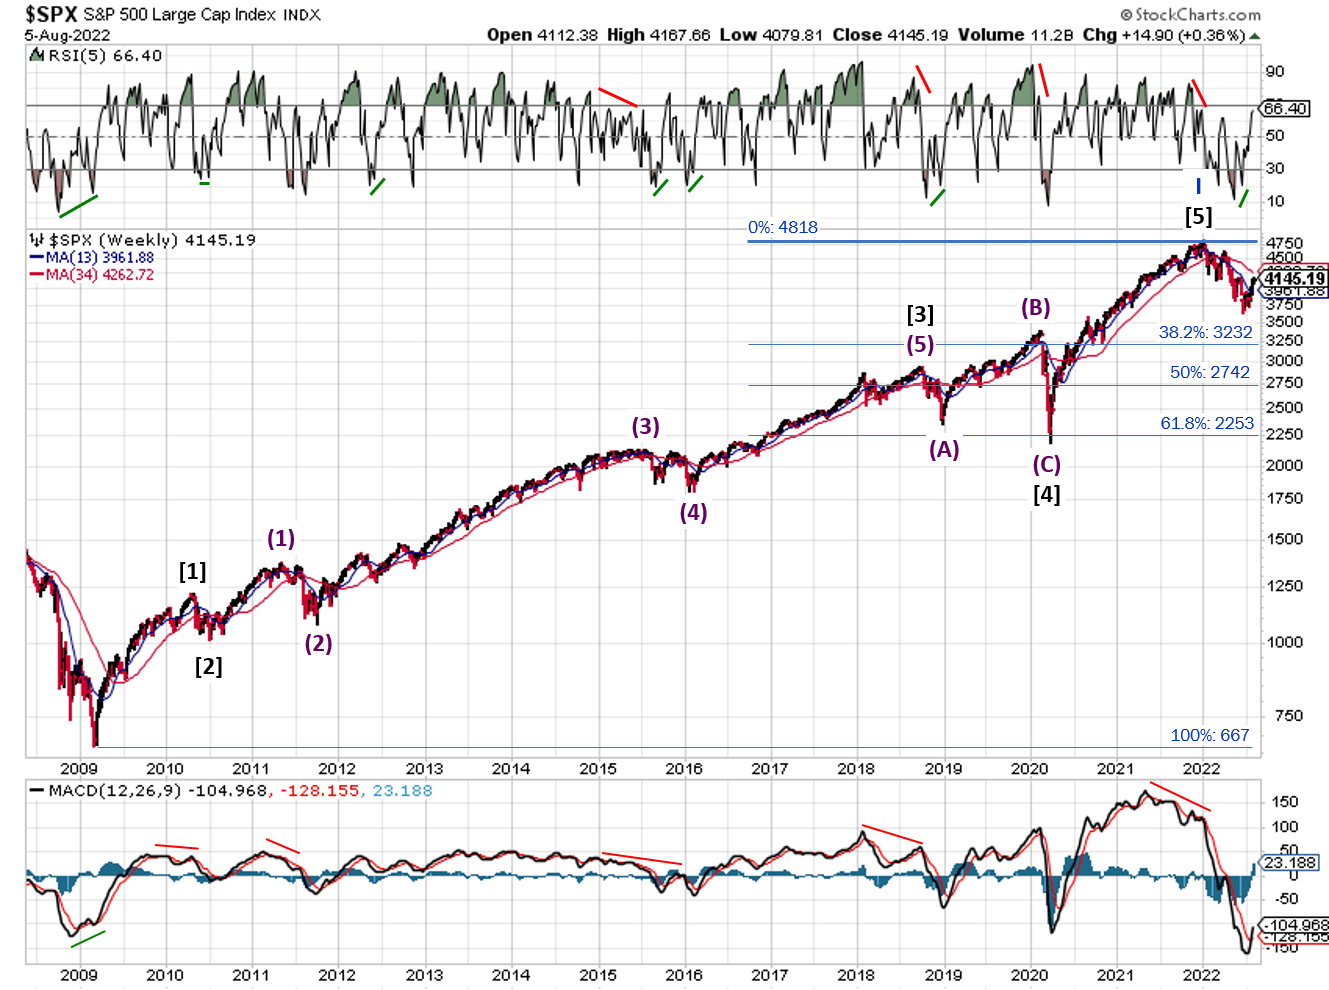
2022-08-07- SPX Elliott Wave Analysis - Weekly - Cycle II
Going out even further, we see the SPX gained 4151 points from the 2009 market bottom (667) to the 2022 market to (4818), for a gain of 622% (Cycle I wave)! At the June low of 3637, the SPX retraced 28% of the total bull run. As of Friday, the closed at 4145, which is a 16% retracement of the total bull run. Neither of those retracements would satisfy a Cycle II corrective wave, lending support to the view that the bear market isn't over.
Share this Post on:

How to Make Money in Stocks: A Winning System in Good Times and Bad.
It's one of my favorites.
I regularly share articles and other news of interest on:
Twitter (@investsafely)
Facebook (@InvestSafely)
LinkedIn (@Invest-Safely)
Instagram (@investsafely)
Invest Safely, LLC is an independent investment research and online financial media company. Use of Invest Safely, LLC and any other products available through invest-safely.com is subject to our Terms of Service and Privacy Policy. Not a recommendation to buy or sell any security.
Charts provided courtesy of stockcharts.com.
For historical Elliott Wave commentary and analysis, go to ELLIOTT WAVE lives on by Tony Caldaro. Current counts can be found at: Pretzel Logic, and 12345ABCDEWXYZ
Once a year, I review the market outlook signals as if they were a mechanical trading system, while pointing out issues and making adjustments. The goal is to give you to give you an example of how to analyze and continuously improve your own systems.
- 2015 Performance - Stock Market Outlook
- 2016 Performance - Stock Market Outlook
- 2017 Performance - Stock Market Outlook
- 2018 Performance - Stock Market Outlook
- 2019 Performance - Stock Market Outlook
- 2020 Performance - Stock Market Outlook
IMPORTANT DISCLOSURE INFORMATION
This material is for general communication and is provided for informational and/or educational purposes only. None of the content should be viewed as a suggestion that you take or refrain from taking any action nor as a recommendation for any specific investment product, strategy, or other such purpose. Certain information contained herein has been obtained from third-party sources believed to be reliable, but we cannot guarantee its accuracy or completeness.
To the extent that a reader has any questions regarding the applicability of any specific issue discussed above to his/her individual situation, he/she is encouraged to consult with the professional advisors of his/her choosing. Invest Safely, LLC is not a law firm, certified public accounting firm, or registered investment advisor and no portion of its content should be construed as legal, accounting, or investment advice.
The material is not to be construed as an offer or a recommendation to buy or sell a security nor is it to be construed as investment advice. Additionally, the material accessible through this website does not constitute a representation that the investments described herein are suitable or appropriate for any person.
Hypothetical Presentations:
Any referenced performance is “as calculated” using the referenced funds and has not been independently verified. This presentation does not discuss, directly or indirectly, the amount of the profits or losses, realized or unrealized, by any reader or contributor, from any specific funds or securities.
The author and/or any reader may have experienced materially different performance based upon various factors during the corresponding time periods. To the extent that any portion of the content reflects hypothetical results that were achieved by means of the retroactive application of a back-tested model, such results have inherent limitations, including:
Model results do not reflect the results of actual trading using assets, but were achieved by means of the retroactive application of the referenced models, certain aspects of which may have been designed with the benefit of hindsight
Back-tested performance may not reflect the impact that any material market or economic factors might have had on the use of a trading model if the model had been used during the period to actually manage assets
Actual investment results during the corresponding time periods may have been materially different from those portrayed in the model
Past performance may not be indicative of future results. Therefore, no one should assume that future performance will be profitable, or equal to any corresponding historical index.
The S&P 500 Composite Total Return Index (the "S&P") is a market capitalization-weighted index of 500 widely held stocks often used as a proxy for the stock market. Standard & Poor's chooses the member companies for the S&P based on market size, liquidity, and industry group representation. Included are the common stocks of industrial, financial, utility, and transportation companies. The S&P is not an index into which an investor can directly invest. The historical S&P performance results (and those of all other indices) are provided exclusively for comparison purposes only, so as to provide general comparative information to assist an individual in determining whether the performance of a specific portfolio or model meets, or continues to meet investment objective(s). The model and indices performance results do not reflect the impact of taxes.
Investing involves risk (even the “safe” kind)! Past performance does not guarantee or indicate future results. Different types of investments involve varying degrees of underlying risk. Therefore, do not assume that future performance of any specific investment or investment strategy be suitable for your portfolio or individual situation, will be profitable, equal any historical performance level(s), or prove successful (including the investments and/or investment strategies describe on this site).
Investing Process Links
Stabilize- Organize your $$$
- Manage your $$$
Plan
- Why You Invest
- Ways to Invest
- Where to Invest
- What to Invest In
Execute
- When to Invest
- How Much to Invest
- Buying & Selling
Monitor
- Track The Market
- Track Your Returns
Reflect & Adjust
- Improve Your Returns
- Adjust your Holdings
Popular Pages
- Jim Cramer- Personal Incomes Statements
- Hyperinflation
- Calculating Beta
- SMART Financial Goals
Blogroll
- Advisor Perspectives- Dividend Growth Investor
- Elliott Wave Lives On
- On My Radar | CMG Wealth
- Sure Dividend
- The Big Picture
- The Fat Pitch
- Thoughts from the Frontline
- Trader Feed
Sponsored Links
Invest Safely provides valuable, time-saving info about personal finance, money management, and investing.


