Stock Market Outlook
For The Week Of May 29th = Downtrend
INDICATORS
-
ADX Directional Indicators: Downtrend
Price & Volume Action: Mixed
Elliott Wave Analysis: Mixed
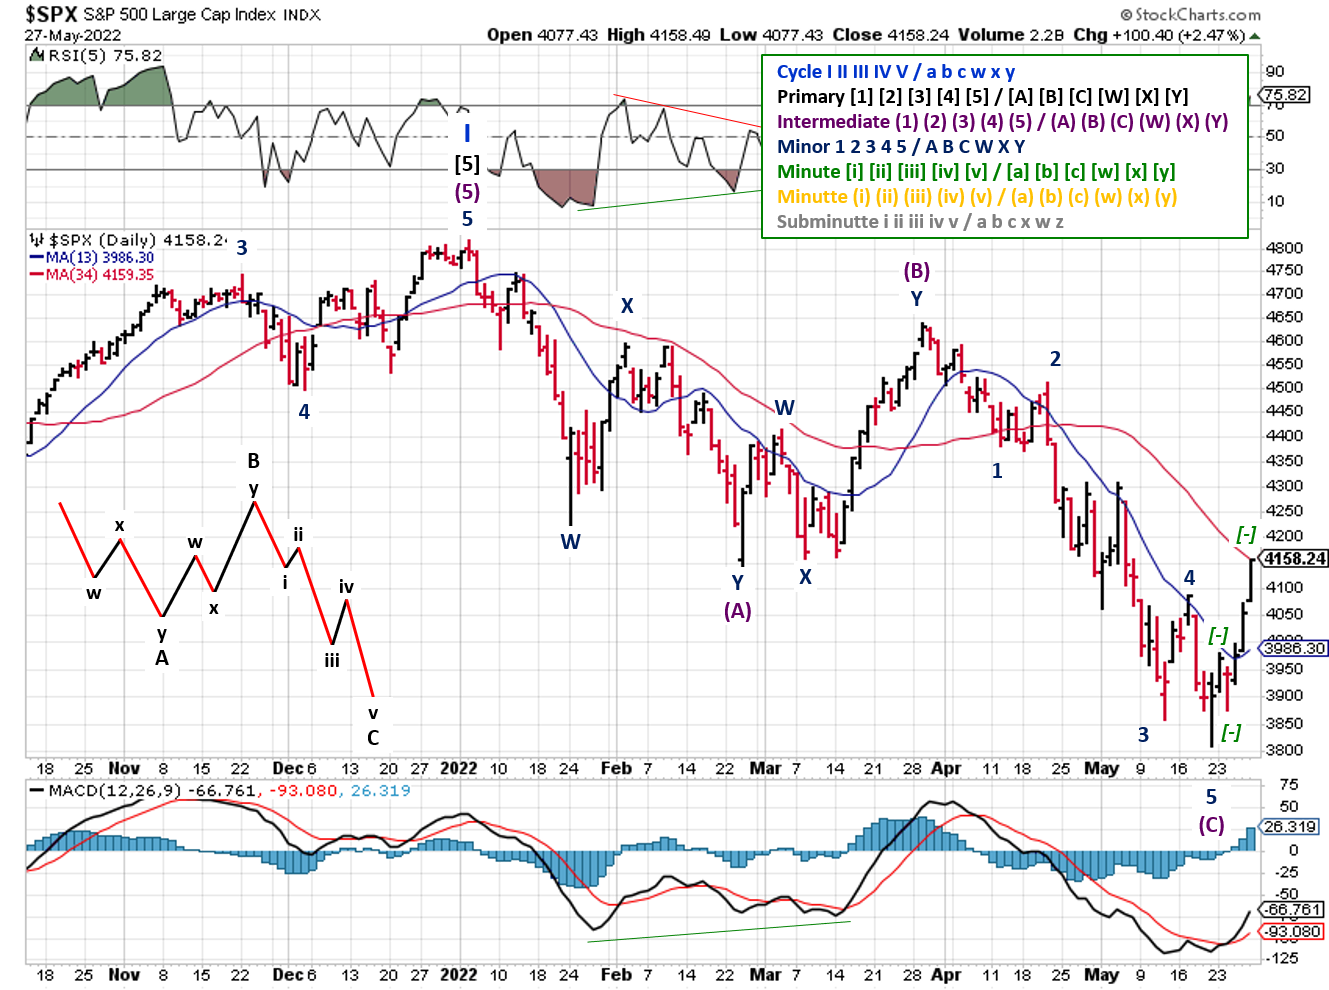
The S&P500 ($SPX) jumped 6.6% last week, erasing almost a third of its total loss for the year. The index now sits ~13% off it's high for the year, 7% below the 200-day moving average and only 3% below the 50-day. It closed in a critical zone, in terms of support and resistance, with the start of the March rally (support) creating a solid resistance level.
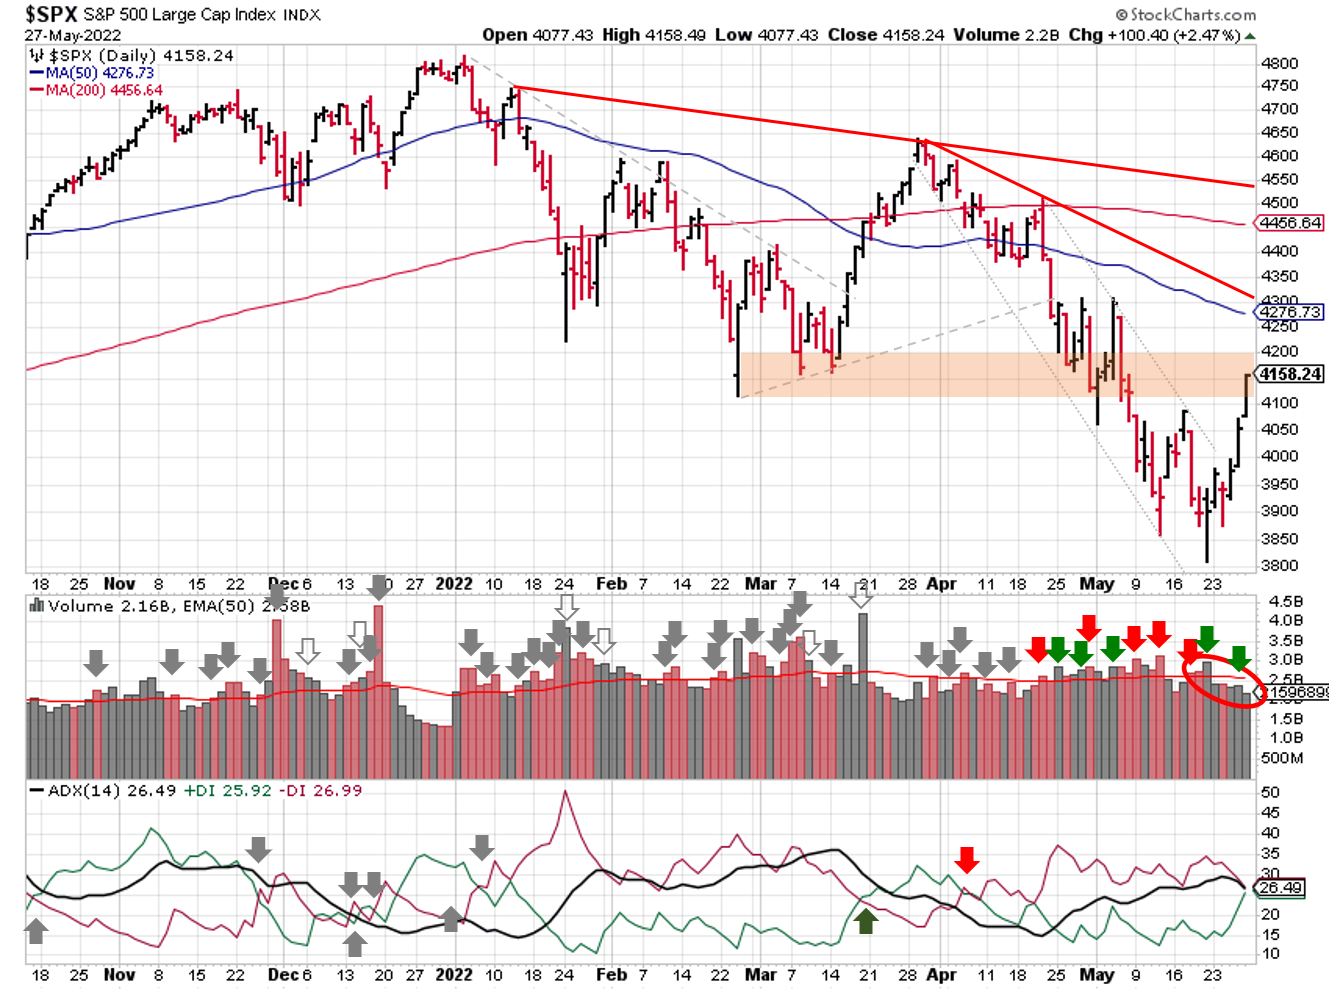
2022-05-29-SPX Trendline Analysis - Daily
The ADX signal remains in downtrend, but could flip if we see a more up days this week.
The S&P 500 showed a small amount of accumulation last week, so the price & volume signal shifts to mixed. The index picked up a follow-through day on Thursday, four days after the May 20th bounce, which is the earliest possible confirmation of a rally. That said, it's a weak set-up based on below average trading volume and remaining below the 50-day. A high volume follow-through this week would be a better signal.
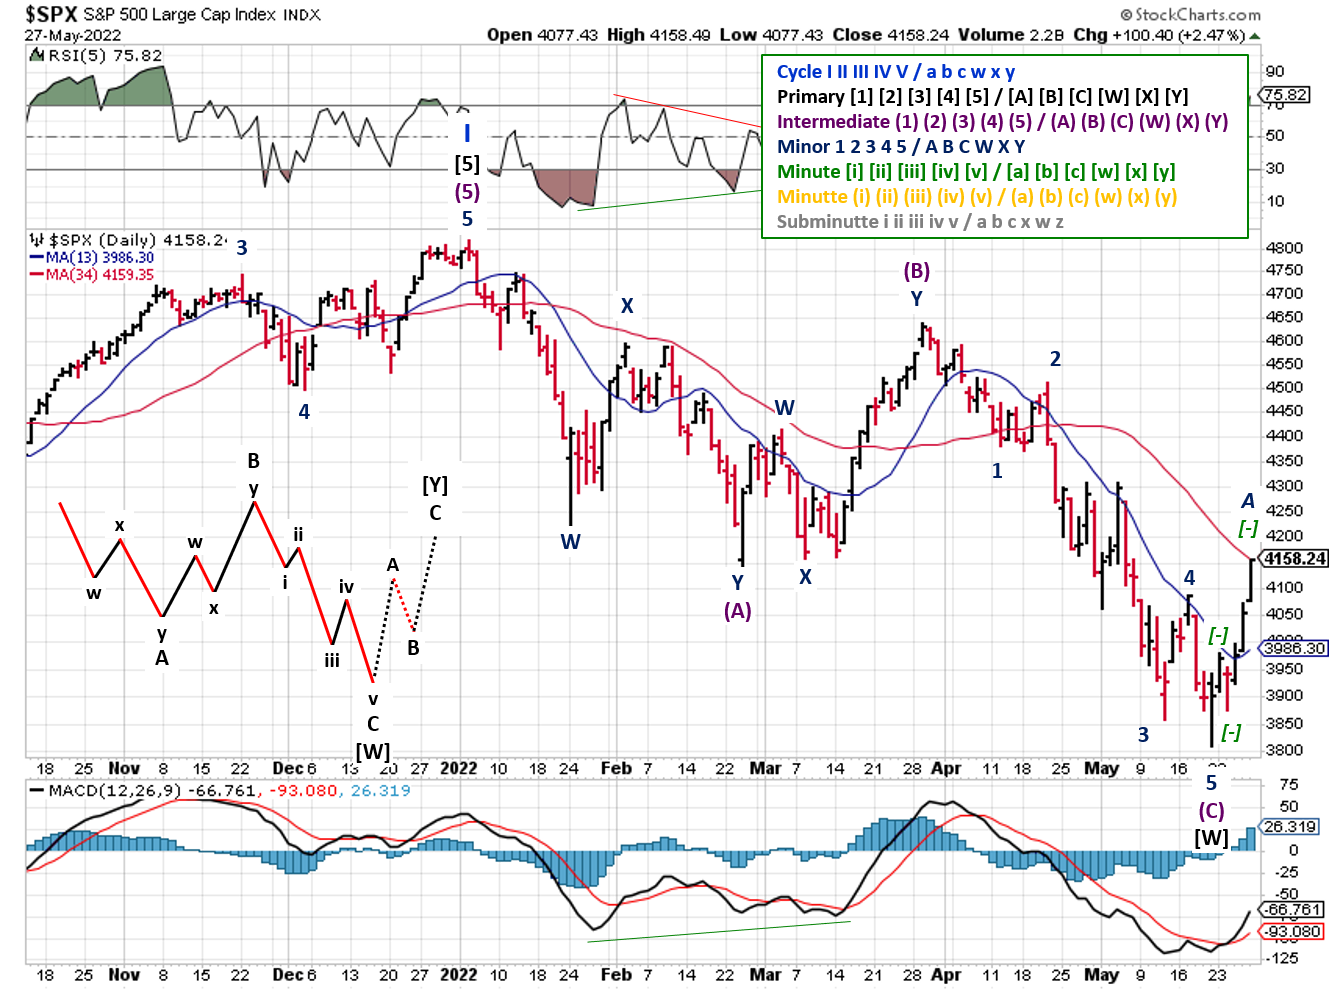
2022-05-29- SPX Elliott Wave Analysis - Daily - Primary Y
Elliott Wave also shifts to mixed, and gets a new count/wave structure to go along with it (more analysis below, per the usual for the past few weeks).COMMENTARY
A short week on tap; U.S. markets are closed Monday in observance of Memorial Day.
You've heard a lot of commentary about whether or not we're in a bear market, based on the notion that bear market begins after falling 20% a peak. But that's an arbitrary number; a talking point.
Does something radically change in your process when a market is down 20% vs 19%? What about when the Nasdaq is down more than 20% but the S&P500 isn't? I'm guessing that's a negative in both cases.
What does impact your process? Data. Like the VIX remaining above 20 during the March rally. Down 20% or not, that's bear market territory and requires changes.
Speaking of data, what about consumer spending, credit card balances, or savings rates? After downbeat forecasts from Target and Walmart, many talking heads are seizing the relatively upbeat reports from Macy's, Nordstrom, and Ralph Lauren as a sign the consumer is still strong, along with spending levels and "high" savings rates. Unfortunately, the difference between the two types of retailers is actually a sign of weakness.
Target and Walmart serve consumers in lower-income brackets, and their reports show a change in spending behavior likely caused by high inflation. Their customers are also the ones that began tapping credit card balances (with ridiculously high interest rates) to maintain their spending when inflation first began to pick up.
Nordstrom and Ralph Lauren cater to higher-income brackets; the last consumers to feel the sting of inflation and change their spending habits. Their customers have the highest savings rates, which allows them to maintain spending in spite of higher inflation
Best To Your Week!
P.S. Based on the analysis shared last week, I updated the waves to show Cycle I ending at the beginning of the year.
2022-05-22- SPX Elliott Wave Analysis - Weekly - Intermediate 3
Something about the wave structure of Intermediate (1) has seemed wrong from the start, especially when zooming out to the weekly view (like we've been doing the past few weeks). Maybe it's just the symmetry of the whole thing, who knows. The pattern that kept popping out to me was 3 waves down, then 3 waves up, then 5 waves down. After last weeks bounce, it made even more sense.
2022-05-22- SPX Elliott Wave Analysis - Weekly
That's actually another type of corrective pattern, called a "flat" (verses a zigzag). In this case, it looks like an irregular or expanded flat. It looks like a much better match to the price action and technical indicators.
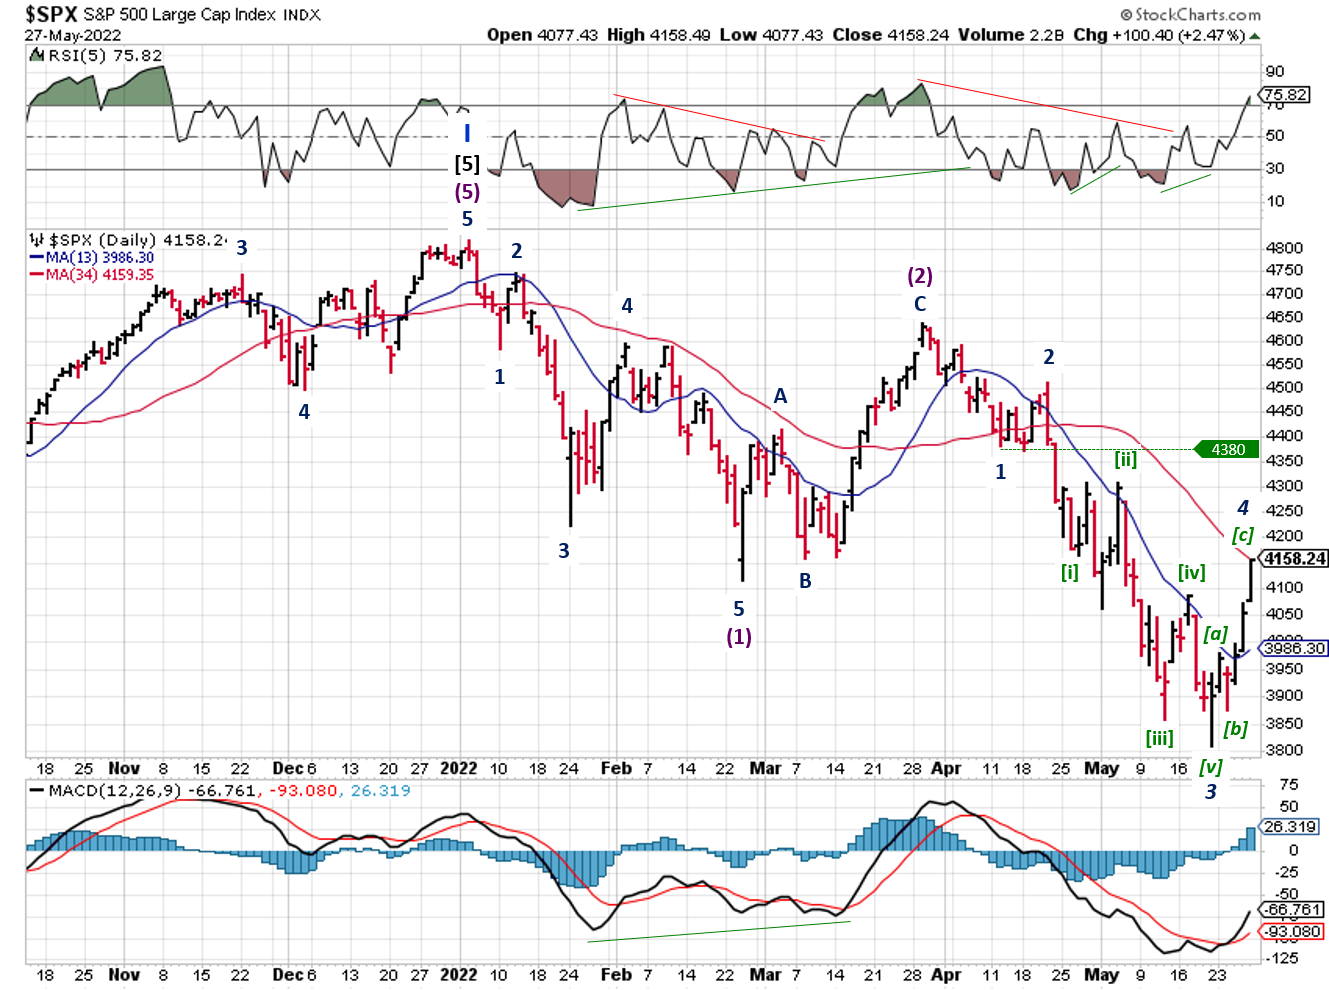
2022-05-29- SPX Elliott Wave Analysis - Daily- Intermediate C
All good right? Not quite. Thanks to last week's rally, this new flat pattern is already complete, implying the whole downtrend is over. That's wishful thinking, since the Fed's quantitative tightening program hasn't even started yet. Given the current economic backdrop, a longer-term correction is likely, and a flat pattern enables this type of extended move, called a "double-three" (or even triple if it comes to that).
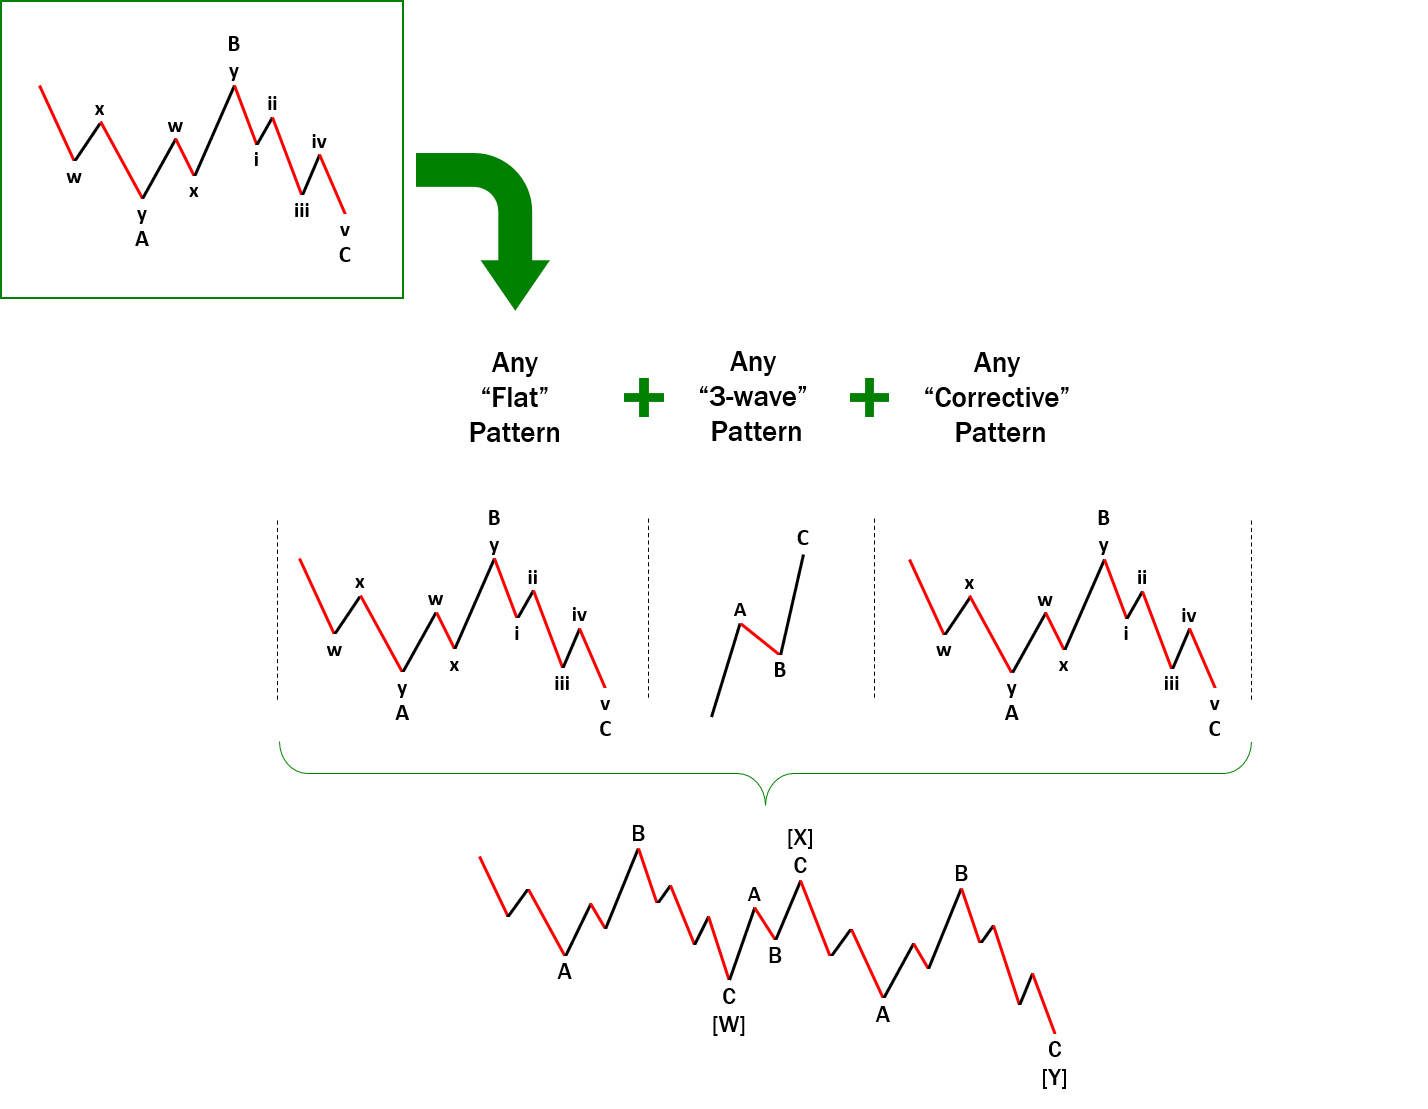
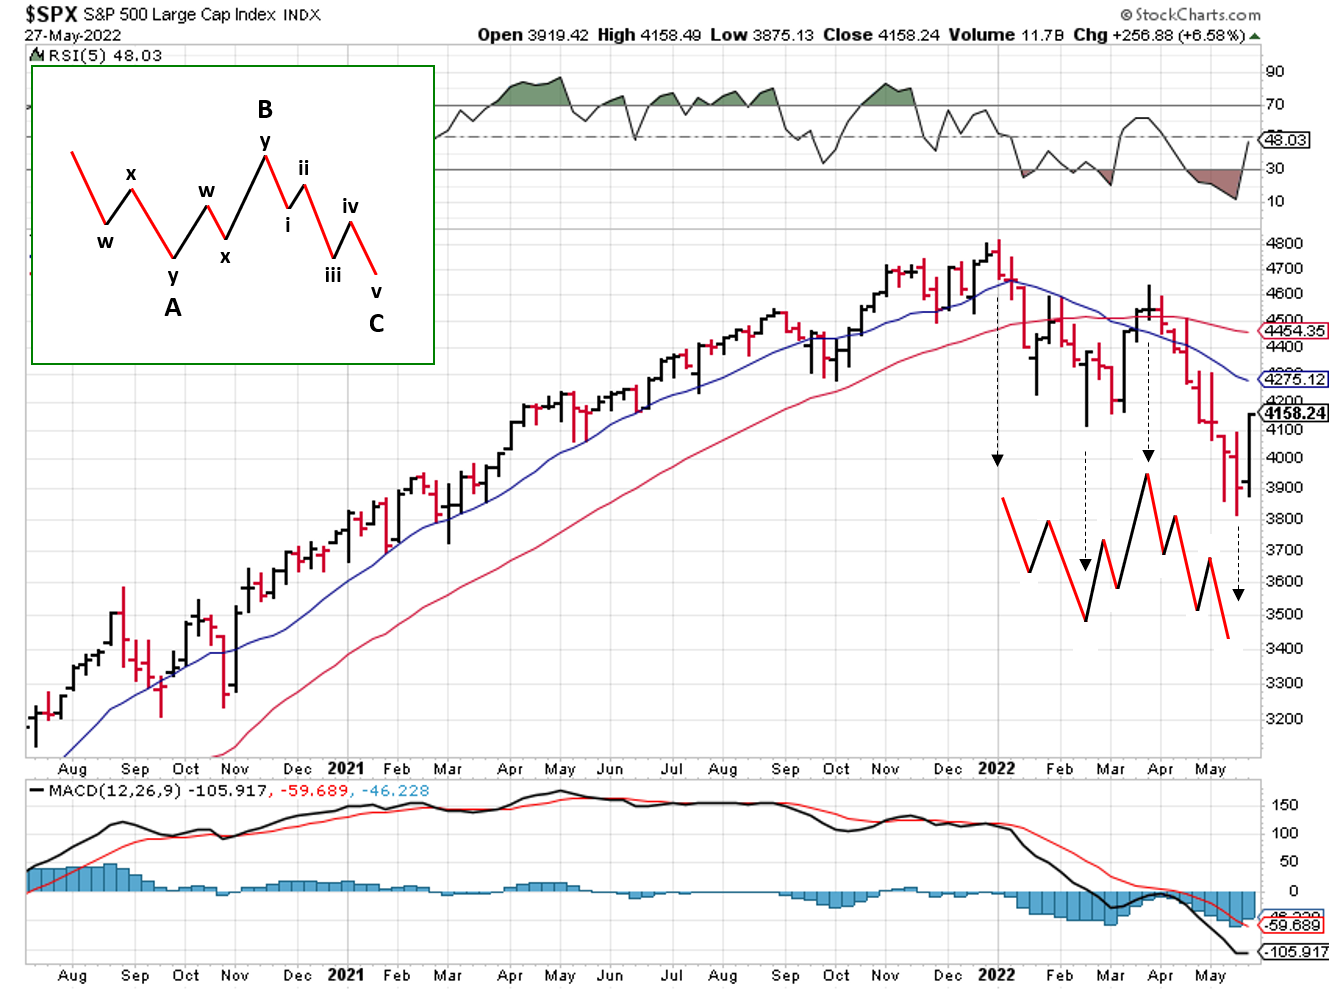
Elliott Wave Analysis - "Double Three" Corrective Pattern
Laying in those patterns on the weekly view provides more likely alternatives for the overall bear market.
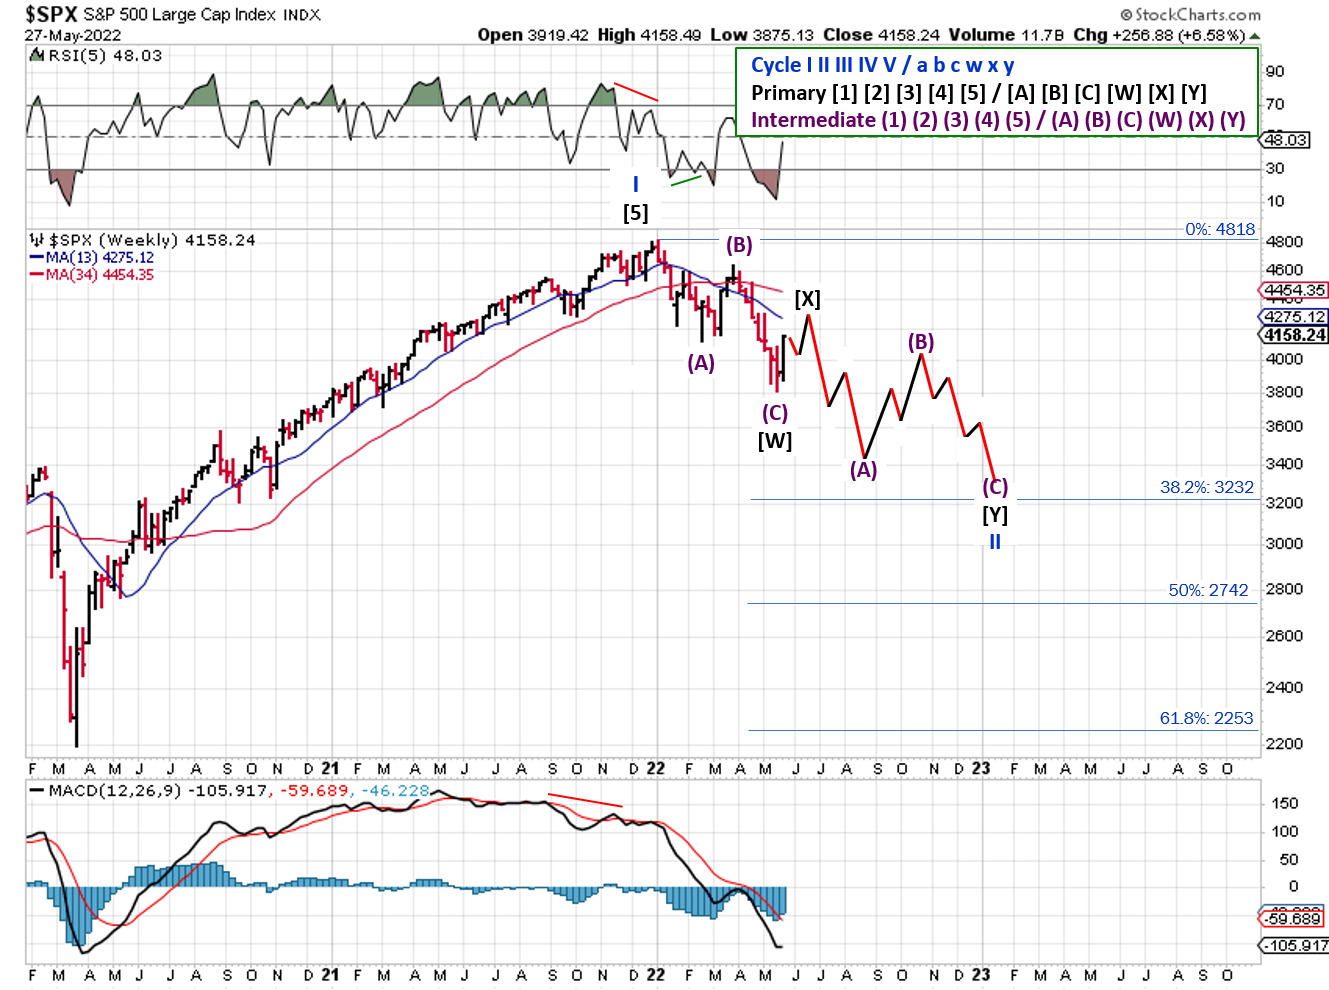
2022-05-29- SPX Elliott Wave Analysis - Weekly - Cycle II
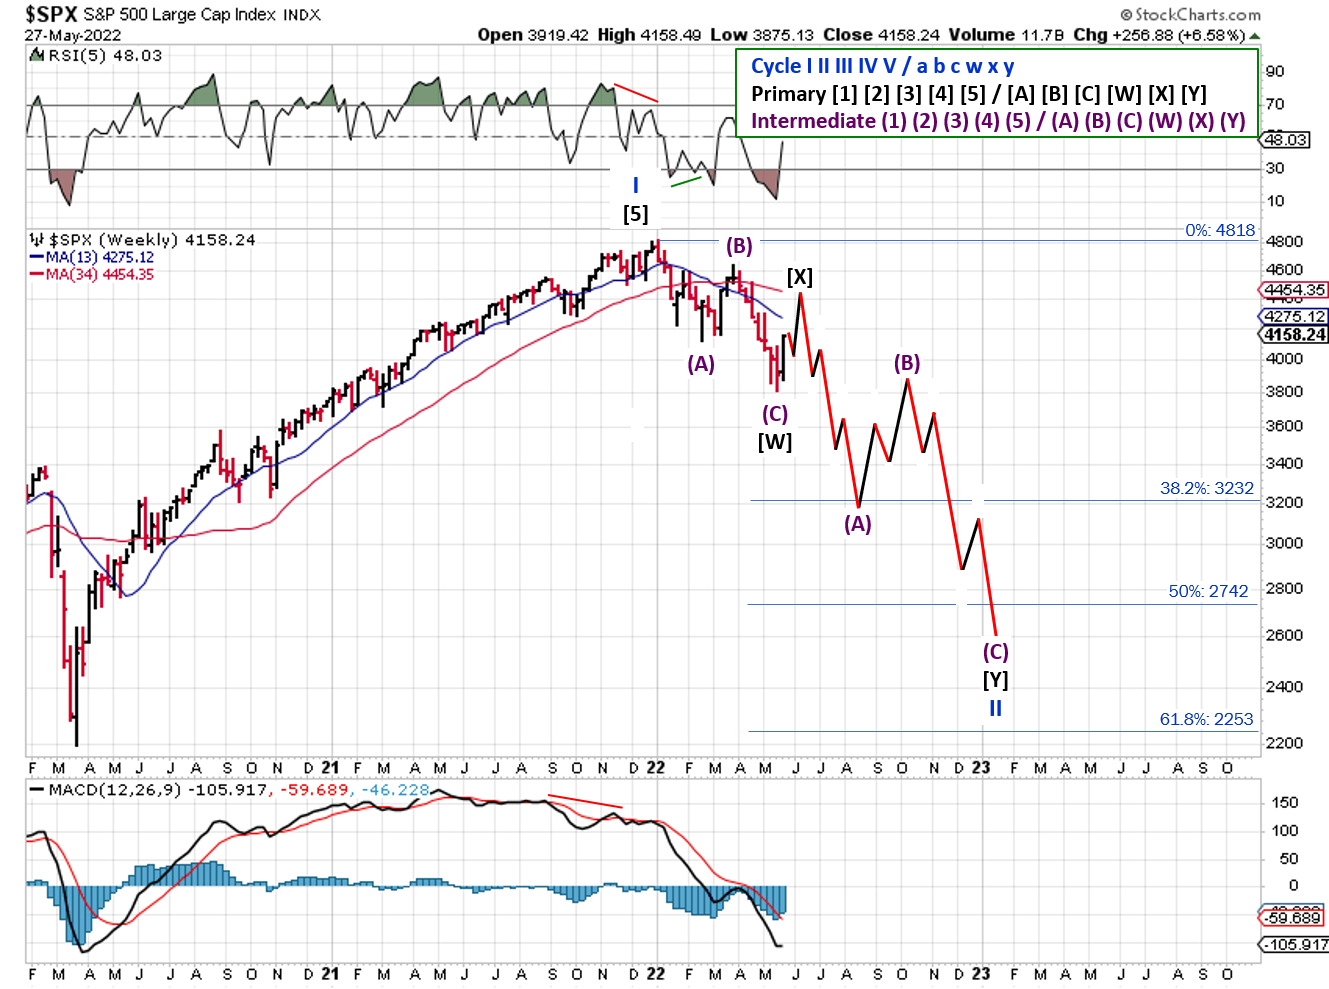
2022-05-29- SPX Elliott Wave Analysis - Weekly - Cycle II
If you find this research helpful, please tell a friend. If you don't find it helpful, tell an enemy.
I regularly share articles and other news of interest via on Twitter (@investsafely), Facebook (InvestSafely),LinkedIn (Invest-Safely), and Instagram (@investsafely).

How to Make Money in Stocks: A Winning System in Good Times and Bad.
It's one of my favorites.
Invest Safely, LLC is an independent investment research and online financial media company. Use of Invest Safely, LLC and any other products available through invest-safely.com are subject to our Terms of Service and Privacy Policy. Not a recommendation to buy or sell any security.
Charts provided courtesy of stockcharts.com.
For historical Elliott Wave commentary and analysis, go to ELLIOTT WAVE lives on by Tony Caldaro. Current counts can be found at: Pretzel Logic, and 12345ABCDEWXYZ
Once a year, I review the market outlook signals as if they were a mechanical trading system, while pointing out issues and making adjustments. The goal is to give you to give you an example of how to analyze and continuously improve your own systems.
- 2015 Performance - Stock Market Outlook
- 2016 Performance - Stock Market Outlook
- 2017 Performance - Stock Market Outlook
- 2018 Performance - Stock Market Outlook
- 2019 Performance - Stock Market Outlook
- 2020 Performance - Stock Market Outlook
IMPORTANT DISCLOSURE INFORMATION
This material is for general communication and is provided for informational and/or educational purposes only. None of the content should be viewed as a suggestion that you take or refrain from taking any action nor as a recommendation for any specific investment product, strategy, or other such purpose. Certain information contained herein has been obtained from third-party sources believed to be reliable, but we cannot guarantee its accuracy or completeness.
To the extent that a reader has any questions regarding the applicability of any specific issue discussed above to his/her individual situation, he/she is encouraged to consult with the professional advisors of his/her choosing. Invest Safely, LLC is not a law firm, certified public accounting firm, or registered investment advisor and no portion of its content should be construed as legal, accounting, or investment advice.
The material is not to be construed as an offer or a recommendation to buy or sell a security nor is it to be construed as investment advice. Additionally, the material accessible through this website does not constitute a representation that the investments described herein are suitable or appropriate for any person.
Hypothetical Presentations:
Any referenced performance is “as calculated” using the referenced funds and has not been independently verified. This presentation does not discuss, directly or indirectly, the amount of the profits or losses, realized or unrealized, by any reader or contributor, from any specific funds or securities.
The author and/or any reader may have experienced materially different performance based upon various factors during the corresponding time periods. To the extent that any portion of the content reflects hypothetical results that were achieved by means of the retroactive application of a back-tested model, such results have inherent limitations, including:
Model results do not reflect the results of actual trading using assets, but were achieved by means of the retroactive application of the referenced models, certain aspects of which may have been designed with the benefit of hindsight
Back-tested performance may not reflect the impact that any material market or economic factors might have had on the use of a trading model if the model had been used during the period to actually manage assets
Actual investment results during the corresponding time periods may have been materially different from those portrayed in the model
Past performance may not be indicative of future results. Therefore, no one should assume that future performance will be profitable, or equal to any corresponding historical index.
The S&P 500 Composite Total Return Index (the "S&P") is a market capitalization-weighted index of 500 widely held stocks often used as a proxy for the stock market. Standard & Poor's chooses the member companies for the S&P based on market size, liquidity, and industry group representation. Included are the common stocks of industrial, financial, utility, and transportation companies. The S&P is not an index into which an investor can directly invest. The historical S&P performance results (and those of all other indices) are provided exclusively for comparison purposes only, so as to provide general comparative information to assist an individual in determining whether the performance of a specific portfolio or model meets, or continues to meet investment objective(s). The model and indices performance results do not reflect the impact of taxes.
Investing involves risk (even the “safe” kind)! Past performance does not guarantee or indicate future results. Different types of investments involve varying degrees of underlying risk. Therefore, do not assume that future performance of any specific investment or investment strategy be suitable for your portfolio or individual situation, will be profitable, equal any historical performance level(s), or prove successful (including the investments and/or investment strategies describe on this site).
Investing Process Links
Stabilize- Organize your $$$
- Manage your $$$
Plan
- Why You Invest
- Ways to Invest
- Where to Invest
- What to Invest In
Execute
- When to Invest
- How Much to Invest
- Buying & Selling
Monitor
- Track The Market
- Track Your Returns
Reflect & Adjust
- Improve Your Returns
- Adjust your Holdings
Popular Pages
- Jim Cramer- Personal Incomes Statements
- Hyperinflation
- Calculating Beta
- SMART Financial Goals
Blogroll
- Advisor Perspectives- Dividend Growth Investor
- Elliott Wave Lives On
- On My Radar | CMG Wealth
- Sure Dividend
- The Big Picture
- The Fat Pitch
- Thoughts from the Frontline
- Trader Feed
Sponsored Links
Invest Safely provides valuable, time-saving info about personal finance, money management, and investing.


