Stock Market Outlook
For The Week Of May 22nd = Downtrend
INDICATORS
-
ADX Directional Indicators: Downtrend
Price & Volume Action: Downtrend
Elliott Wave Analysis: Downtrend
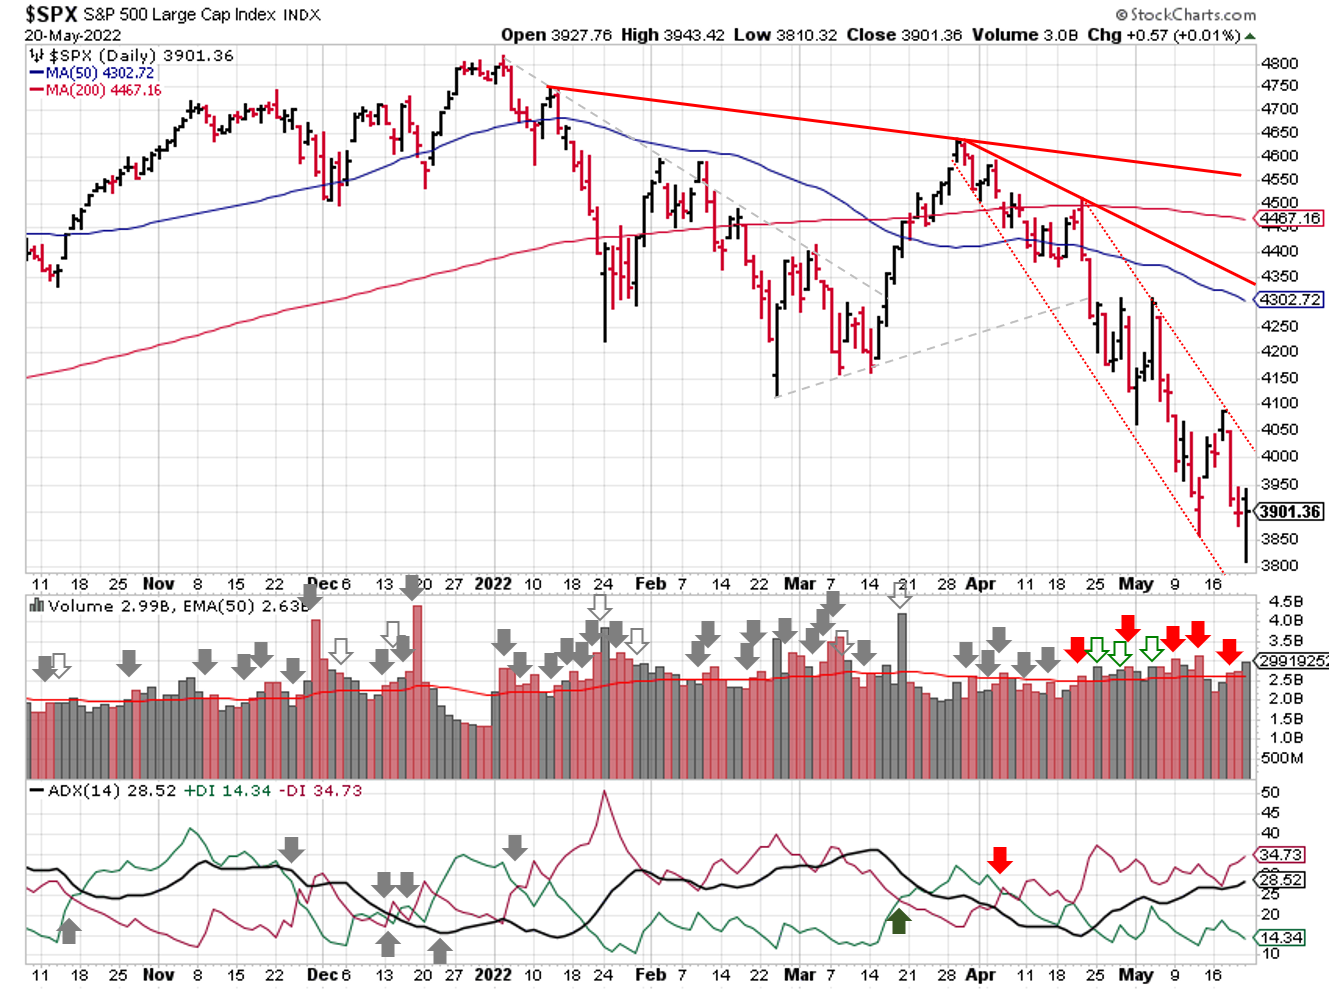
2022-05-22-SPX Trendline Analysis - Daily
The S&P500 ($SPX) fell ~3% last week, and now sits 10% and 15% below the 50 and 200 day moving averages, respectively. All three signals continue to show bearish trends in place. Price/volume shows most accumulation days are quickly followed by sell offs on above average volume, but Elliott Wave indicates a relief rally may be in the cards near term.
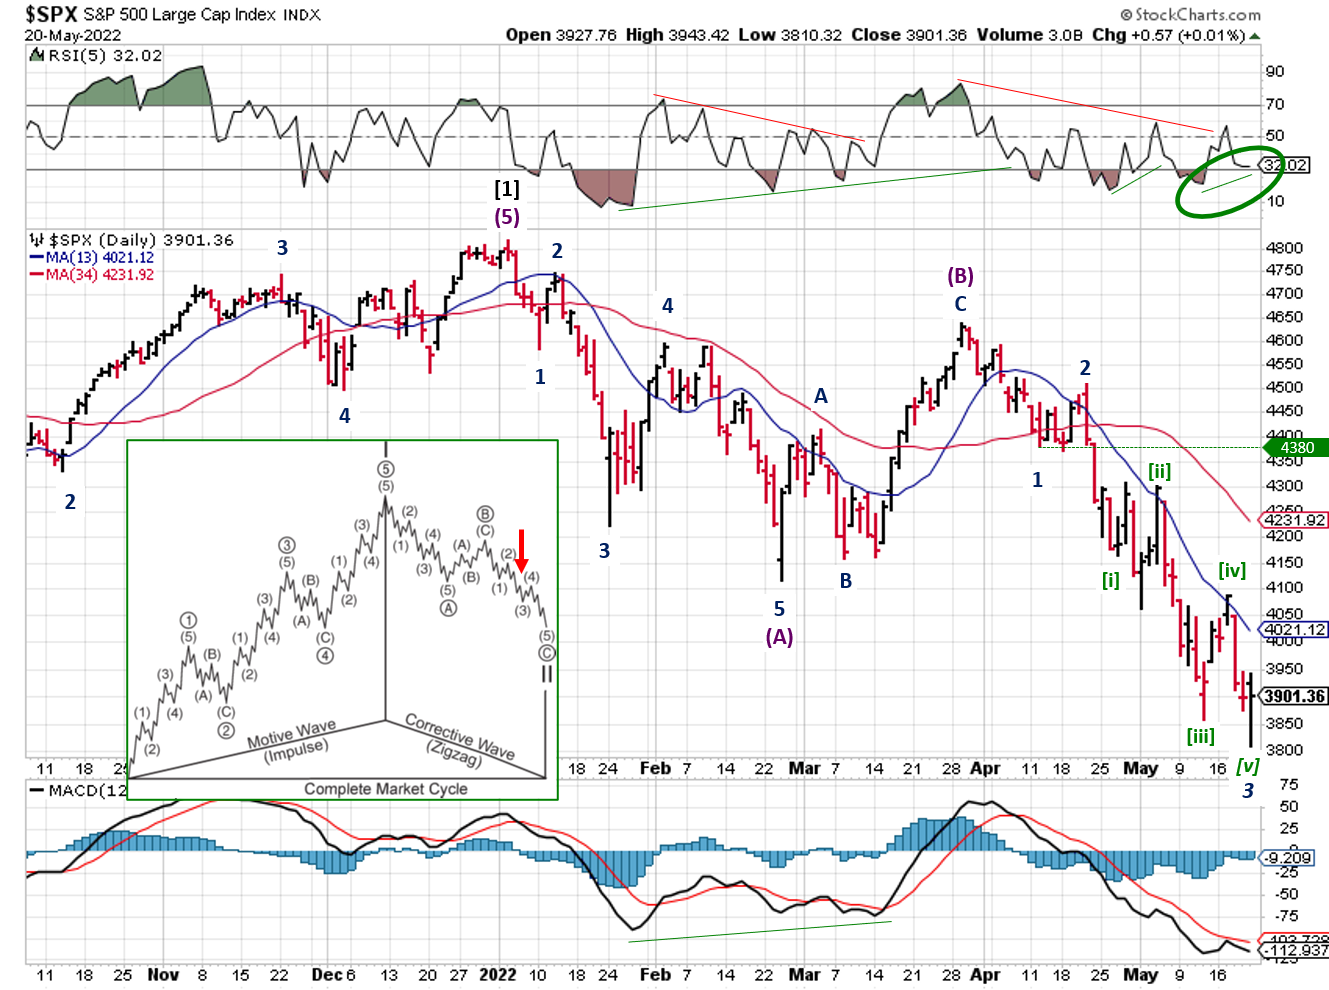
2022-05-22- SPX Elliott Wave Analysis - Daily - Primary 2
The current Elliott Wave count shows Minute [v] wave of Minor 3 should end soon (if not already), giving the SPX a chance to rally back towards the Minor 1 low (~4380). Note that there was another positive divergence in the RSI(5), but not the MACD; similar to the set-up at the end of April.
COMMENTARY
Another wild week. A couple of hedge funds closed their books, and a more hawkish Fed caught option traders by surprise. Then there were the earnings reports: Target and Walmart reported lower than expected margins and their stock prices were punished...as was most of the retail sector.
Many taking heads and so-called experts are pointing to a "strong" consumer as a reason to discount weakness in earnings reports. Don't be fooled. Consumers across the globe are struggling with high inflation, and that struggle won't show up in corporate earnings until the back half of this year.
"Sub-prime" credit data (which lags by a couple of months) shows that consumer credit card balances have already started to increase. This category of borrower is the first to feel the impact of higher inflation, and credit card can only prop up spending levels for so long. Next, expect to see delayed payments to increase (they're already beginning to inch higher).
Best To Your Week!
P.S. After "zooming out" last week, I was asked to "zoom out" even further. The result was "not good", and opens the possibility that the SPX has a longer and deeper correction than most investors anticipate. The specific question concerned Cycle I and II labels; is it possible the January peak 2022 was end of Cycle I? Previously, the count showed the Cycle I wave ending in mid-February 2020 when COVID-19 hit, Cycle II wave ending in late March, Primary [1] of Cycle III ending in January 2022.
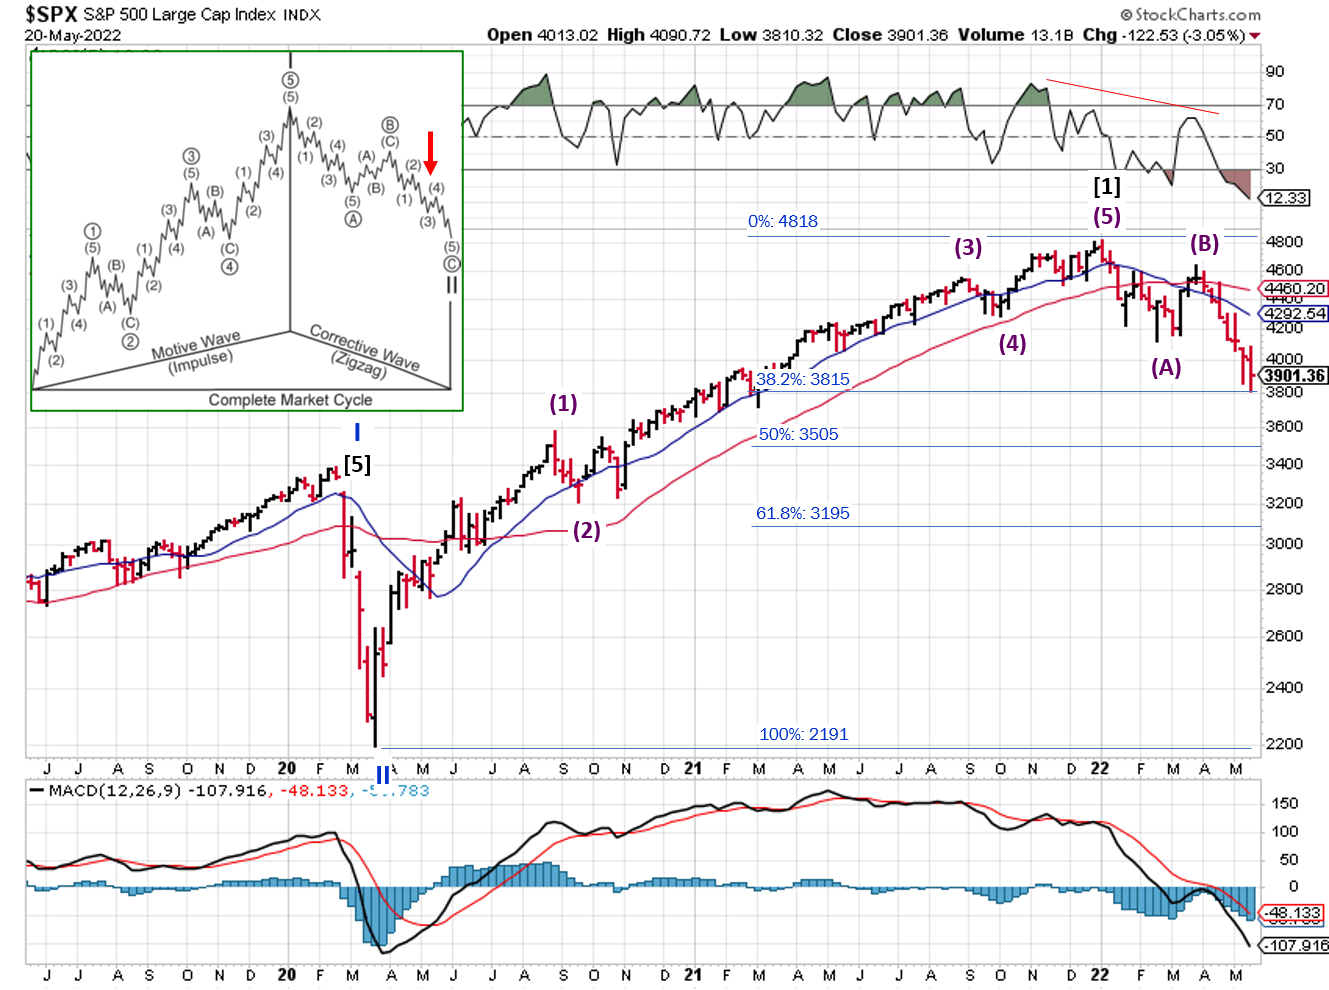
2022-05-22- SPX Elliott Wave Analysis - Weekly - Primary 2
But the bull market from 2009 (i.e. Cycle I wave) was courtesy of quantitative easing and low interest rates, and those conditions didn't end until this year. While correlation is not causation, it does make a convincing argument. Anecdotally, it makes sense that all of Cycle I would have a common backdrop.
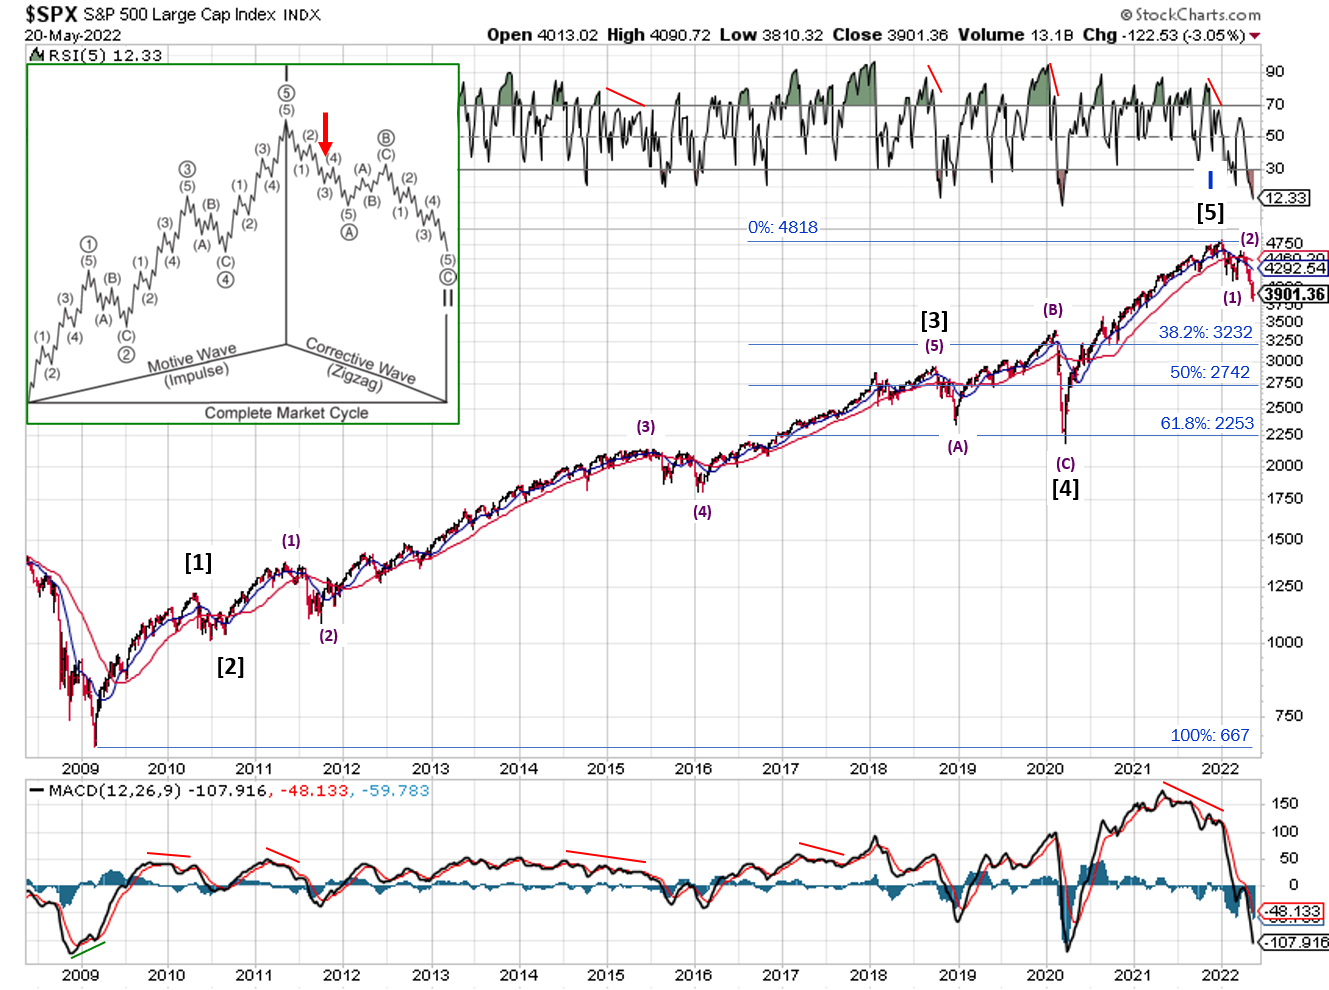
2022-05-22- SPX Elliott Wave Analysis - Weekly - Cycle 2
Looking back, a new count hinges on Primary [3] and Primary [4]; between 2018 and 2020. That period threw a lot of people off, and I STILL haven't seen a lot of agreement on the labeling. So it's definitely possible that Primary [4] was some type of “flat” or “combination" wave structure, paving the way for the post-COVID rally as Primary [5], and the January peak ending Cycle I. If Cycle I did end in January, then the wave structure I'm using for the outlook is off by one level.
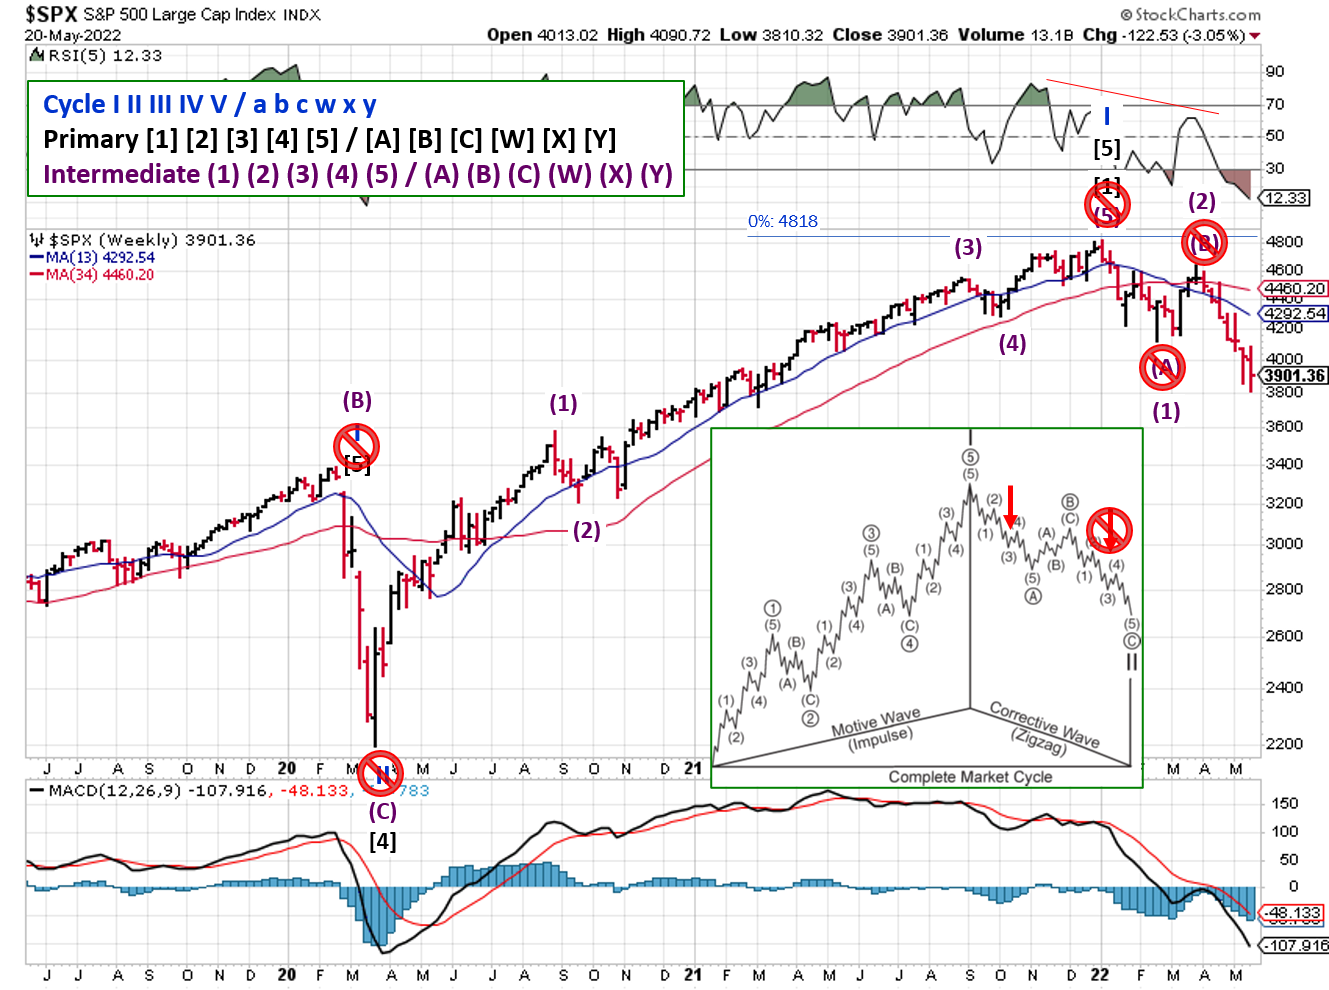
2022-05-22- SPX Elliott Wave Analysis - Weekly - Primary A
The implications are:
- The SPX is only halfway through the first downward wave a large bear market (Intermediate (3) wave of the Primary [A] of the Cycle II downtrend, rather than the Rather than being in the final leg of the correction/downtrend (Minor 3 of an Intermediate (C) Wave) ).
- When Primary [A] completes, the SPX will see a substantial bear market rally
- Then the SPX drops back towards pandemic lows and we've got another Crying Jordan on our hands
If you find this research helpful, please tell a friend. If you don't find it helpful, tell an enemy.
I regularly share articles and other news of interest via on Twitter (@investsafely), Facebook (InvestSafely),LinkedIn (Invest-Safely), and Instagram (@investsafely).

How to Make Money in Stocks: A Winning System in Good Times and Bad.
It's one of my favorites.
Invest Safely, LLC is an independent investment research and online financial media company. Use of Invest Safely, LLC and any other products available through invest-safely.com are subject to our Terms of Service and Privacy Policy. Not a recommendation to buy or sell any security.
Charts provided courtesy of stockcharts.com.
For historical Elliott Wave commentary and analysis, go to ELLIOTT WAVE lives on by Tony Caldaro. Current counts can be found at: Pretzel Logic, and 12345ABCDEWXYZ
Once a year, I review the market outlook signals as if they were a mechanical trading system, while pointing out issues and making adjustments. The goal is to give you to give you an example of how to analyze and continuously improve your own systems.
- 2015 Performance - Stock Market Outlook
- 2016 Performance - Stock Market Outlook
- 2017 Performance - Stock Market Outlook
- 2018 Performance - Stock Market Outlook
- 2019 Performance - Stock Market Outlook
- 2020 Performance - Stock Market Outlook
IMPORTANT DISCLOSURE INFORMATION
This material is for general communication and is provided for informational and/or educational purposes only. None of the content should be viewed as a suggestion that you take or refrain from taking any action nor as a recommendation for any specific investment product, strategy, or other such purpose. Certain information contained herein has been obtained from third-party sources believed to be reliable, but we cannot guarantee its accuracy or completeness.
To the extent that a reader has any questions regarding the applicability of any specific issue discussed above to his/her individual situation, he/she is encouraged to consult with the professional advisors of his/her choosing. Invest Safely, LLC is not a law firm, certified public accounting firm, or registered investment advisor and no portion of its content should be construed as legal, accounting, or investment advice.
The material is not to be construed as an offer or a recommendation to buy or sell a security nor is it to be construed as investment advice. Additionally, the material accessible through this website does not constitute a representation that the investments described herein are suitable or appropriate for any person.
Hypothetical Presentations:
Any referenced performance is “as calculated” using the referenced funds and has not been independently verified. This presentation does not discuss, directly or indirectly, the amount of the profits or losses, realized or unrealized, by any reader or contributor, from any specific funds or securities.
The author and/or any reader may have experienced materially different performance based upon various factors during the corresponding time periods. To the extent that any portion of the content reflects hypothetical results that were achieved by means of the retroactive application of a back-tested model, such results have inherent limitations, including:
Model results do not reflect the results of actual trading using assets, but were achieved by means of the retroactive application of the referenced models, certain aspects of which may have been designed with the benefit of hindsight
Back-tested performance may not reflect the impact that any material market or economic factors might have had on the use of a trading model if the model had been used during the period to actually manage assets
Actual investment results during the corresponding time periods may have been materially different from those portrayed in the model
Past performance may not be indicative of future results. Therefore, no one should assume that future performance will be profitable, or equal to any corresponding historical index.
The S&P 500 Composite Total Return Index (the "S&P") is a market capitalization-weighted index of 500 widely held stocks often used as a proxy for the stock market. Standard & Poor's chooses the member companies for the S&P based on market size, liquidity, and industry group representation. Included are the common stocks of industrial, financial, utility, and transportation companies. The S&P is not an index into which an investor can directly invest. The historical S&P performance results (and those of all other indices) are provided exclusively for comparison purposes only, so as to provide general comparative information to assist an individual in determining whether the performance of a specific portfolio or model meets, or continues to meet investment objective(s). The model and indices performance results do not reflect the impact of taxes.
Investing involves risk (even the “safe” kind)! Past performance does not guarantee or indicate future results. Different types of investments involve varying degrees of underlying risk. Therefore, do not assume that future performance of any specific investment or investment strategy be suitable for your portfolio or individual situation, will be profitable, equal any historical performance level(s), or prove successful (including the investments and/or investment strategies describe on this site).
Investing Process Links
Stabilize- Organize your $$$
- Manage your $$$
Plan
- Why You Invest
- Ways to Invest
- Where to Invest
- What to Invest In
Execute
- When to Invest
- How Much to Invest
- Buying & Selling
Monitor
- Track The Market
- Track Your Returns
Reflect & Adjust
- Improve Your Returns
- Adjust your Holdings
Popular Pages
- Jim Cramer- Personal Incomes Statements
- Hyperinflation
- Calculating Beta
- SMART Financial Goals
Blogroll
- Advisor Perspectives- Dividend Growth Investor
- Elliott Wave Lives On
- On My Radar | CMG Wealth
- Sure Dividend
- The Big Picture
- The Fat Pitch
- Thoughts from the Frontline
- Trader Feed
Sponsored Links
Invest Safely provides valuable, time-saving info about personal finance, money management, and investing.


