Stock Market Outlook
For The Week Of April 10th = Uptrend
INDICATORS
-
ADX Directional Indicators: Downtrend
Price & Volume Action: Uptrend
Elliott Wave Analysis: Mixed
The S&P500 ($SPX) fell 1.3% for the week. The index remains above the 50-day moving average, but did break the 200-day before coming to rest at that level to end the week.
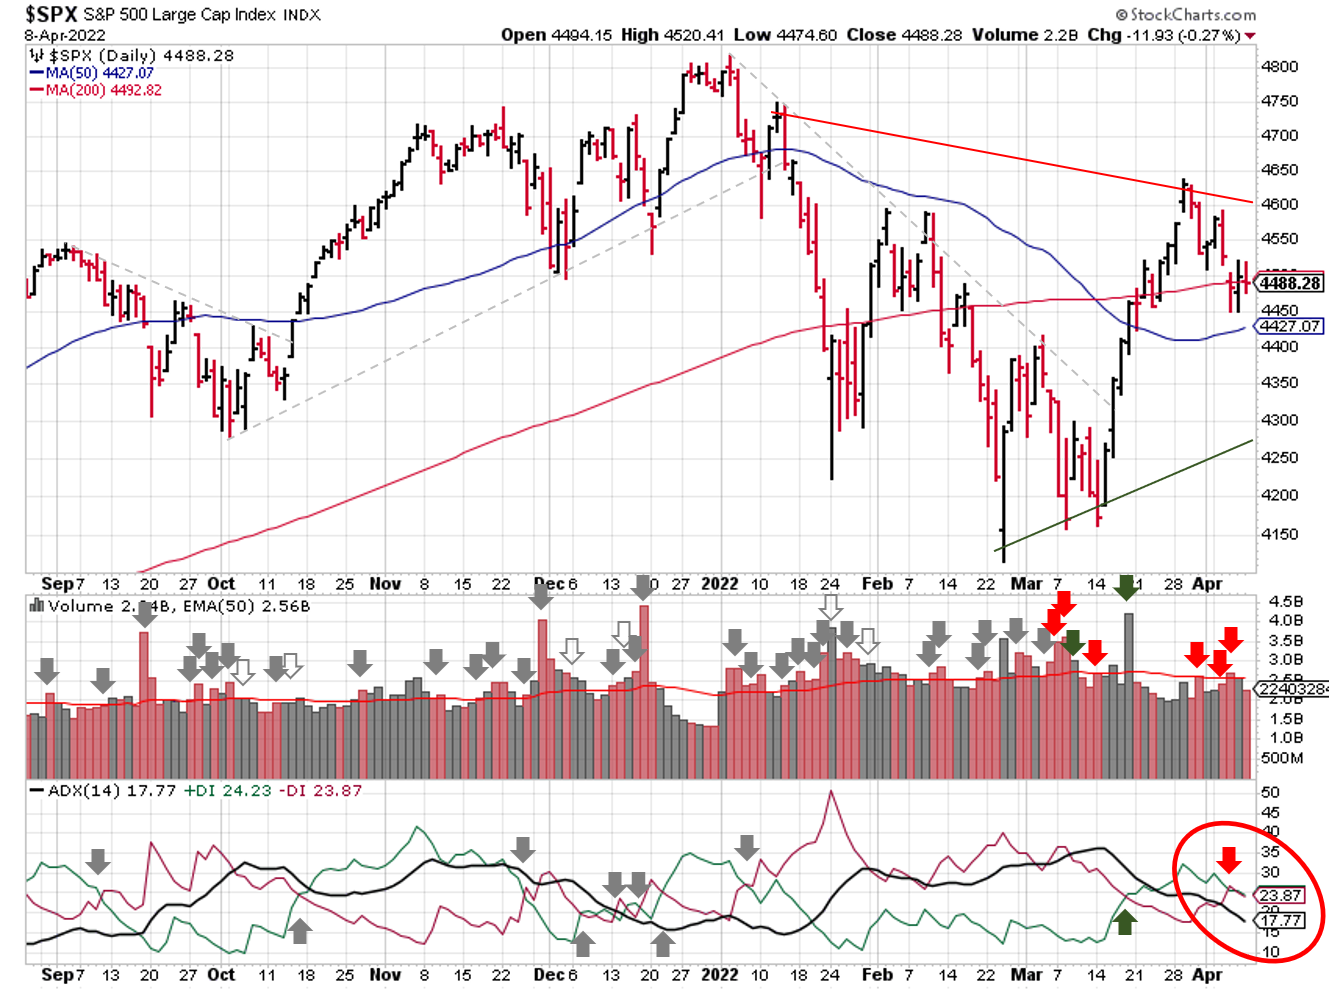
2022-04-10-SPX Trendline Analysis - Daily
The ADX fell below 20, meaning the market is no longer trending. The directional indicators crossed over mid-week, and remained bearish by a few tenths of a point.
Price and volume wasn't much help either. The index is still above the 50-day while 2 distribution days popped up.
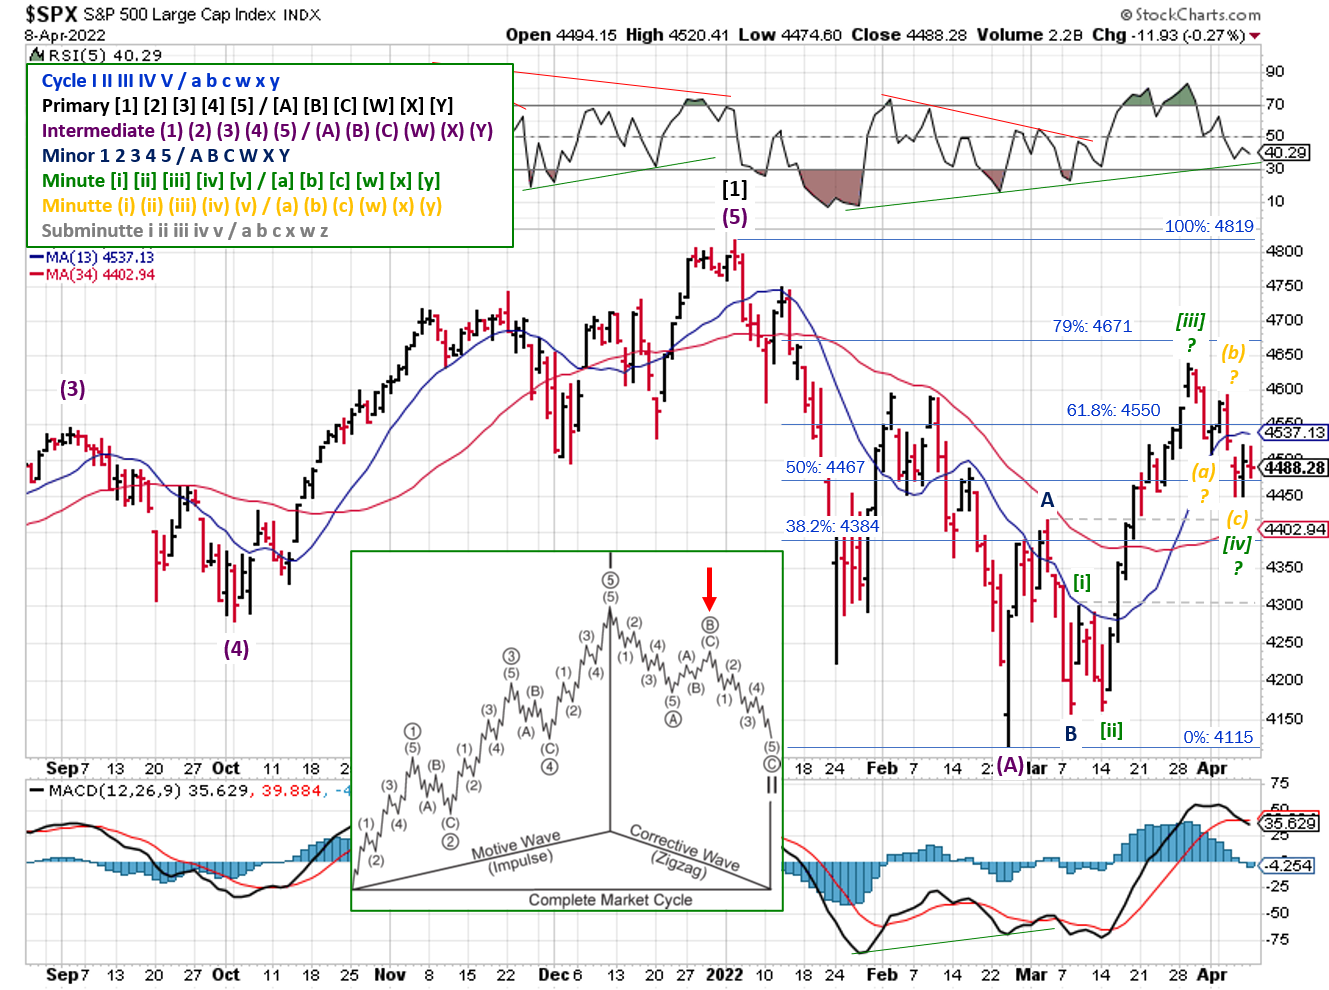
2022-04-10- SPX Elliott Wave Analysis - Daily - Primary 2
Elliott Wave is still mixed, since the SPX is still between confirmation levels. 4650–4670 to the upside and 4300 to the downside, though a close below 4416 would probably be enough.
COMMENTARY
The U.S. Federal Reserve released minutes from their March meeting last week. There's nothing really "new"; instead, the minutes show the likely path the Fed will take to try and lower inflation.
In addition to 0.5% rate hikes, which are now more probable rather than just a possibility, Fed members are in agreement on reducing the Fed's balance sheet (so-called Quantitative Tightening). Per Bloomberg, the treasury market is pricing in ~9 rate quarter-point rate hikes by the end of 2022! Seems unlikely, but stranger things have happened...
Markets are closed for Good Friday, making this a shorter trading week. But that doesn't mean there aren't opportunities for fireworks. March CPI data will be released Tuesday before market open, and retail sales come out on Thursday. And members of the Fed have speeches almost every day! So the stock market gets a few chances to show us what's already being priced in versus what still needs to be digested.
Q1 earnings season also kicks off this week, with several major banks reporting on Wednesday and Thursday).
#earnings for the week https://t.co/lObOE0dgsr $JPM $KMX $TSM $DAL $WFC $BLK $BBBY $GS $C $ACI $MS $UNH $OGI $RAD $PNC $ALLY $FAST $ERIC $INFY $USB $FRC $PGR $STT $THTX $RENT $WAFD $SGHC $HLBZ $SJR $TNP $ESCA $SGML $MIMO $BYSI $PIII pic.twitter.com/6iQqT8CCMM
— Earnings Whispers (@eWhispers) April 9, 2022
And finally, the third Friday in April is options expiration, so monthly/weekly option expiration will shift to Thursday due to the market closure.
Best To Your Week!
If you find this research helpful, please tell a friend. If you don't find it helpful, tell an enemy.
I regularly share articles and other news of interest via on Twitter (@investsafely), Facebook (InvestSafely),LinkedIn (Invest-Safely), and Instagram (@investsafely).

How to Make Money in Stocks: A Winning System in Good Times and Bad.
It's one of my favorites.
Invest Safely, LLC is an independent investment research and online financial media company. Use of Invest Safely, LLC and any other products available through invest-safely.com are subject to our Terms of Service and Privacy Policy. Not a recommendation to buy or sell any security.
Charts provided courtesy of stockcharts.com.
For historical Elliott Wave commentary and analysis, go to ELLIOTT WAVE lives on by Tony Caldaro. Current counts can be found at: Pretzel Logic, and 12345ABCDEWXYZ
Once a year, I review the market outlook signals as if they were a mechanical trading system, while pointing out issues and making adjustments. The goal is to give you to give you an example of how to analyze and continuously improve your own systems.
- 2015 Performance - Stock Market Outlook
- 2016 Performance - Stock Market Outlook
- 2017 Performance - Stock Market Outlook
- 2018 Performance - Stock Market Outlook
- 2019 Performance - Stock Market Outlook
- 2020 Performance - Stock Market Outlook
IMPORTANT DISCLOSURE INFORMATION
This material is for general communication and is provided for informational and/or educational purposes only. None of the content should be viewed as a suggestion that you take or refrain from taking any action nor as a recommendation for any specific investment product, strategy, or other such purpose. Certain information contained herein has been obtained from third-party sources believed to be reliable, but we cannot guarantee its accuracy or completeness.
To the extent that a reader has any questions regarding the applicability of any specific issue discussed above to his/her individual situation, he/she is encouraged to consult with the professional advisors of his/her choosing. Invest Safely, LLC is not a law firm, certified public accounting firm, or registered investment advisor and no portion of its content should be construed as legal, accounting, or investment advice.
The material is not to be construed as an offer or a recommendation to buy or sell a security nor is it to be construed as investment advice. Additionally, the material accessible through this website does not constitute a representation that the investments described herein are suitable or appropriate for any person.
Hypothetical Presentations:
Any referenced performance is “as calculated” using the referenced funds and has not been independently verified. This presentation does not discuss, directly or indirectly, the amount of the profits or losses, realized or unrealized, by any reader or contributor, from any specific funds or securities.
The author and/or any reader may have experienced materially different performance based upon various factors during the corresponding time periods. To the extent that any portion of the content reflects hypothetical results that were achieved by means of the retroactive application of a back-tested model, such results have inherent limitations, including:
Model results do not reflect the results of actual trading using assets, but were achieved by means of the retroactive application of the referenced models, certain aspects of which may have been designed with the benefit of hindsight
Back-tested performance may not reflect the impact that any material market or economic factors might have had on the use of a trading model if the model had been used during the period to actually manage assets
Actual investment results during the corresponding time periods may have been materially different from those portrayed in the model
Past performance may not be indicative of future results. Therefore, no one should assume that future performance will be profitable, or equal to any corresponding historical index.
The S&P 500 Composite Total Return Index (the "S&P") is a market capitalization-weighted index of 500 widely held stocks often used as a proxy for the stock market. Standard & Poor's chooses the member companies for the S&P based on market size, liquidity, and industry group representation. Included are the common stocks of industrial, financial, utility, and transportation companies. The S&P is not an index into which an investor can directly invest. The historical S&P performance results (and those of all other indices) are provided exclusively for comparison purposes only, so as to provide general comparative information to assist an individual in determining whether the performance of a specific portfolio or model meets, or continues to meet investment objective(s). The model and indices performance results do not reflect the impact of taxes.
Investing involves risk (even the “safe” kind)! Past performance does not guarantee or indicate future results. Different types of investments involve varying degrees of underlying risk. Therefore, do not assume that future performance of any specific investment or investment strategy be suitable for your portfolio or individual situation, will be profitable, equal any historical performance level(s), or prove successful (including the investments and/or investment strategies describe on this site).
Investing Process Links
Stabilize- Organize your $$$
- Manage your $$$
Plan
- Why You Invest
- Ways to Invest
- Where to Invest
- What to Invest In
Execute
- When to Invest
- How Much to Invest
- Buying & Selling
Monitor
- Track The Market
- Track Your Returns
Reflect & Adjust
- Improve Your Returns
- Adjust your Holdings
Popular Pages
- Jim Cramer- Personal Incomes Statements
- Hyperinflation
- Calculating Beta
- SMART Financial Goals
Blogroll
- Advisor Perspectives- Dividend Growth Investor
- Elliott Wave Lives On
- On My Radar | CMG Wealth
- Sure Dividend
- The Big Picture
- The Fat Pitch
- Thoughts from the Frontline
- Trader Feed
Sponsored Links
Invest Safely provides valuable, time-saving info about personal finance, money management, and investing.


